The pandemic severely dented consumer confidence in India, which reached historic lows as the repercussions of COVID-19 unfolded. Sentiments of households across strata were influenced by the spread of infections and fatalities. There was enduring impact on consumers’ sentiments on their own financial conditions as well as the general economic situation – with the latter increasingly driven by the former. Consumers in cities severely hit by the pandemic expressed more negative sentiments as compared to respondents in the other cities. Nevertheless, despite low perception of the prevailing situation, respondents’ expectations for the year ahead showed faith in economic recovery after subsidence of the pandemic. Introduction The COVID-19 pandemic, which began in early 2020, is a major disruption which created global economic turmoil. With the outbreak of the pandemic, countries across the globe imposed strict restrictions on movement and gathering of people, and in a matter of weeks, bulk of humanity was restricted to the confines of their homes. This had a severe impact on the demand for goods and services in the economy, resulting in many sectors being severely hit, while some functioned with reduced capacity. Not only was there lower demand, but also a shift in consumption expenditure, as the expenditure on non-essentials saw major reductions. This is likely to have had an adverse impact on the sales and profitability of businesses, resulting in significant shocks to employment and income across the economy. As the pandemic’s impact reverberated across the economy, governments and other public authorities across the globe rolled out relief packages for households and businesses. Considering the extraordinary circumstances, central banks cut interest rates to reduce the cost of funds, adopted an accommodative stance, and introduced some regulatory forbearance. Despite the support and relief measures, many households went through falling incomes and job losses. The added uncertainty regarding future waves of the pandemic resulted in highly volatile consumer confidence since the start of the pandemic. Consumers’ perception of the prevailing economic situation and their expectations for the future also influence their spending, saving and investment behaviour. During economic expansion, consumers are usually more confident about their income and may spend more. On the other hand, when the economy contracts, the consumers are, generally, more pessimistic about their future and may try to save more by curbing their spending. This has a pro-cyclical effect on the economy. Thus, consumer confidence is a key economic indicator which gives an idea about this aspect. Major countries conduct consumer confidence surveys which provide timely and forward-looking measures of economic uncertainty to formulate suitable policy measures. The pandemic has been very brutal in India, especially during the second wave in April-May 2021, when the daily new cases shot up to 4,00,000 per day, at its peak. In this context, it is essential to study the impact of the pandemic on consumer confidence of the Indian consumers. This article mainly analyses this impact, as gauged by the RBI’s Consumer Confidence Survey (CCS)1. Section II reviews the literature on impact of consumer confidence on consumer behaviour, behaviour of consumers during crises and the impact of this specific crisis on consumer confidence in major regions. Section III reviews the performance of consumer confidence indicators since May 2019. Section IV aims to show, empirically, the impact of the pandemic on consumer confidence indicators in India, across cities and occupation groups. Finally, Section V concludes with some major takeaways. II. Literature Review The link between consumer confidence indicators and economic activity is found to be more relevant during crisis periods, like recession or depression, or during big political and economic upheavals. Dees and Brinca (2013) showed that consumer confidence explains consumption expenditure better when the survey indicators exhibit large changes. Carroll et al.. (1994) claimed that lags of Michigan Consumer Sentiment Index (MCSI) in the US have explanatory power for household spending changes. Increased uncertainty drives households to cut their spending, while habit formation delays the adjustment of consumption spending. Olivier et al.. (2021) found that higher macroeconomic uncertainty induces households to reduce their spending on non-durable goods and services in subsequent months, as well as fewer purchases of large ticket items such as package holidays or luxury goods. Additionally, they found that macroeconomic uncertainty can impact household decisions and have large negative effects on economic outcomes. Studies have found that the pandemic and consequent lockdowns adversely impacted the consumer confidence in various countries. A technical paper by the European Commission (2020) found that the outbreak of COVID-19 and the ensuing lockdown affected the economic activity of Euro Area and consequently, consumer confidence plummeted during March and April 2020. Deimante et al.. (2021) also found that the COVID-19 pandemic affected the consumer confidence of United States and China. III. Consumer Confidence before and during the Pandemic Consumer Confidence Indices The pandemic had a major impact on consumer confidence in most countries. Chart 1 shows the consumer confidence index for 7 major economies, viz., USA, Great Britain, Japan, China, Russia, Brazil, and South Africa. Most countries witnessed a major slump in confidence when the pandemic first hit their shores, and then gradually started to rise, though it is yet to return to pre-pandemic levels in most countries. Rising rates of vaccination may help in recovery, but repeated bouts of COVID-19 are expected to have an impact on consumer confidence, especially with the associated uncertainty regarding business and employment situation. 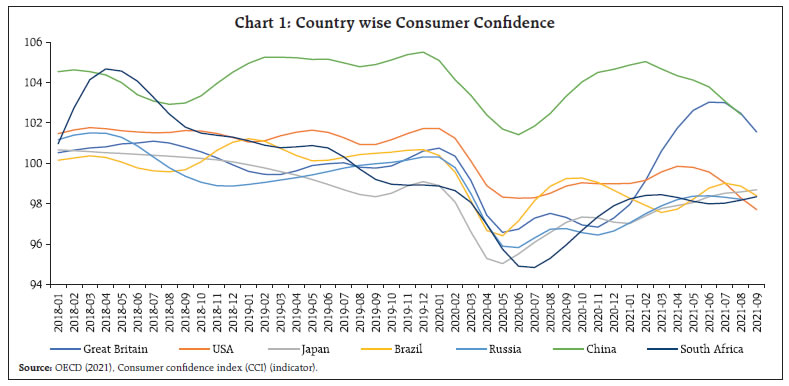 As discussed earlier, the relationship between consumer confidence and economic activity runs both ways. Thus, the level of economic activity in the country, as measured by growth rates of the economy, are expected to affect the consumer confidence in the country. Chart 2 shows the real GDP growth rates for India since Q1: 2012-13. Data reveals that the economy was slowing down even before the pandemic, since Q1: 2018-19, which turned into a contraction with the pandemic induced restrictions in Q1: 2020-21. Since then, the economy has been on a path to recovery, with growth rates returning to positive territory in Q3: 2020-21. 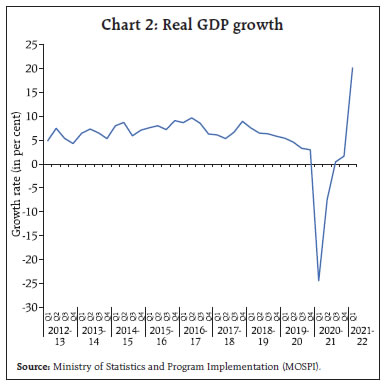 In the Reserve Bank’s Consumer Confidence Survey, during the period when the economy was going through a slowdown, the Current Situation Index (CSI) was in the pessimistic zone for most survey rounds during 2019 (Chart 3). The outbreak of the COVID-19 pandemic in early 2020 had a further negative impact on the confidence level, weakening it to 63.7 in May 2020. Since then, it has been on a declining trajectory and hit the survey’s all-time low of 48.5 in May 2021 with the onset of the second wave. However, with the gradual abatement of the second wave, some rise was seen in current sentiments, though they still remained highly negative. In contrast, the respondents were comparatively optimistic about the future, as the future expectations index (FEI) was mostly in the positive territory (above 100). FEI was moving in tandem with the CSI till May 2020, when it first entered negative territory during the first phase of countrywide lockdowns, but started improving from July 2020 onwards with gradual easing of the pandemic related restrictions. However, with the onset of the second wave in April 2021 and the severe restrictions imposed to break the chain of transmission, expectations for the future again fell into pessimistic territory (below 100), for the second time during the pandemic. Gradual recovery in expectations was visible in July and September, with the sudden drop in caseload and easing of restrictions, but despite the low base, expectations have not been overwhelmingly positive for the year ahead as compared to the current period, indicating that the consumers expect the aftereffects of the pandemic to linger for the foreseeable future. 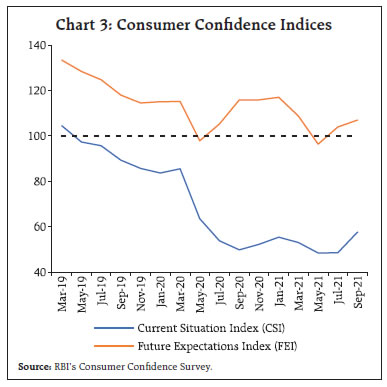 Along with inquiring about the households’ assessment of the overall economy, the survey also records their perception about the changes in their own incomes and expenditures. The following sections present an overview of households’ assessment and expectations for individual survey parameters, segregated based on whether they pertain to the overall economy or households’ own circumstances2. Consumers’ view about the overall economy Consumers sensed a protracted slowdown in the economy even before the outbreak of the pandemic (Chart 4). During the study period, the movement in net response on perception of general economic situation mirrored the movement for employment scenario. In conjunction with a perception of worsening employment scenario (Chart 5), majority of the consumers perceived a year-on-year worsening in general economic situation. The survey fieldwork for the May 2021 round coincided with the brutal second wave of the COVID-19 pandemic, resulting in sentiments for general economic scenario and employment scenario recording their historical lows in the round. Moreover, majority of the respondents in all rounds of the survey reported higher prices and inflation as compared to a year ago (Chart 6a and 6b). A general perception of high prices and rising inflation further aggravated the situation for the consumers already worried by employment scenario and general economy. 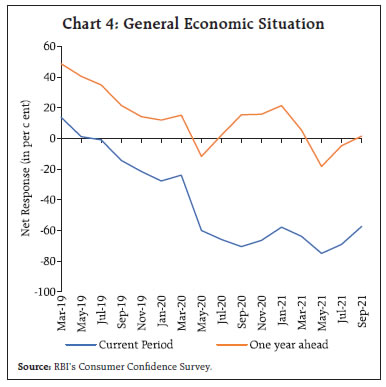
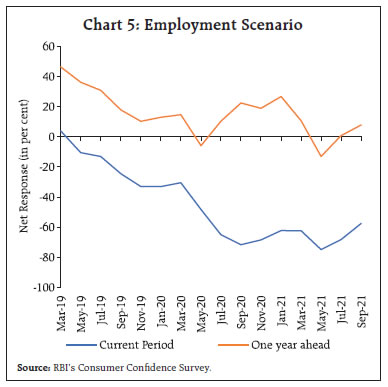 Consumers’ expectations for one year ahead general economic situation and employment scenario were optimistic till March 2020, following which the outbreak of the pandemic and concomitant restrictions turned them pessimistic in May 2020. Expectations, however, turned positive immediately from the next round in July 2020 onwards. Nevertheless, with the onset of the second wave in April 2021, the expectations have witnessed sharp falls, despite the low base for the contemporaneous period, indicating that the consumers expect the pandemic to have lingering aftereffects. 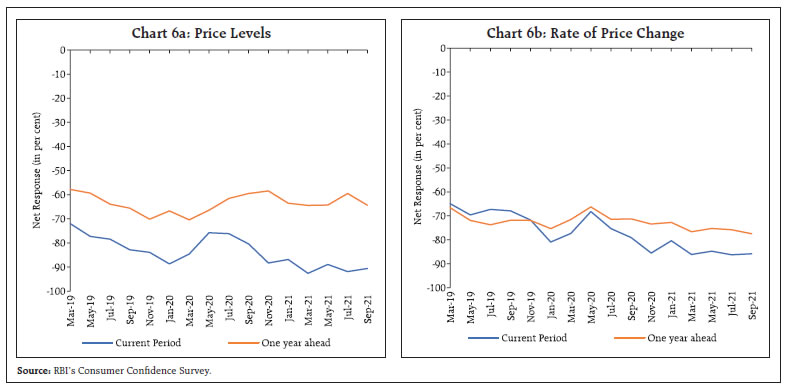 Although consumers expect prices to be higher in the short term, the proportion of respondents expecting higher prices and inflation is much lower than those perceiving higher prices and inflation as compared to a year ago. This gap has widened during the pandemic period, pointing towards price shocks during the lockdown and concomitant supply chain disruptions impacting the perceptions, but expectations remained relatively unimpacted by such short-term shocks. Consumers’ assessment of their own circumstances Alongside an assessment of the overall economy, consumers’ confidence is also impacted by what they perceive about their own income situation and their consumption expenditure. Lower incomes and contraction in expenditure for households are likely to drag the overall demand in the economy, even if the other sectors are doing relatively well. On the other hand, high demand in the household sector provides a boost for the overall demand in the economy. Households’ income sentiments remained afloat till March 2020, though there were episodes of net response entering negative territory in some rounds. However, with the outbreak of the pandemic, the income situation of the households took a massive hit, with an overwhelming majority of the consumers reporting decreased incomes as compared to a year ago (Chart 7). As a result, the net response for current period household income fell by more than 50 per cent during March to July 2020, a period during which most of the economy was shut and the GDP saw a massive contraction. Respondents, however, remained optimistic about an increase in their future income. The net response on future income comoved with that for current income till May 2020 and touched a low of 18.1, but since then, the gap has widened with the expectations rescaling pre-COVID-19 levels in September 2020. 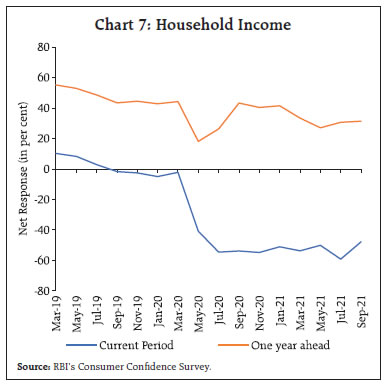 The parameter of household spending has traditionally been the most resilient of the survey parameters, in terms of retaining its high levels even in the scenario of other parameters falling. Therefore, the sharp fall in net response for current household spending from a steady 70-75 per cent level till March 2020 to just over 25 per cent in September 2020 reflected the unusual distress that the households found themselves in during the pandemic. Expectations for future overall spending were similar, both in terms of absolute levels and directional changes, till March 2020 but since then, akin to the other survey parameters, a 15-20 per cent gap is seen between the perceptions and expectations (Charts 8a and 8b). The overall spending is mostly driven by the spending on essential items as co-movement has been observed between the two parameters during the study period. While the net response for current overall spending and essential spending was stable till March 2020, the net response for non-essential spending has been deteriorating steadily since July 2018 and entered negative zone in November 2019. The outbreak of the pandemic had a further impact on the spending on non-essential items, as about 60 per cent of the respondents reported decrease in their spending on non-essential items. Though respondents were more optimistic about their future spending on non-essential items, the net response has been declining steadily since July 2018, and even been in the negative zone since the start of the pandemic. IV. The Impact of COVID-19 – An Empirical Analysis Coherence between parameters – Pre-pandemic vs. during the pandemic A study of the coherence between myriad survey parameters aims to show which other aspects weigh on the consumers’ minds when responding about a particular parameter. Table 1 presents the coherence3 between different survey parameters for the study period (May 2019 to September 2021). The survey rounds up to March 2020 are classified as pre-pandemic rounds, whereas all subsequent rounds, till September 2021, are classified as pandemic affected rounds. The results reveal that for most rounds, current perception of general economic situation is generally most aligned with employment scenario and prices, while coherence between general economic situation and spending is marginal. However, household income has become increasingly more coherent with general economic situation and employment scenario during the pandemic, indicating that lower household incomes have been a major factor behind the highly negative perceptions for these two parameters. Thus, employment, prices and recently, household incomes, have been the major influence on consumers’ perception of general economic situation. | Table 1: Coherence between Survey Parameters | | (Percentage of respondents) | | Survey Parameters | Current Perception | Future Expectations | | Pre-Pandemic rounds* | Pandemic rounds^ | Pre-Pandemic rounds | Pandemic rounds | | General Economic Situation (GES) | Employment | 59.4 | 73.0 | 68.9 | 68.8 | | Prices | 48.1 | 71.7 | 37.9 | 45.0 | | Income | 39.5 | 59.7 | 48.8 | 45.4 | | Spending | 30.1 | 25.3 | 46.1 | 38.1 | | Employment Scenario | GES | 59.4 | 73.0 | 68.9 | 68.8 | | Income | 40.2 | 59.3 | 48.7 | 47.6 | | Essential Spending | Prices | 79.1 | 67.5 | 69.7 | 62.1 | | GES | 30.6 | 21.2 | 48.1 | 39.6 | | Income | 33.0 | 26.9 | 56.4 | 51.7 | | Non-essential Spending | GES | 36.5 | 54.3 | 37.3 | 37.8 | | Income | 44.8 | 55.8 | 46.1 | 43.3 | | Employment | 36.5 | 53.5 | 37.4 | 37.6 | | Prices | 33.7 | 15.1 | 38.7 | 30.6 | * May 2019 to March 2020 round
^ May 2020 to September 2021 round | Over the survey rounds, overall spending has mostly been driven by essential spending, as discussed in the previous section. For the two components of overall spending, viz., essential and non-essential spending, it may be hypothesised that essential spending should be more influenced by prices, being relatively inelastic in demand, while non-essential spending, being more discretionary in nature, would be driven by general economic situation, employment and household income rather than prices. This is substantiated by the coherence data as well, where essential spending is most aligned with prices. The level of coherence has come down marginally during the pandemic rounds but remains above 67 per cent. On the other hand, non-essential spending is more aligned with general economic situation, employment and household incomes, and the level of coherence has increased sharply during the pandemic, while prices are weakly aligned. For expectations one year ahead, though the overall trend remains similar to that discussed above, not much difference is seen between pre-pandemic and the pandemic rounds. As discussed in the previous section, while expectations have gone down in some rounds during the pandemic, when the disease prevalence and restrictions were highest, the change as compared to pre-pandemic rounds has been much less stark as compared to that for the contemporaneous perception. The findings for coherence further substantiate the fact that expectations have been, relatively, less impacted by the pandemic than the perception for prevailing circumstances. The influence of the spread and severity of the pandemic Further, the impact of COVID-19 related variables4, viz., the number of confirmed cases and deaths in each state and at an all-India level, on the city wise consumer confidence was studied using a panel regression. The following equation with controlled city level effects was estimated to see the relationship between CSI, FEI and COVID-19 related variables, using the data of eight rounds of CCS from May 2020 till September 2021 and corresponding months’ data of COVID-19 related variables. where, Yi: Consumer confidence indicators, viz., CSI and FEI; Xi: Monthly data on COVID-19 related variables like number of confirmed cases in the state, number of deaths in the state, number of confirmed cases in India and number of deaths in India; and, j denotes the jth city and t denotes time. It was observed that the CSI and FEI demonstrated a negative reaction to the increase in the caseload and deaths associated with COVID-19, at both the state and national level. Thus, consumer confidence waned as cases and fatalities rose, while improvements in the pandemic situation led to relative recovery (Table 2). The impact on city wise indices To see the impact of COVID-19 on different cities, the average CSI was compared for the survey rounds before the pandemic (May 2018 to March 2020) and after the outbreak. The same was compared with the state wise cumulative number of Covid cases at the end of September 2020. It was observed that metro cities like Bengaluru, Mumbai and Delhi, where the cases were very high, recorded a substantial deterioration in the average CSI after the outbreak of COVID-19 pandemic as compared to the other cities. Though the number of cases was high in Thiruvananthapuram, it showed the lowest reduction in the average CSI as compared to other cities. Among smaller cities, Bhopal showed highest deterioration in the average CSI (Chart 9a). The pandemic had a higher impact on the sentiments for the current period as compared to expectations, for all cities, as indicated by the average CSI and FEI values. The variation in FEI was higher for major cities like Bengaluru, Ahmedabad, Kolkata and Hyderabad (Chart 9b). | Table 2: Panel regression models of COVID-19’s impact on the consumer sentiment indicators | | Variable | Model Const. | Coefficient | P Value | Adj R2 | Number of Observations | | Current Situation Index | | No of Confirmed Cases in the state (Monthly) | 60.3 | -0.000019 | 0.00* | 0.2 | 129 | | No of Deaths in the state (Monthly) | 60.2 | -0.001305 | 0.00* | 0.2 | 129 | | No of Confirmed Cases in India (Monthly) | 61.7 | -0.00000172 | 0.00* | 0.24 | 130 | | No of Deaths in India (Monthly) | 61.8 | -0.000136 | 0.00* | 0.26 | 130 | | Future Expectations Index | | No of Confirmed Cases in the state (Monthly) | 111.3036 | -0.00000921 | 0.11 | 0.4 | 129 | | No of Deaths in the state (Monthly) | 111.5462 | -0.000867 | 0.03** | 0.41 | 129 | | No of Confirmed Cases in India (Monthly) | 112.6888 | -0.0000012 | 0.01** | 0.44 | 130 | | No of Deaths in India (Monthly) | 112.9365 | -0.0000987 | 0.0* | 0.45 | 130 | | *Significant at 1% level.** Significant at 5% level |
The impact on various occupation categories Further, the impact of the COVID-19 pandemic on the different occupation categories was studied by comparing the average CSI and FEI for the survey rounds prior to the pandemic (May 2018 to March 2020) and after the outbreak of COVID-19 i.e., post March 2020 (Table 3). It was observed that the pandemic had an impact across occupation categories, as the average CSI for most of them has deteriorated by above 40 per cent after the outbreak of the pandemic. Amongst various occupation categories, data shows that the ‘Retired/Pensioners’ were the least affected by the pandemic as shown by the deterioration in CSI (-34.1 per cent). However, the FEI deteriorated only by an average 11 per cent for various occupation categories. ‘Retired/Pensioners’ and ‘Self Employed/ Business’ were less pessimistic about the year ahead as compared to the other occupation categories. | Table 3: Occupation Category Wise Impact on Consumer Confidence | | Occupation Categories | % change in CSI | % change in FEI | | Employed | -41.9 | -12.8 | | Self Employed/ Business | -44.2 | -10.1 | | Homemaker | -43.9 | -11.6 | | Daily worker | -41.9 | -11.0 | | Retired/Pensioners | -34.1 | -8.5 | | Unemployed | -43.6 | -12.5 | V. Conclusion The outbreak of COVID-19 pandemic severely affected the consumer confidence across the globe, including India. Analysis reveals that the consumers’ perception about the prevailing situation is severely impacted by the pandemic, while the expectations about the future have been relatively optimistic, despite being dented in successive rounds. With the proactive steps taken by the Government and other public authorities, along with the ongoing vaccination programme, expectations have recovered relatively faster than perceptions. Amongst the survey indicators, household income was impacted the most by the pandemic induced restrictions, causing consumer confidence to hit multiple lows during this period. The effect of lower incomes is seen on consumers’ perception about general economic situation and employment as well. Moreover, these parameters seem to be the major drivers of lower discretionary spending by consumers. Overall spending has been shored up by essential spending, which is mostly influenced by prices. Sustained momentum in the ongoing reform measures by the Government may help in improving the employment and income situation amongst households, leading to a gradual recovery in consumer confidence. References Dees, S. and Brinca, P. S. (2013), “Consumer confidence as a predictor of consumption spending: Evidence for the United States and the Euro area”, International Economics, Volume 134, August 2013, Pages 1-14 Deimante Teresiene, Greta Keliuotyte-Staniuleniene, Yiyi Liao, Rasa Kanapickiene, Ruihui Pu, Siyan Hu and Xiao-Guang Yue (2021). The Impact of the COVID-19 Pandemic on Consumer and Business Confidence Indicators. J. Risk Financial Manag. 2021, 14, 159 Carroll, C., Fuhrer, G. & Wilcox, D. (1994). Does Consumer Sentiment Forecast Household Spending? If So, Why? American Economic Review. 84 (5):1397-1408 Olivier Coibion, Dimitris Georgarakos, Yuriy Gorodnichenko, Geoff Kenny, Michael Weber (2021) The effect of macroeconomic uncertainty on household spending. Working Paper Series, European central bank, May 2021 European Commission (2020). European Business Cycle Indicators, 2nd Quarter 2020, TECHNICAL PAPER 041 | JULY 2020 Kumar, N., Mishra, A. and Singh, D. P. (2019), “The Consumer Rules! Some Recent Survey-based Evidence”, RBI Bulletin April 2019
|