During the COVID-19 time, Indian agriculture has exhibited remarkable resilience. This article highlights the significant achievements of the sector even before the outbreak of COVID-19 and assesses that new emerging challenges warrant a second green revolution along with next generation reforms. Despite the success in terms of production that has ensured food security in the country, food inflation and its volatility remain a challenge, which requires supply side interventions such as higher public investment, storage infrastructure and promotion of food processing as per the empirical findings of this article. Introduction India has witnessed a silent revolution evolving from food deficient and import dependent nation during the early nineteen sixties to a global agricultural powerhouse today. India has emerged as the world’s largest producer of milk, pulses, jute and spices, and has the world’s largest cattle herd (buffaloes). It is the second largest producer of rice, wheat, cotton, sugarcane, tea, groundnut, fruits, vegetables and goat meat. Although the share of agriculture has been declining in overall gross value added (GVA) of India, it continues to grow in absolute terms and employs almost 49 per cent of the total households (PLFS, 2020). The agriculture sector could withstand the COVID-19 shock and registered an above average real growth of 3.6 per cent in 2020-21, even as the overall economy (real GVA) contracted by 6.2 per cent. In view of concerns about successive waves of COVID-19, many countries have started stockpiling food grains acquired at higher prices, whereas India remains comfortable with public stocks of cereals at 2.8 times the buffer norms (Chandrashekhar and Ghosh, 2021), a record increase in agricultural export of 17.1 per cent in 2020-21 and large increase in procurement of marketed surplus in 2020-21 and 2021-22. Despite such gains, Indian agriculture faces issues associated with adaptation to climate change disturbances, fragmented landholdings, low farm productivity and high food price volatility which call for next generation reforms like adoption of environmentally sustainable and climate resistant new farm technology, development of market for land consolidation and improvement in post-harvest practices. In this backdrop, this article is organised as follows: Section II of the article highlights the major achievements of the agriculture sector in the recent period. Section III describes the key enablers of agricultural growth. Some of the present constraints and emerging challenges are discussed in Section IV. In Section V, an attempt has been made to empirically assess the influence of supply side hindrances on retail food inflation and its volatility. Section VI concludes the article. II. Major Achievements II. 1 Record Production of Foodgrains Indian agriculture witnessed a distinct step up in growth of output following the green revolution in the 1960s driven by intensive use of inputs and technological advancement, which was sustained during the seventies and eighties (Chart 1). Notwithstanding some deceleration during the early 2000s, the average production of foodgrains has increased significantly in the last decade aided by higher agriculture credit, public and private investment, increased usage of quality seeds and fertilisers, expansion of acreage under irrigation and increase in cropping intensity (Chand & Parappurathu, 2012). Besides increased accessibility to key farm inputs, the price support policy of the government (driven by minimum support price) has also played a significant role in boosting the production of cereals and pulses resulting in consecutive record production of foodgrains since 2016-17. II. 2 Diversification towards Horticulture Crops Horticulture production has outpaced foodgrains production since 2012-13 and it currently accounts for around 35 per cent of total value of crop output in the agriculture sector (Chart 2a). The growth in horticulture production has been almost equally driven by growth in area and productivity1 as against largely productivity driven growth in the case of foodgrains (Chart 2b). The yield driven growth in foodgrains production in the aftermath of green revolution made diversification of area towards high value horticultural crops easier.
II.3 Growing Importance of Allied Activities The allied sector has steadily gained importance in the last decade led by strong growth in animal husbandry and fish production (Chart 3a). Indian livestock sector attained a record growth of 6.6 per cent during the last decade (2010-19) with India emerging as a major producer of milk, egg and meat in the world (GoI, 2019) (Chart 3b). With operational land holding size declining gradually, livestock is emerging as an important source of stable livelihood for not only the small and marginal farmers but also the landless labourers (Ali, 2007). II.4 Changing Dynamics of Agriculture Trade As India has emerged as a leading producer of various agricultural commodities in the world (Chart 4), its share in global trade of agricultural and allied sector products has doubled from 1.1 per cent in 2000 to 2.2 per cent in 2018 (GoI, 2020). The agriculture and allied sector contributed to 14.2 per cent of the total exports from India in 2020-21, it comprises of variety of commodities, both in raw and processed forms ranging from cereals, horticultural crops, sugar, livestock and marine products. Cereals have the highest share (22.3 per cent) in India’s farm export basket mainly driven by the high demand for Indian rice — both basmati and non-basmati — in the world market. The share of animal husbandry in India’s farm exports has almost doubled from 10.4 per cent in 2000 to 20.2 per cent in 2020 mainly driven by the export of buffalo meat. The shares of marine and horticulture products have remained almost stable at around 18 per cent, each, over the last two decades (Chart 5a). On the other hand, the export share of oilseeds and tobacco and beverages have come down significantly over the years. 
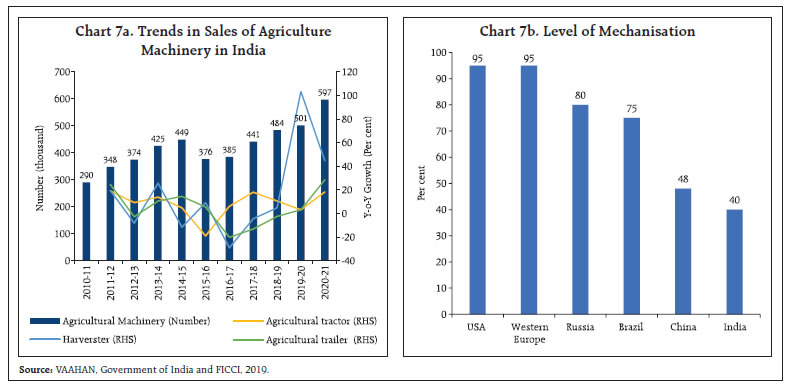
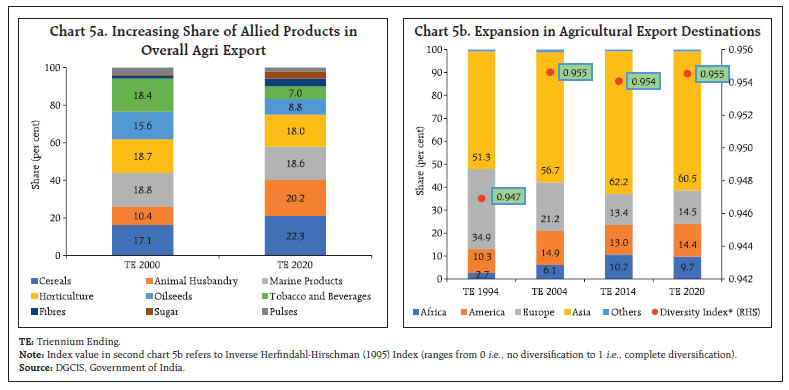 Destination-wise, the Asian and the Middle Eastern countries remain the major buyers of Indian farm exports partly reflecting the impact of India’s Act-East Policy since 2014 (Chart 5b) [Chakraborty and Chakraborty, 2018]. On the other hand, access of Indian farm products into the markets of the US and EU has remained a challenge due to their high sanitary and phytosanitary (SPS) norms resulting in high refusal or rejection rates for several commodity groups, especially for fruits and vegetables (Goyal et al.., 2017; Arathi et al.., 2012; and Kumar, 2016). III. Key Growth Enablers III. 1 Productivity Growth Foodgrains productivity has grown at a very rapid pace in India mainly driven by rice and wheat. Several studies have shown that Indian agriculture has made substantial gains in productivity with the introduction of high-yielding varieties, investment in public research and fertiliser usage (Rosegrant and Evenson, 1992; Dholakia and Dholakia, 1993; Evenson et al.., 1999, Fan et al.., 1999, Chand et al.., 2012). In comparison to cereals, the productivity growth in case of pulses, oilseeds, nutri-cereals and horticultural crops remained sluggish (Chart 6a). International comparison, however, reveals that crop productivity in India is much lower than many of the emerging market economies (EMEs) (Chart 6b). Crop yields in India have been only about 30 to 60 per cent of those achieved in the developed countries (FICCI, 2017). III. 2 Farm Mechanisation Farm mechanisation has the potential to enhance agricultural productivity by 30 per cent and reduce the input cost by 20 per cent (NABARD, 2018). Mechanised farming also reduces the time required to complete the farm operations and softens the drudgery innately associated with agriculture labour. The extent of farm mechanisation in India has increased over the years and as per different estimates, the current level of farm mechanisation in India is 40-45 per cent (FICCI and PwC, 2019; Tiwari et al.., 2019). On the flipside, although the density of tractors has increased substantially over the years, the market for other farm equipments including power tiller, rotovator and transplanter is still limited and much unorganised (15 per cent of the farm equipment market) (Chart 7a) (FICCI, 2017). International comparison reveals that the level of farm mechanisation in India is much lower compared to other advanced economies and the BRICs countries (Chart 7b). The small and scattered land holdings reduce scale advantages and thus act as a major hurdle in further expansion of farm mechanisation in India. 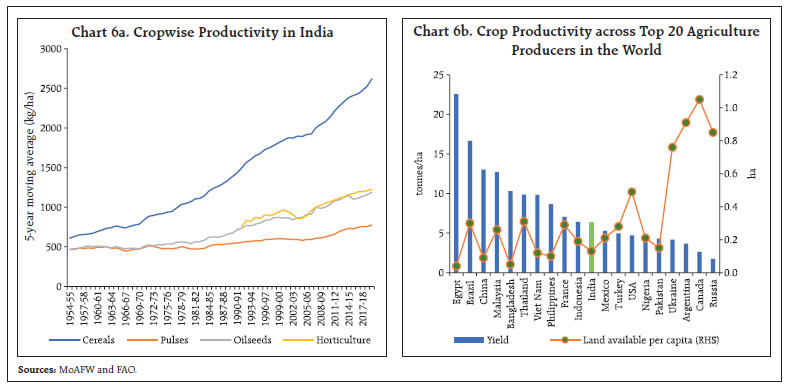
 III.3 Growing Irrigation Coverage Irrigation coverage in India has steadily increased over the years benefitting Indian agriculture in terms of higher productivity and lower vulnerability to extreme weather shocks, like drought. As per the latest available data, an irrigation potential of 126.7 million hectares has been created across the country, slowly inching towards the ultimate assessed irrigation potential of 140 million hectares (CWC, 2019). The contribution of minor irrigation has increased over the years indicating increasing inclusiveness of small land holders (Chart 8a). With the inception of Pradhan Mantri Krishi Sinchai Yojana (PMKSY) during 2015-16, the use of micro irrigation (sprinkler and drip irrigation) has increased sharply ensuring water use efficiency at the farm level. Notwithstanding such steady progress, the wholly irrigated area in India is still limited to 34.4 per cent which is less than the wholly unirrigated area of 38.6 per cent (Chart 8b). IV. Challenges Ahead While Indian agriculture has performed fairly well during the last two decades in terms of record production, diversification towards high value horticulture, livestock and marine products and doubling its share in global trade in agriculture, the sector is currently saddled with issues, especially related to sustainability, nutrition, adoption of new agricultural technologies and, perhaps most importantly, income levels of the population dependent on farming which require long-term reorientation of food, agriculture, and farm policies. Some of the major challenges faced by the farm sector are highlighted in this section. IV.1 Climate Change The climatic factors continue to have a significant impact on the agricultural productivity in India. Rising temperature along with increased occurrences of extreme weather conditions have made climate change a major threat to Indian agriculture and productivity loss (RBI, 2020). Season-wise analysis shows that months pertaining to the rabi season (October to February) have recorded maximum changes in rainfall and temperature. Long-term co-movements show that the change in different climatic variables have different implications for rabi and kharif crops.  While the maximum temperature anomalies in both the seasons depict a significant negative relationship with respective yields, for minimum temperature anomalies, the correlation turned out to be negative but statistically significant in case of rabi season only (Chart 9a). Overall, the preliminary findings indicate that maximum temperature impact is more prominent during kharif season while minimum temperature anomalies impact rabi crop yields more. Apart from hampering the biological growth of the plants, climate change also results in crop damage by increasing pest and disease attacks. The increased incidence of extreme weather conditions like flood and droughts coupled with unseasonal rains also pose a serious threat to the standing crops. It has been observed that small and marginal farmers are more prone to these impacts (Praveen & Sharma, 2020). Under such scenario, climate risk mitigating policies can play an important role to save the farm income. Launched in 2015-16, the Pradhan Mantri Fasal Bima Yojana (PMFBY) — the world’s largest crop insurance scheme — covers crop damage due to a wide range of climate related risks. Additionally, there is a need for integrated and long-term climate smart policy to balance both growth and sustainability of Indian agriculture. Such a policy must focus on sensitisation and capacity building at local levels, specifically Gram Panchayats; expediting climate proofing projects under Mahatma Gandhi National Rural Employment Guarantee Scheme (MGNREGS); intensive research in the development of stress tolerant cultivators; reducing greenhouse gas emissions from agricultural production; and promoting diversification of the consumption basket towards more climate resistant pulses and coarse grains. IV.2 Agricultural Waste Management Agricultural waste management poses another major challenge as crop residue burnings in the northern states increase the air pollution levels, create health hazards and contribute to global warming. At all India level, crop residue burning touched a figure of 48.6 million tonnes during 2018 and out of this, 50 per cent was contributed by paddy alone (Chart 9b). Short gap between the kharif harvest and rabi sowing in the northern states along with difficulties faced by farmers in residue management – physical (unavailability of labour) and economical (high cost in removing) – induces the small and marginal farmers to go for in situ residue burning which leads to air pollution. There are many solutions suggested by experts including improved and effective mechanisation for in situ residue management, viz., briquetting and conversion of wastes into fuel forms, various industrial usages and recent intervention of microbial decomposing solution etc. However, sustainable solutions should consider cost effectiveness, multiple stakeholders’ involvement as well as suitability from the socio economic and environmental point of view. 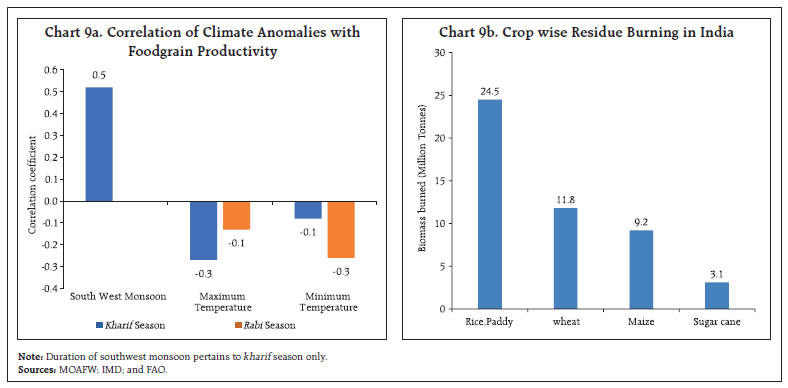 IV.3 Fragmented Landholdings Over the years, the number of farm holdings in India has increased but the area under farming has come down. As a result, the average size of holdings has decreased substantially. The average size of landholding in the country has come down to 1.08 hectares in 2015-16 from 2.28 hectares in 1970-71. Marginal and small holdings together constitute 86 per cent of total holdings in India. Such fragmentated land occupancy structure makes it almost impossible for farmers to viably invest in tube wells, drip irrigation, storage or bulk inputs. Land consolidation is thus important to drive higher efficiency. Unfortunately, the land market in India is thin and various constraints such as poor quality of land records, complex administrative procedures, restrictions on transferability of land rights, leasing, sub-leasing and rental arrangements hinder the development of land market (Bhattacharjee, 2020). There is a need for consolidation of landholdings through land market reforms to increase farm productivity in the country. IV.4 Disguised Unemployment As per Census statistics, the rural population in India stands at 833 million, constituting almost 68 per cent of the total. While the agriculture sector engages 49 per cent of the total labour force in the country, its contribution to overall GVA is only 17 per cent which shows the overdependence of Indian labour force on agriculture resulting in significant hidden or disguised unemployment in the sector and thus lower labour productivity (FAO, 2020; Joshi 2005) (Chart 10a). Studies show that many farmers [around 40 per cent of the farmers surveyed by the National Sample Survey Organisation (NSSO)] have expressed willingness to move out of farming if they find suitable alternatives (Chand, 2017; Himanshu et al.., 2016 and Chand and Srivastava, 2014). With surplus labour moving out of agriculture, the land holding size per capita will increase and would in turn lead to increasing economies of scale. However due to various socio-economic constraints like low skill and education levels, locational disadvantage of rural dwellers and limited labour absorbing capacity of non-farm sectors, the shift has been taking place at a very slow rate (Chand and Srivastava, 2014) (Chart 10b). 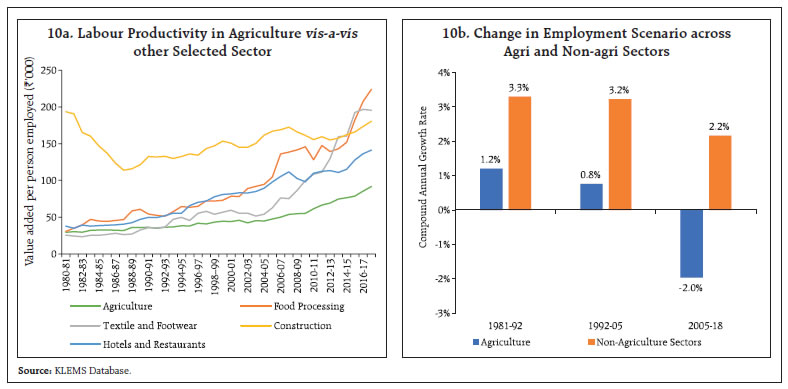 IV.5 Food Inflation and Volatility in Food Prices As agricultural production in India is still heavily dependent on rainfall and its spatial distribution, adverse climatic conditions like draught, flood and unseasonal rains tend to disrupt both aggregate supply and supply chains, imparting large volatility to food inflation trajectory. In addition, inefficiencies in the food supply chain – high and volatile retail mark ups on wholesale/farm gate prices and limited level of development of the food processing industry – impact food inflation in India (Bhoi et al.. 2019; Dhanya et.al., 2020). While the overall level of food inflation has moderated since 2014-15, backed by a series of record production of foodgrains and horticultural crops as well as lower global food prices, the volatility in food inflation continues to remain high (Chart 11a). The contribution of food, and particularly, vegetables, to volatility in headline inflation is significantly higher than non-food items, reflecting the perishable nature of the crop, short crop cycles, lack of adequate storage and poor pre- and post-harvest practices (RBI, 2020). Even non-perishables such as pulses and cereals have exhibited considerable volatility (Chart 11b). In general, prices of agricultural products in India have displayed a cobweb phenomenon i.e., alternate years of high and low prices based on supply response to price sentiments. The role of supply management in terms of minimising post-harvest losses, scaling up storage infrastructure, development of food processing industry and upgrading food safety standards assumes importance in this context. Public and private sector investment can play a critical role to build up the agricultural infrastructure required for efficient post-harvest practices. 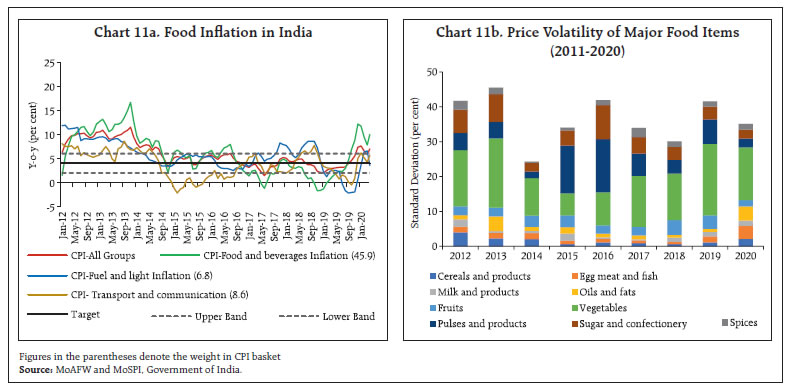 IV.5.1 Minimising Post-Harvest Losses Wastage of food products due to inefficient post-harvest practices is one of the important factors behind high food inflation in India. Wastages take place at all levels of the food value chain – starting from the level of farmers to the levels of transporters, wholesalers and retailers. The wastages result from multiple sources like crop damage, improper harvesting techniques, poor packaging, lack of storage and processing facilities, etc. Post-harvest losses are significantly higher for perishables like fruits and vegetables compared to non-perishable food items. For instance, a study by the ICAR-Central Institute of Post-Harvest Engineering and Technology estimates post-harvest wastages in non-perishable crops such as cereals, pulses and oilseeds in the range of 4.6-9.9 per cent; in perishables such as fruits and vegetables in the range of 4.6-15.9 per cent; meat in the range of 2.7 -6.7 per cent; and fish in the range of 5.2-10.5 per cent (ICAR- CIPHET, 2015). Agricultural economists have recognised that there is tremendous potential to increase the availability of agricultural produce, particularly the horticultural crops like fruits and vegetables, by reducing wastages through buildup of cold storages, warehousing, packaging and cold transport chain infrastructure. In addition, improvement in post-harvest processing can also reduce post-harvest losses and increase shelf life of the perishables. Reduction in post-harvest losses this way will augment food availability and reduce volatility in food prices which will be beneficial for both the consumers and the farmers. IV.5.2 Scaling up Storage Infrastructure The current availability of cold storage facility in India is highly skewed with nearly 70 per cent of the country’s total capacity limited to four states -Uttar Pradesh, West Bengal, Punjab and Gujarat whereas states like Maharashtra and Karnataka with large export potential do not have adequate facilities (Chart 12). While most (68 per cent) of the cold storages in India are utilised for storing potatoes, only 30 per cent are used for multi commodity storage resulting in poor utilisation of the capacity (Chakraborty, 2020). Moreover, availability of cold storage capacity alone has limited benefit unless it is integrated with development of entire cold chain involving various stages from pre-cooling, pack-houses, refrigerated transport to refrigerated marketing display till it reaches the end-consumer. While the overall cold storage capacity has shown some catch up, the availability of allied infrastructure lies way below the requirement (Table 1). Erratic power supply, high initial capital requirement, inadequate farm-gate and mobile infrastructure, limited availability of skilled manpower, lack of standard protocols and inefficient handling of perishables are some of the major hinderances in cold chain development in India at present (Yes Bank, 2018). 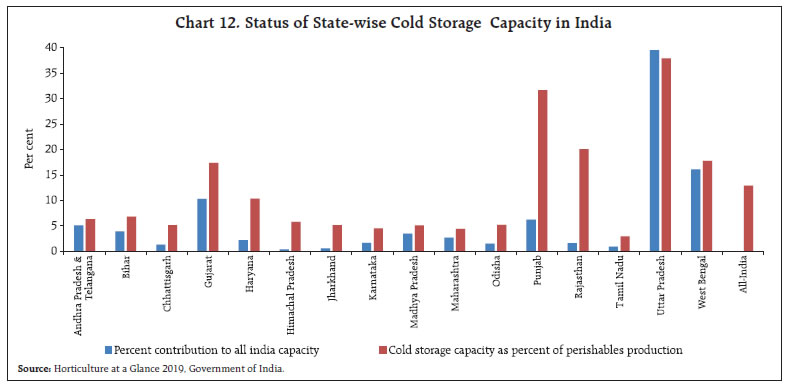 IV.5.3 Developing Food Processing Industry Food processing is a sunrise industry and the demand for processed food in India is likely to increase steadily with rapid urbanisation, rising per capita income and more women joining the workforce. Despite having huge growth potential, the food processing industry in India is currently at a nascent stage – accounting for less than 10 per cent of the total food produced in the country (Chart 13a). The figure is much lower compared to other advanced and emerging market economies. For instance, even within the emerging market economies, overall processing of agricultural produce contributes 30 per cent in Thailand; 70 per cent in Brazil; 78 per cent in Philippines; and 80 per cent in Malaysia (Dhanya et al.., 2020). Another noteworthy aspect is that food processing industry in India is currently domestically oriented – with only about 12 per cent of the processed food output being exported. India can move up in the global agricultural value chain by increasing its share of processed food exports. | Table 1. Cold Supply Chain Infrastructure Gaps in India (2015 NCCD report) | | Type of Infrastructure | All India requirement (1) | All India created (2) | Gap (1-2) | | Pack-house (units) | 70,080 | 249 | 69,831 | | Cold storage (million tonnes) | 35.1 | 36.7* | - | | Reefer vehicles (units) | 61,826 | 9,000 | 52,826 | | Ripening Chamber (units) | 9,131 | 812 | 8,319 | *: value is as on March 2019.
Source: NCCD (2015): All India Cold-chain Infrastructure Capacity – Assessment of Status and Gap. |
IV.5.4 Upgrading Food Quality and Safety Standards Asian and the Middle Eastern countries remain the major destinations for Indian agriculture exports, whereas entry into the markets of the US and EU has remained a challenge due to their high sanitary and phytosanitary (SPS) norms resulting in high refusal or rejection rates for Indian products (Chart 13b). The shares of refusals have remained significantly high for spice and rice-based products (37 and 23 per cent, respectively). The refusals are made on the ground of either adulteration or misbranding. Promoting good agriculture practices, backward integration with the production and primary processing activities, proper packaging and certification can reduce border rejections, increase compliance with SPS norms and foster export penetration in high income countries. As phytosanitary standards keep changing over time and vary across importer countries, a mechanism can be devised to raise awareness among potential exporters on the changing standards which will help them get the phytosanitary certificates. IV. 5. 5 Higher Public Investments Capital formation holds the key to agricultural growth and development. Capital formation in Indian agriculture as a per cent of agriculture GVA, however, has moderated in the recent period (Chart 14a). The share of public sector is much lower than private sector in capital formation in agriculture. While public investment in agriculture primarily constitutes infrastructure development, irrigation, research and extension services, private investment - dominated by households - is made either for augmenting productivity of natural resources or for supplementing income sources of farmers from allied activities (Golait and Lokare, 2008). Public investment largely hovered around 1.7- 3.5 per cent of agriculture GVA during the last two decades. Within public investment, the contribution of state governments continues to be significantly higher than the central government, with investment in minor and major irrigation projects constituting the largest share (80 per cent). The other major heads of state government investment include food storage and warehousing, soil and water conservation, co-operatives, crop husbandry, allied sector, etc (Chart 14b). Globally, India lags behind the major agriculture producer countries in terms of gross fixed capital formation in agriculture (FAO, 2020). V. Empirical Analysis and Results While most of the existing literature enumerates cost-push (rural wages, cost of production), demand -pull (changing consumption pattern), global (international food and fuel prices) and policy related (monetary and fiscal expansion, MSP, procurements) factors as key drivers of food inflation and volatility in India (Bhattacharya et al.., 2017; Shekar et al.., 2017; Ahmed and Singla, 2014; Kornher and Kalkuhl, 2013), we have made an attempt to empirically assess the role of various supply side variables such as investment, storage infrastructure, food processing capabilities, monsoon performance, rural wages and gross cropped area (GCA) in influencing the average retail inflation in India and the volatility in food prices with particular focus on perishable food items (fruits and vegetables). The study includes data for 16 key agricultural states2 for the period covering 2007-08 to 2018-19 which includes years of both high average inflation (2007-2013) and subdued average inflation (2014- 2018). We have considered four models with (i) average retail food inflation; (ii) volatility in food inflation; (iii) average perishable goods inflation; and (iv) volatility in perishable goods inflation as the dependent variable, respectively. Average retail inflation (annual average of monthly y-o-y changes) and volatility (standard deviation of monthly inflation) have been measured using Consumer Price Index-Combined (CPI-C). The explanatory variables considered in the analysis are – public investment, cold storage capacity, food processing GVA, performance of southwest monsoon, gross cropped area and rural wages. All the explanatory variables are taken in annual growth terms except monsoon for which a dummy variable having a value of 1 is used for normal monsoon years and 0 is used otherwise. It is expected that higher growth in supply side variables such as public investments, cold storage capacity, food processing GVA, GCA as well as normal monsoon will have a negative influence on average food inflation as well as its volatility while faster growth in rural wages is expected to give a cost push increase in inflation. The summary statistics of the key variables are provided in Annex Table 1. The results of the pooled OLS3 estimation are furnished in Table 2. The results of the empirical exercise are broadly in line with expectations with only a few exceptions. It can be observed that higher growth in public investment (Model 2,3,4), cold storage capacity (Model 2,3,4), food processing output (Model 3,4), gross cropped area (Model 1,2,3,4) and normal monsoon (Model 1,2,3) have a significant negative impact on average food inflation and its volatility in India. On the other hand, a faster wage growth tends to push up inflationary pressure (Model 1,2,3). | Table 2: Supply Side Determinants of Food Inflation and Volatility in Food Prices in India | | | Dependent Variables | | Model 1 | Model 2 | Model 3 | Model 4 | | Average food Inflation | Volatility in food inflation | Average inflation in perishables | Volatility in perishables inflation | | Constant | 3.32*** | 2.49*** | 2.78*** | 12.32*** | | Public investment | 0.01*** | -0.004*** | -0.01*** | -0.02*** | | Cold Storage capacity | 0.03*** | -0.001** | -0.03*** | -0.01** | | Food Processing GVA | - | - | -0.03*** | -0.005*** | | Gross cropped area | -0.01*** | -0.004*** | -0.02*** | -0.01*** | | Monsoon_dummy | -1.14*** | -0.26*** | -0.62*** | 0.10 | | Wages | 0.42*** | 0.04*** | 0.56*** | -0.001 | | Adjusted R-square | 0.38 | 0.11 | 0.22 | 0.05 | | F-statistics | 376.02 | 80.65 | 147.29 | 25.86 | | Prob(F-statistics) | 0.00 | 0.00 | 0.00 | 0.00 | VI. Conclusion and Way Forward Indian agriculture scaled new heights with record production of various foodgrains, commercial and horticultural crops, exhibiting resilience and ensuring food security during the COVID period. The sector, however, confronted various challenges, mitigation of which requires a holistic policy approach. For instance, crop productivity in India is much lower than other advanced and emerging market economies due to various factors, viz., fragmented landholdings, lower farm mechanisation and lower public and private investment in agriculture. Second, the current over-production of crops like rice, wheat and sugarcane, has led to rapid depletion of ground water table, soil-degradation and massive air pollution raising questions about environmental sustainability of current agricultural practices in India. Third, despite surplus production in many of the commodities, food inflation and volatility in prices continue to remain high causing inconvenience to consumers and low and fluctuating income for farmers. Empirical analysis carried out in this paper reveals that supply side hindrances like low public investments, inadequate cold storage capacity, and nascent food processing industry are partly responsible for volatility in food prices in India. Addressing these challenges would require a second green revolution focussed on the agriculture-water- energy nexus, making agriculture more climate resistant and environmentally sustainable. The use of biotechnology and breeding will be important in developing eco-friendly, disease-resistant, climate-resilient, more nutritious and diversified crop varieties. Wider use of digital technology and extension services would be helpful in information sharing and generating awareness among the farmers. Better Post-harvest loss-management and a revamp of co-operative movement through formation of Farmer Producer Organisations (FPOs) can arrest the volatility in food prices and farmers’ income and help harness the true potential of Indian agriculture. References Arathi, L. R., Kumar, S., Negi, D. S., & Singh, D. R. (2012). Prevailing standards and dimensions governing Sanitary and Phyto-Sanitary compliance in Indian black pepper supply chain. Agricultural Economics Research Review, 25(1), 69-78. Ahmed, M., & Singla, N. (2014). An analysis of major determinants of food inflation in India. Indian Journal of Economics and Development, 10(3), 275-282. Ali, J. (2007). Livestock sector development and implications for rural poverty alleviation in India. Livestock Research for Rural Development, 1-14. Bhattacharya, R. (2017). Effectiveness of monetary policy in stabilising food inflation: Evidence from advanced and emerging economies. National Institute of Public Finance and Policy. New Delhi. Bhattacharjee, S. (2020). Current Land Issues in India: Puzzles and Possible Solutions. Institute of South Asian Studies -Insights (630), National University of Singapore. Bhoi, B.B., Kundu, S., Kishore, V., & Suganthi, D. (2019, October) Supply Chain Dynamics and Food Inflation in India. RBI Bulletin, pp. 95-111. Central Water Commission (CWC). (2019). Yearbook of Water Statistics. Government of India. Chakraborty, D., & Chakraborty, A. (2018). India’s Act East Policy: Walking the Talk. MPRA Paper 88034, University Library of Munich, Germany. Chakraborty, M. (2020). Cold Storage in India: Challenges and Prospects. Agriculture and food: E-newsletter, pp. 458-460 Chand, R. (2017). Presidential Address: Doubling Farmers’ Income: Strategy and Prospects. Indian Journal of Agricultural Economics, 71(1), 1-23. Chand, R., & Parappurathu, S. (2012). Temporal and Spatial Variations in Agricultural Growth and Its Determinants. Economic and Political Weekly, 55-64. Chand, R., & Srivastava, S. K. (2014). Changes in the rural labour market and their implications for agriculture. Economic and Political Weekly, 47-54. Chand, R., Kumar, P., & Kumar, S. (2012). Total Factor Productivity and Returns to Public Investment on Agricultural Research in India. Agricultural Economics Research Review, 25(2), 181-194. Chandrasekhar, C.P. & Ghosh, J. (2021, May 31). The Centre’s niggardly allocation of free food grain. The Hindu Business Line. https://www.thehindubusinessline.com/opinion/columns/c-p-chandrasekhar/the-centres-niggardly-allocation-of-free-foodgrain/article34691962.ece Dhanya, V., Shukla, A. K., & Kumar, R. (2020, March). Food Processing Industry in India: Challenges and potential. RBI Bulletin, pp. 27-41. Dholakia, R. H., & Dholakia, B. H. (1993). Growth of Total Factor Productivity in Indian Agriculture. Indian Economic Review, 25-40. Evenson, R. E., Pray, C., & Rosegrant, M. W. (1998). Agricultural research and productivity growth in India (Vol. 109). International Food Policy Research Institute. Fan, S., Hazell, P. B., & Thorat, S. (1999). Linkages between government spending, growth, and poverty in rural India (Vol. 110). International Food Policy Research Institute. FAO (2020). World Food and Agriculture - Statistical Yearbook 2020.Rome FICCI, & PwC. (2019). Farm mechanisation: Ensuring a sustainable rise in farm productivity and income. FICCI. (2017). Mechanisation - Key to higher productivity to double farmers’ income. GoI. (2019). Agricultural Statistics at a glance. Department of Agriculture Cooperation and Farmers Welfare,Directorate of Economics and Statistics,Ministry of Agriculture and Farmers Welfare. GoI. (2020). Foreign Trade Statistics. Directorate General of Commercial Intelligence and Statistics,: http://www.dgciskol.gov.in/ Golait, R., & Lokare, S. M. (2008). Capital Adequacy in Indian Agriculture: A Reposte. Reserve Bank of India. Goyal, T. M., Mukherjee, A., & Kapoor, A. (2017). India’s exports of food products: Food safety related issues and way forward. Hazell, P. B. (1984). Sources of increased instability in Indian and US cereal production. American Journal of Agricultural Economics, 66(3), 302-311. Himanshu, H., Jha, P., & Rodgers, G. (2016). The changing village in India: Insights from longitudinal research. Oxford University Press. Jha SN, Vishwakarma RK, Ahmad T, Rai A and Dixit AK (2015). Report on assessment of quantative harvest and post-harvest losses of major crops and commodities in India. ICAR-All India Coordinated Research Project on Post-Harvest Technology, ICAR-CIPHET, P.O.-PAU, Ludhiana-141004. Kornher, L & Kalkhul, M. (2013) Food price volatility in developing countries and its determinants. Quarterly Journal of International Agriculture 52(4):277–308. Kumar, C. N. (2016). Sensitivity of India’s Agri-food Exports to the European Union: An Institutional Perspective. Institute for Social and Economic Change. National Bank for Agriculture and Rural Development (NABARD). (2018). Sectoral paper on farm mechanisation. Mumbai: Farm Sector Policy Department, NABARD Head Office. Periodic Labour Force Survey (PLFS). (2020). Annual Report. Government of India. Praveen, B., & Sharma, P. (2020). Climate change and its impact on Indian agriculture: An econometric analysis. Journal of Public Affairs, e1972. Reserve Bank of India (2020). Annual Report, 2019-20. Reserve Bank of India (2021). The Report on Currency and Finance, 2020-21. Rosegrant, M. W., & Evenson, R. E. (1992). Agricultural productivity and sources of growth in South Asia. American Journal of Agricultural Economics, 74(3), 757-761. Saxena, R., Singh, N. P., Balaji, S. J., Ahuja, U., Kumar, R., & Joshi, D. (2017). Doubling Farmers’ Income in India by 2022–23: Sources of Growth and Approaches. Agricultural Economics Research Review, 30(2), 265-277. Sekhar, C. S. C., Roy, D., & Bhatt, Y. (2017). Food inflation and food price volatility in India: Trends and determinants (Vol. 1640). Intl Food Policy Res Inst. Tiwari, P. S., Singh, K. K., Sahni, R. K., & Kumar, V. (2019). Farm mechanisation–trends and policy for its promotion in India. Indian Journal of Agricultural Sciences, 89(10), 1555-1562. United States Food and Drug Association. (various years). Import Refusal Report.
| Annexure Table 1. Summary statistics | | Growth in Variables | Average food inflation | Volatility in food inflation | Average inflation in perishables | Volatility in perishables inflation | Public investment | Cold storage capacity | Food processing GVA | Gross cropped area | Monsoon deviation from normal | Rural wages | | States | Mean | Stan dard Devia tion | Mean | Stan dard Devia tion | Mean | Stan dard Devia tion | Mean | Stan dard Devia tion | Mean | Stan dard Devia tion | Mean | Stan dard Devia tion | Mean | Stan dard Devia tion | Mean | Stan dard Devia tion | Mean | Stan dard Devia tion | Mean | Stan dard Devia tion | | Andhra Pradesh (Including Telangana) | 13.2 | 3.4 | 3.2 | 1.4 | 8.4 | 6.9 | 8.7 | 9.0 | 4.9 | 28.6 | 8.7 | 6.4 | 13.8 | 41.9 | -3.0 | 14.0 | -1.9 | 17.0 | 13.4 | 6.7 | | Assam | 10.3 | 2.6 | 2.3 | 1.2 | 7.0 | 3.9 | 8.4 | 12.1 | 27.3 | 65.6 | 6.8 | 4.8 | 10.8 | 39.8 | 0.6 | 1.8 | -11.1 | 11.5 | 11.4 | 6.8 | | Chhattisgargh | 14.1 | 3.3 | 2.6 | 0.7 | 7.6 | 4.5 | 7.0 | 11.6 | 2.0 | 31.1 | 2.7 | 3.3 | 13.0 | 35.8 | -0.3 | 2.8 | -14.3 | 21.4 | 12.4 | 7.9 | | Gujarat | 12.3 | 4.8 | 3.6 | 1.6 | 7.4 | 5.6 | 7.5 | 10.1 | 7.1 | 35.6 | 11.6 | 4.6 | 17.8 | 51.1 | 0.8 | 6.1 | 10.5 | 33.7 | 10.2 | 6.9 | | Himachal Pradesh | 11.9 | 2.8 | 2.4 | 0.8 | 7.0 | 4.2 | 7.2 | 6.8 | 12.1 | 46.7 | 29.3 | 46.5 | 16.9 | 44.6 | 0.0 | 2.0 | -11.2 | 17.2 | 9.2 | 5.6 | | Haryana | 11.2 | 2.7 | 2.7 | 1.6 | 7.7 | 4.9 | 7.8 | 9.8 | -120.4 | 448.2 | 7.9 | 4.8 | 25.8 | 56.2 | 0.7 | 1.5 | -17.5 | 28.1 | 11.9 | 9.2 | | J&K | 11.3 | 3.6 | 2.5 | 1.1 | 8.4 | 5.6 | 8.9 | 6.4 | 2.2 | 17.0 | 4.5 | 2.8 | 6.4 | 27.9 | -0.2 | 3.6 | 1.4 | 15.0 | 14.2 | 7.8 | | Karnataka | 9.4 | 3.5 | 3.5 | 1.4 | 9.3 | 5.1 | 9.6 | 9.9 | 7.7 | 24.8 | 4.0 | 4.7 | 5.4 | 17.9 | -0.4 | 2.6 | -2.0 | 21.5 | 11.8 | 8.4 | | Madhya Pradesh | 12.0 | 3.0 | 2.7 | 1.0 | 7.5 | 5.4 | 8.8 | 9.7 | 9.7 | 28.4 | 5.2 | 3.3 | 10.0 | 34.5 | 1.5 | 2.3 | -5.1 | 20.4 | 12.3 | 4.9 | | Maharashtra | 9.1 | 2.6 | 2.1 | 1.1 | 7.8 | 4.6 | 8.8 | 8.0 | 2.6 | 21.3 | 6.0 | 4.1 | 9.4 | 13.3 | -0.8 | 4.5 | 0.3 | 17.7 | 11.8 | 7.6 | | Odisha | 13.2 | 3.5 | 2.4 | 0.8 | 8.3 | 3.8 | 7.4 | 8.0 | 11.9 | 17.2 | 6.6 | 11.8 | 14.8 | 45.1 | -4.7 | 11.6 | 0.9 | 12.7 | 10.7 | 5.3 | | Punjab | 13.0 | 3.6 | 2.9 | 0.9 | 7.5 | 4.5 | 6.8 | 9.7 | -0.4 | 34.9 | 6.4 | 7.2 | 9.3 | 36.9 | 0.0 | 0.4 | -15.3 | 24.4 | 10.0 | 7.9 | | Rajasthan | 14.8 | 5.1 | 3.0 | 1.3 | 7.2 | 5.6 | 7.3 | 11.6 | 0.9 | 18.5 | 6.8 | 3.3 | 21.2 | 75.4 | 1.8 | 7.4 | 8.6 | 21.8 | 11.7 | 7.1 | | Tamil Nadu | 11.9 | 4.5 | 2.8 | 1.0 | 9.0 | 5.5 | 10.7 | 10.7 | -2.1 | 17.6 | 4.2 | 3.4 | 9.7 | 14.8 | -0.4 | 8.0 | -2.5 | 15.7 | 13.7 | 9.3 | | Uttar Pradesh | 10.8 | 2.4 | 2.8 | 0.8 | 7.7 | 5.1 | 8.5 | 10.7 | 11.8 | 40.7 | 4.3 | 4.1 | 10.1 | 24.2 | 1.2 | 2.1 | -22.4 | 16.8 | 12.2 | 5.9 | | West Bengal | 14.3 | 4.1 | 2.5 | 0.8 | 7.6 | 4.1 | 9.0 | 11.6 | 21.3 | 31.7 | 0.5 | 0.4 | 10.2 | 28.0 | 0.7 | 3.5 | -8.5 | 17.2 | 12.0 | 7.0 | | Note: Means are in per cent growth. |
|