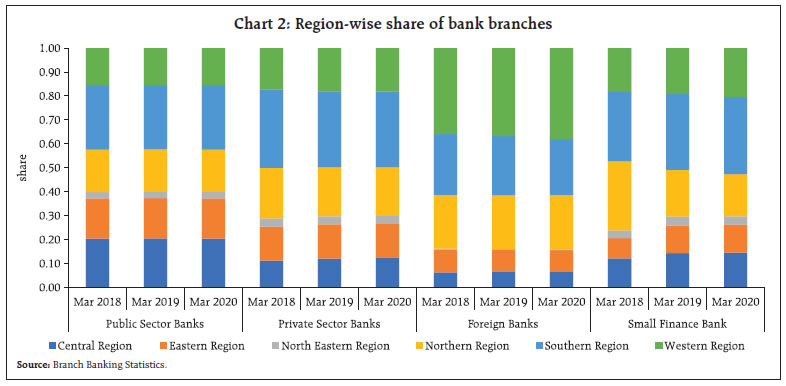
Small Finance Banks (SFBs) are in a nascent stage of evolution. These are banking institutions aimed at developing a viable business model to cater to the financial needs of the marginalised sections of the society. The study contains an initial assessment of the performance of SFBs for early policy inputs. The analysis reveals factors like efficiency, leverage, liquidity and banking business to be statistically significant determinants of the performance of these institutions. Introduction “Poverty anywhere is a threat to prosperity everywhere.”1 The statement succinctly sums the ills of skewed growth as a global challenge. While an inclusive and sustainable development has always been an objective of governance in India, this objective has received a renewed impetus in recent times through the policy of financial inclusion. In a major step to connect to the last person, a structure to promote differentiated banks to cater to niche segments was announced in the Union Budget for 2014-15. These niche segments referred to farmers, low income households, small business, unorganised sector, etc. As part of this structure, the Reserve Bank of India (RBI) released the guidelines for licensing of Small Finance Banks (SFBs) in the private sector. The primary objective of creating SFBs was to improve financial inclusion through an effective deployment of deposits and extension of credit facilities to micro, small and unorganised entities at low processing costs (RBI, 2014). The guidelines of SFBs were drafted to promote inclusive growth taking care of the lacunae in some of the earlier experiments involving differentiated banks, such as narrow capital base, restrictive geographical jurisdiction, lack of diversification in source of funds and the concentration risk (Gandhi, 2015). The “small” in SFBs refer to the importance given to the objective of serving the section that is excluded and not the size of bank. At least 50 per cent of their loan portfolio should comprise loans of upto ₹25 lakh. Small or community banking is a globally prevalent model both in advanced and emerging economies alike to serve the Small and Medium Enterprises (SMEs). There are both pros and cons associated with small banks compared to the conventional banking system. On one hand, bigger banks have better spread of Automated Teller Machines (ATMs) and branches, the smaller banks are known to be more flexible in providing personalised service to smaller clients (Berger and Udell, 1995). While larger banks tend to allocate higher proportion of assets to bigger entrepreneurs, local banks serve neighbourhood community (Berger et al., 1995). Large banks generally rely more on hard information like creditworthiness of borrowers, collateral and audited statements for lending. Small banks rely on soft information based on feedback from local community. In India, an important reason for establishing SFBs has been finance to MSMEs (Micro, Small and Medium Enterprises). The share of MSMEs in Gross Value Added is more than 30 per cent, generating employment for more than 11 crore persons during 2015-16 (Government of India, 2020). MSMEs’ opportunities to invest in profitable projects may be curtailed due to non-availability of external finance. Shocks to the banking system can also have significant impact on credit disbursement to MSMEs as it has happened on account of rising NPAs (Non-Performing Assets) in the past. Hence, dedicated intermediaries that cater to MSMEs in a focused way may be necessary in the Indian context (Hakenes et al., 2015; Hasan et al., 2017). The article attempts to answer the following questions with regard to the operation of SFBs: a. how has been the operational performance of SFBs so far? b. What drives the profitability of SFBs? We analyse some stylised facts and provide empirical evidence on the role of proximate determinants of the performance of SFBs. Section 2 of the article elucidates the policy framework for SFBs’ operationalisation. Discussion of the data and variables is undertaken in Section 3 followed by description of analytical strategy in Section 4. The presentation and discussion of findings is carried out in Section 5 with summary of analysis in Section 6. 2. SFBs: The Policy Approach The Reserve Bank released guidelines for licensing of SFBs during 2014-15, taking cues from Government of India’s announcement in the Union Budget 2014-15 for the need of a structure to promote differentiated banks to cater to niche requirements (RBI, 2014). This was aimed at furthering the financial inclusion objective by, (i) provision of savings vehicles primarily to unserved and underserved sections of the population, and (ii) supply of credit to small business units; small and marginal farmers; micro and small industries; and other unorganized sector entities, through high technology-low cost operations. SFBs are registered as public limited companies under the Companies Act, 2013 and governed by Banking Regulations Act, 1949; RBI Act, 1934 and other relevant Statutes and Directives from time to time. Since then, draft guidelines for “on tap” licensing of SFBs have been formulated by the Reserve Bank (RBI, 2019). Resident individuals/ professionals (Indian citizens) having at least 10 years of experience in banking and finance at a senior level are eligible as promoters to set up SFBs. Promoters / Promoter Groups should be “fit and proper” that shall be examined, based on their past record of sound credentials, integrity, financial soundness and successful track record of professional experience. The minimum paid-up capital requirement for setting up SFB is ₹200 crore with capital adequacy ratio of 15 per cent of risk weighted assets on continuous basis. Existing Non-Banking Finance Companies (NBFCs), Micro Finance Institutions (MFIs), and Local Area Banks (LABs) are also eligible for conversion to SFBs subject to the guidelines. Earlier, as on 27 September 2018, the Reserve Bank announced a scheme for voluntary transition of eligible Urban Cooperative Banks (UCBs) to SFBs in line with the recommendations of the High-Powered Committee on UCBs chaired by Shri R. Gandhi. As per the scheme, UCBs desirous of transition to SFBs will be required to ensure compliance with these “on tap” licensing guidelines of SFBs. The minimum net worth of such SFBs shall be ₹100 crore from the date of commencement of business. Moreover, they will have to increase their minimum net worth to ₹200 crore within five years from the date of commencement of business. 3. Data In order to assess the performance of SFBs, quarterly data of SFBs from March 2017 to March 2020 is compiled based on supervisory returns. A total of ten SFBs have been operating in India at the time of the study, although they started operations at different time points. Accordingly, we construct an unbalanced panel for the analysis. The description of all the variables is illustrated in Table 1 discussed as below. For dependent variables, taking a cue from literature we have included three prominent indicators for bank performance, viz., profit margin, ROE (Return on equity) and ROA (Return on assets) (Dietrich and Wanzenried, 2014; Petria et al., 2015; Berger and Bouwman, 2013). Turning to explanatory variables, logarithm of assets normalised by GDP deflator is included to account for size variation. | Table 1: Definition of variables | | Variables | Description | | Dependent | | Profit Margin | Net income over average sales (per cent) | | ROE | Net income over average equity (per cent) | | ROA | Net income over average assets (per cent) | | Independent | | log(Assets) | Log of assets | | Efficiency | Per cent of operating expenses to operating income | | Leverage | Per cent of paid-up share capital to assets | | Liquidity | (Liquid funds*100)/assets. | | | Here, Liquid funds = Cash Funds + Due from Banks/ FIs/CCPs + Approved securities | | Stressed_ Advances | Per cent of (GNPAs + Restructured standard advances) to Gross advances | | Banking_Business | (Credit + Deposit)*100/Assets | | COF | Cost of funds | | LLP | Loan loss provisions i.e. per cent of Provisions held for NPAs to Gross advances | | Effective_Tax | Per cent of provision for income taxes to Profit Before Tax | | TE | Time dummies to segregate the time effects | Moreover, cost to income ratio is included to account for efficiency differences across banks. Leverage has been considered reflecting financial soundness and stability. Similarly, factors like liquidity, stressed advances and banking business are chosen to assess their possible impact on SFB performance. Cost of funds (COF) is a crucial variable determining profitability (Rakhe, 2010). It portrays the expenses involved in raising funds through various intermediation activities. Loan loss provisions (LLP) is another pertinent variable that may have bearing on bank performance (Dietrich and Wanzenried, 2014). It reflects the quality of credit and its allocation for a bank. A high LLP implies low credit quality that may have a negative effect on bank profitability. Effective tax rate is included to understand its impact on profitability. On one hand, high tax rate can lead to lower post-tax profit (Demirguc-Kunt and Huizinga, 1999). Contrarily, banks may indulge in shifting taxation burden to their customers (Albertazzi and Gambacorta, 2009). Literature provides ample support for business cycles or external factors that can also have a bearing in determining bank performance like Petria et al. (2015), Berger and Bouwman (2013) and Rakhe (2010). In this regard, we have included in our analysis time dummies to capture all time varying factors affecting all SFBs in the sample. 4. Methodology Due to the longitudinal nature of our information set, the bank level characteristics may not be independent over time rendering the ordinary least square technique inappropriate providing biased estimates. Additionally, the profitability and other policy decisions of SFBs may extend over single period leading to persistence. So, a dynamic framework is employed wherein profitability of previous period is also taken as an independent variable. In dynamic panel models with large number of cross sections and small time period, Generalised Method of Moments (GMM) estimator are known to provide efficient estimates (Arellano and Bond, 1991; Arellano and Bover, 1995). The GMM is formulated as below.  In Equation (1), yi,t depicts the dependent variable of ith SFB at tth period. The lagged endogenous variable is represented by yi,t-1. The matrix Xi,t depicts the values of explanatory variables.ŋi is the unobserved SFB effect and ɛi,t being the usual idiosyncratic shocks. All specifications are estimated using GMM first-difference specification so that SFB specific effects are removed. So, Equation (1) can be re-formulated as follows. Under the assumptions of: (a) error term is not serially correlated, (b) explanatory variables are not correlated with future realizations of error term, the GMM dynamic panel estimator employs the following moment conditions. The application of instruments in GMM difference estimation enables to manage not only the issue of endogeneity but also the correlation of (yi,t-1 - yi,t-2) with (ɛi,t - ɛi,t-1). Additionally, difference GMM also circumvents the issue of number of instruments, which may be otherwise large in case of system GMM leading Sargan test to be weak. The detailed specification of Equation (1) is as follows. As it is observed, Dep is our dependent variable that is taken as Profit Margin, ROE and ROA separately with common set of independent variables as illustrated in the right side of Equation (2). TE denotes the time dummies capturing all time varying factors affecting the SFBs in the sample. 5. Analysis and Results An overview of spatial and trend evaluation of SFBs is discussed in the next sub-section followed by presentation of findings based on regression analysis of determinants of profitability. 5.1 Stylised Facts A comparison of major ratios and rates of SFBs with other bank groups is presented in Table 2 (Annex). High credit deposit (CD) ratio is observed for SFBs compared to other bank groups, implying a high conversion rate of available funds into lending activity. An important objective of SFBs was to provide credit to priority sector. This is indeed found to be in place with share of priority sector advances of SFBs considerably higher vis-a-vis other traditional banking groups2. Both the growth rate of deposits and credit of SFBs is generally high also due to small base. Profitability and assets quality figures for SFBs are also better in contrast to other bank groups. On the contrary, profitability measures are in negative zone for public sector bank group. Chart 1 on population group-wise distribution of bank branches shows that out of total number of bank branches, semi-urban constitutes the highest share of branches at around 39 per cent in March 2020 for SFBs3 (Saraf and Chavan, 2021). Rural and semi-urban regions that draws special attention of policy makers for financial inclusion drives, together comprise a share of 57 per cent in March 2020. Although, this share is lower as compared to 61 per cent for PSBs, which have a better coverage in rural sections. The share of branches across population groups has been relatively similar since March 2018. As per Chart 2, it is seen that around 30 per cent of the total branches of SFBs are situated in southern India followed by around 20 per cent each in Northern and Western regions. It conveys that SFBs have more prominence in southern regions, which may not be surprising due to the fact that many SFBs are active in southern India. 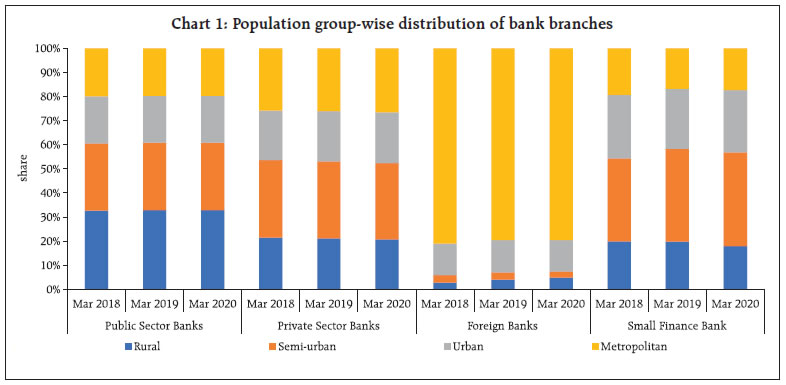
 Next, a comparison of balance sheet items across SFBs is performed. Largest bank in terms of asset size is SFB14 at ₹42,064 crore followed by SFB3 at ₹19,315 crore in March 2020. SFB1 alone comprises a share of around 32 per cent compared to all SFBs in terms of total assets. At the other end, SFB7, SFB2, SFB8 are the smallest SFBs with total assets size less than ₹6,000 crore. The share of advances forms the predominant portion of asset portfolio of SFBs’ assets followed by investments (Chart 3).
Turning to the liability side of SFBs, SFB9 occupies the highest share of capital at 36 per cent followed by SFB3 at 22 per cent of the gross capital of SFBs in March 2020. While, on the deposit side, SFB1 occupies the largest segment at 32 per cent followed by SFB3 and SFB9 at 13 per cent each for the same period (Chart 4). 5.2 Empirical Results Table 3 (Annex) tabulates the descriptive statistics of major variables. All the profitability ratios viz., Profit Margin, ROE and ROA display improvements as per the median measure of central tendency. But, the mean of profitability ratios has sharply dipped in September 2018 with an inflated standard deviation.5 Moreover, only five SFBs were operational in March 2017 that increased to 10 in September 2018 contributing to higher dispersion. The aggregate size as measured by total assets has roughly increased both in terms of mean and median. Median efficiency has improved from 75 per cent in March 2017 to 66 per cent in March 2020. Broadly, both liquidity and banking business have enhanced both in terms of median and mean from September 2018 to March 2020 with reduced variability. Regression results can be influenced by existence of outlier observation(s), which can contaminate the overall outcome. In this respect, DFITS6 measure is widely employed to identify outliers (Welsh and Kuh, 1977). The number of observations stood at 109 for empirical investigation after application of DFITS test. Before performing the regression analysis, it is pertinent to establish the stationarity of variables. Regressions involving non-stationary variables lead to spurious outcome. In this context, panel unit root tests were performed that suggest rejection of null hypothesis of unit root (Annex Table 4). Accordingly, we have included all the variables at level. The GMM estimation result of determinants of profitability is illustrated in Table 5 (Annex). The dependent variables in case 1, 2 and 3 are profit margin, ROE and ROA respectively. Broadly, the sign of coefficient estimates and significance are analogous across all the three regressions implying robustness of the outcome. Foremost, it is observed that efficiency is wielding an inverse influence on profitability for all the three models. Higher operating cost compared to earnings is clearly having a detrimental influence on profitability indicators in case of SFBs for all the three models extending the findings of Rakhe (2010), Dietrich and Wanzenried (2014) to SFBs also. Next, the coefficient of leverage is found to be positive and statistically significant across all the model variants. The result points to the valuable contribution of reasonable level of capital on enhancing the performance of SFBs. The outcome is consistent with regards to other studies that also obtain similar findings with capital ratio (Dietrich and Wanzenried, 2014; Petria et al., 2015). The estimate of liquidity is positive and significant for profit margin and ROE. Additionally, banking business is yielding beneficial affect for all the measures of profitability. Last but not the least, Wald statistic for all models is highly significant indicating significance of the covariates. Serial correlation of both first and second order is insignificant for all the cases indicating absence of residual correlation. The Sargan statistics of over identifying restrictions is tabulated that establishes validity of instruments. Overall, the results reflect relative importance of banks’ intrinsic factors like efficiency, leverage, liquidity and banking business for profitable operations. 6. Conclusion The SFBs have been provided license with the objective to serve the under-served and marginalised sections of the society. Over time, the Reserve Bank has been updating the guidelines for greater effectiveness of SFBs. The SFBs have been in operation for over three years at the time of this study. In this regard, the study attempts to assess the operating performance of SFBs. Preliminary analysis reveals SFBs to be leading in serving the priority sector. Most of the SFBs are displaying healthy performance with further improvements in recent quarters. The empirical results show that micro factors like efficiency, leverage, liquidity and banking business are important in determining SFBs’ profitability during this early period of operations. The outcome could be because SFBs are established with the objective of serving niche segment of under-privileged population instead of a purely profit-making intermediary. Due to limited time span available, the outcome of the analysis may be considered as indicative at this stage and needs to be substantiated with greater data, going forward. References Albertazzi, U., and Gambacorta, L. (2009), “Bank profitability and the business cycle”, Journal of Financial Stability, 5(4), 393–409. Arellano, M., and Bond, S. (1991), “Some tests of specification for panel data: Monte Carlo evidence and an application to employment equations”, The Review of Economic Studies, 58(2), 277-297. Arellano, M., and Bover, O. (1995), “Another look at the instrumental variable estimation of error-components models”, Journal of Econometrics, 68(1), 29-51. Berger, A. N., and Bouwman, C. H. (2013), “How does capital affect bank performance during financial crises?” Journal of Financial Economics, 109(1), 146- 176. Berger, A. N., Kashyap, A. K., Scalise, J. M., Gertler, M., and Friedman, B. M. (1995), “The transformation of the US banking industry: What a long, strange trip it’s been”, Brookings papers on economic activity, 1995(2), 55-218. 2017-18. Berger, A. N., and Udell, G. F. (1995), “Relationship lending and lines of credit in small firm finance”, Journal of Business, 351-381. Demirguc-Kunt, A., and Huizinga, H. (1999), “Determinants of commercial bank interest margins and profitability: Some international evidence”, World Bank Economic Review, 13(2), 379–408. Dietrich, A., and Wanzenried, G. (2014), “The determinants of commercial banking profitability in low-, middle-, and high-income countries”, The Quarterly Review of Economics and Finance, 54(3), 337-354. Gandhi, R. (2015), “Disruptive Innovation and Inclusive Growth – Some Random Thoughts”, Speech delivered at FIBAC 2015, Mumbai, August 25, 2015. Government of India (2020), “Annual Report 2019-20”, Ministry of Micro, Small and Medium Enterprises. Hakenes, H., Hasan, I., Molyneux, P., and Xie, R. (2015). Small banks and local economic development. Review of Finance, 19(2), 653-683. Hasan, I., Jackowicz, K., Kowalewski, O., and Kozlowski, L. (2017). Do local banking market structures matter for SME financing and performance? New evidence from an emerging economy. Journal of Banking and Finance, 79, 142-158. Petria, N., Capraru, B., and Ihnatov, I. (2015), “Determinants of banks’ profitability: evidence from EU 27 banking systems”, Procedia Economics and Finance, 20(15), 518-524. Rakhe, P. B. (2010), “Profitability of foreign banks vis-à-vis other bank groups in India–a panel data analysis”, Reserve Bank of India Occasional Papers, 31(2), 49-67. Reserve Bank of India (2014), “RBI releases Guidelines for Licensing of Small Finance Banks in the Private Sector”, Department of Communications (November 27, 2014), Mumbai. Reserve Bank of India (2019), Draft Guidelines for “on tap” Licensing of Small Finance Banks in the Private Sector, Reserve Bank of India (September 13, 2019). Saraf, R., Chavan, P. (2021), “Small Finance Banks: Balancing Financial Inclusion and Viability”, RBI Bulletin, January 2021, pp. 49-60. Welsch, R. E., and Kuh, E. (1977), “Linear regression diagnostics”, (No. w0173), National Bureau of Economic Research.
Annex | Table 2: Bank group-wise major indicators | | (Per cent) | | Period | Ratio | Public Sector Banks | Private Sector Banks | Foreign Banks | Small Finance Banks | | 2018-19 | CD ratio | 69.44 | 88.26 | 68.26 | 120.91 | | Demand and savings deposit to total deposit | 39.5 | 41.46 | 39.81 | 18.71 | | Deposit Growth | 2.71 | 25.1 | 17.45 | 112.95 | | Priority sector to total advances | 32.7 | 30.21 | 27.08 | 68.32 | | Advances Growth | 3.43 | 24.96 | 13.02 | 70.48 | | ROA | -0.65 | 0.63 | 1.56 | 1.59 | | ROE | -11.44 | 5.45 | 8.77 | 12.59 | | GNPA ratio | 11.59 | 5.25 | 2.99 | 1.83 | | 2019-20 | CD ratio | 68.06 | 87.16 | 62.56 | 109.81 | | Demand and savings deposit to total deposit | 39.93 | 41.36 | 42.07 | 15.35 | | Deposit Growth | 6.62 | 10.32 | 17.73 | 67.73 | | Priority sector to total advances | 31.87 | 30.92 | 27.08 | 71.79 | | Advances Growth | 4.5 | 8.95 | 7.9 | 52.33 | | ROA | -0.23 | 0.51 | 1.55 | 1.7 | | ROE | -4.16 | 3.3 | 8.76 | 15 | | GNPA ratio | 10.25 | 5.45 | 2.34 | 1.87 | | Source: Statistical tables relating to banks in India, March 2020. |
| Table 3: Descriptive Statistics | | Variable | March 2017 | September 2018 | March 2020 | | Median | Mean | Standard Deviation | Median | Mean | Standard Deviation | Median | Mean | Standard Deviation | | Profit Margin | 5.36 | 4.34 | 3.49 | 10.44 | -6.42 | 67.37 | 11.68 | 9.40 | 4.48 | | Return on Equity | 1.59 | 3.31 | 4.04 | 11.72 | -14.91 | 101.34 | 13.08 | 12.72 | 6.50 | | Return on Assets | 0.18 | 0.39 | 0.50 | 1.72 | -0.56 | 10.59 | 2.04 | 1.67 | 0.90 | | ln(Assets) | 12.35 | 12.75 | 0.64 | 12.91 | 12.98 | 0.81 | 13.42 | 13.46 | 0.84 | | Efficiency | 75.27 | 78.08 | 9.91 | 64.52 | 73.51 | 55.59 | 65.64 | 63.90 | 10.28 | | Leverage | 10.87 | 10.08 | 5.77 | 4.56 | 6.75 | 6.66 | 3.07 | 4.58 | 4.70 | | Liquidity | 34.43 | 35.51 | 7.63 | 24.44 | 24.69 | 6.02 | 27.28 | 27.42 | 3.89 | | Stressed advances | 0.53 | 1.08 | 1.44 | 2.20 | 5.45 | 10.48 | 1.72 | 1.88 | 0.88 | | Banking business | 71.09 | 78.74 | 27.32 | 104.91 | 102.36 | 14.99 | 108.94 | 111.93 | 12.22 | | COF | 1.92 | 3.50 | 2.92 | 9.21 | 9.07 | 1.48 | 8.69 | 8.56 | 0.89 | | LLP | 0.29 | 0.52 | 0.70 | 1.21 | 3.65 | 7.48 | 0.83 | 0.89 | 0.41 | | Effective tax | 45.03 | 54.52 | 26.72 | 26.69 | 11.28 | 37.39 | 24.97 | 20.53 | 10.26 | Note: All variables except ln(Assets) in per cent.
Source: Supervisory returns. |
| Table 4: Result of panel unit root tests | | Variable | Inverse Chi-Square statistic | Modified Inverse Chi-Square statistic | | Profit Margin | 53.32*** | 5.27*** | | Return on Equity | 32.7** | 2.01** | | Return on Assets | 32.12** | 1.92** | | ln(Assets) | 88.02*** | 10.75*** | | Efficiency | 63.43*** | 6.87*** | | Leverage | 28.67* | 1.37* | | Liquidity | 67.64*** | 7.53*** | | Stressed advances | 163.94*** | 22.76*** | | Banking business | 72.6*** | 8.32*** | | COF | 469.89*** | 71.13*** | | LLP | 173.55*** | 24.28*** | | Effective tax | 167.16*** | 23.27*** | Note: Phillips-Perron unit root test including trend for unbalanced panel data has been applied. The null hypothesis being tested is that all panels contain a unit root. *, **, *** indicate significance at 10, 5 and 1 per cent level respectively.
Source: Authors’ calculations. |
| Table 5: Estimation result of SFBs performance | | Variables | Profit Margin | Return on Equity | Return on Assets | | (1) | (2) | (3) | | L1.Dep | 0.138 | -0.003 | 0.152 | | | (0.286) | (0.149) | (0.308) | | ln(Assets) | 9.492 | 20.491 | 1.764 | | | (8.54) | (12.556) | (1.672) | | Efficiency | -0.635*** | -0.602*** | -0.113*** | | | (0.124) | (0.089) | (0.019) | | Leverage | 2.14*** | 3.961*** | 0.307*** | | | (0.605) | (0.698) | (0.101) | | Liquidity | 0.631** | 0.877*** | 0.09 | | | (0.293) | (0.319) | (0.058) | | Stressed advances | 2.348 | 1.084 | 0.368 | | | (1.531) | (1.523) | (0.26) | | Banking business | 0.566*** | 0.831*** | 0.09*** | | | (0.133) | (0.155) | (0.024) | | COF | -1.268 | 1.579 | 0.109 | | | (1.496) | (0.997) | (0.201) | | LLP | -2.447 | -1.377 | -0.441 | | | (2.13) | (2.464) | (0.375) | | Effective tax | 0.003 | 0.02 | 2.3E-04 | | | (0.013) | (0.016) | (0.002) | | Model diagnostics | | | | | Wald statistic | 415.39*** | 803.98*** | 666.60*** | | AR-1 | -0.33 | 0.09 | -0.25 | | AR-2 | 0.72 | 0.47 | 0.70 | | Sargan statistics | 0.01 | 1.16 | 0.03 | All models are estimated using GMM first-difference specification. *, **, *** indicate significance at 10, 5, and 1 per cent level, respectively. The estimates of TEs are not displayed to keep the table parsimonious. L1.Dep represents first lag of dependent variable. Figures in bracket denote standard error.
Source: Authors’ calculations. |
|