The COVID-19 pandemic has impacted all sectors domestically, including NBFCs. They faced multiple challenges during the recent period which exacerbated their liquidity position. The Reserve Bank and the Government took calibrated measures to facilitate flow of funds to the sector and to restore overall financial stability. This article investigates the impact of one such scheme, namely the Targeted Long-Term Repo Operations (TLTRO), on NBFCs’ structural liquidity by employing a difference-in-difference strategy. The results suggest that NBFCs which received funds via the TLTRO witnessed an improvement in their short-term liquidity buckets compared to others. Introduction Non-banking financial companies (NBFCs) have emerged as important intermediaries in India’s financial system and play a crucial role in providing financial access to unbanked and under-banked sections of society as well as to niche sectors such as micro and small enterprises, vehicle loans and infrastructure financing. Their embrace of technology-driven business and operational models, agility and adaptability in staying ahead of the curve and innovative product offerings have not only enabled NBFCs to stay relevant in an increasingly competitive financial landscape but also facilitated their meteoric rise. In the last decade or so, the NBFC sector has exhibited tremendous growth as evidenced by the expansion in their balance sheet size from ₹10.6 lakh crore in March 2012 to ₹35.9 lakh crore in September 20201 despite hardships caused by the Infrastructure Leasing & Financial Services (IL&FS) episode, defaults by a few other NBFCs and the subsequent loss of confidence, rating downgrades and liquidity constraints. NBFCs in India are largely engaged in traditional lending activities involving maturity transformation; i.e., they often depend on several short-term sources of finance to create long-term loans for their customers. The COVID-19 pandemic, which has the global economy in a chokehold, has impacted all sectors domestically, including NBFCs. Given this background, NBFCs faced multiple challenges during the recent period – first, the COVID-19-induced lockdowns brought the activities of NBFCs to a standstill wherein their collections and disbursements dried up exacerbating their liquidity position and second, pandemic-induced sell-offs in financial markets tightened the financial conditions and heightened flight to safety. Adverse developments in the mutual fund sector in April 2020 further added to the woes of the NBFC sector due to the interlinkages between the two (Bitra et al., 2020). Funding challenges of NBFCs intensified as markets and banks pulled back due to risk aversion and uncertainty. Market instruments of NBFCs such as non-convertible debentures (NCDs) and commercial paper (CP) faced spikes in their yields during this period. As NBFCs are not privy to borrowing from the central bank, the Reserve Bank and the Government took calibrated measures to facilitate flow of funds to the sector and to restore overall financial stability. To that end, many liquidity enhancing schemes like Targeted Long-Term Repo Operations (TLTRO), Special Liquidity Scheme (SLS), Partial Credit Guarantee Scheme 2.0 (PCGS 2.0) and refinancing facility for all India financial institutions (AIFIs) were introduced (Reserve Bank of India, 2021). These measures considerably helped in alleviating the funding challenges faced by NBFCs, reduced their borrowing costs and improved market confidence. No study, however, has empirically examined the efficacy of these liquidity schemes. Against this backdrop, this article seeks to investigate how TLTRO impacted NBFCs’ structural liquidity by employing a difference-in-difference methodology, thereby contributing to the nascent literature on NBFCs in India. The rest of this article is divided into five sections. Sections II and III discuss in brief the borrowing profile of NBFCs and the TLTRO scheme, respectively. Section IV outlines the data and methodology. The results are discussed in section V and section VI concludes. II. Borrowings of NBFCs NBFCs largely fund their activities via borrowings, which constitute nearly two-thirds of their liabilities. They rely on various sources to raise funds, including issuance of market instruments like NCDs and CPs, borrowing from banks, financial institutions and inter-corporate borrowings, among others (Reserve Bank of India, 2020). Markets and banks constituted 76.7 per cent of their total borrowings in December 2020 (Jayakumar et al., 2021). In this section, an analysis of market and bank borrowings of NBFCs is undertaken to understand why liquidity measures were needed to help NBFCs get through the rough patch. II.1 Market Borrowings In the immediate aftermath of COVID-19, market instruments – both NCDs and CPs – of NBFCs saw reduced issuances as well as a spike in yields (Rituraj et al., 2020). In March and April 2020, the period immediately after the announcement of the nationwide lockdown, bond issuances by NBFCs – both amount as well as number of issuances – fell but recovered subsequently (Chart 1a and 1b). Similarly, CPs also witnessed lower issuances in the same period. The amount of CP issuances by NBFCs fell by three times during April-June 2020 as compared to April-June 2019. However, in response to the measures taken by the Reserve Bank and the Government to provide liquidity support to the non-bank lenders, the share of NBFCs in CP issuances increased sharply from September 2020 onwards (Chart 2).
The imposition of nationwide lockdown to combat COVID-19 sent jitters through the markets and it was reflected in the sentiments towards NBFCs as well. The shutting down of certain credit risk funds in April 2020 (Bitra et al., 2020) further heightened the risk aversion of market towards NBFCs2 to such an extent that even AAA rated NBFCs faced record increase in yields (Chart 3a). CPs also witnessed heavy selling by foreign investors and mutual funds during the period, which led to a spike in their spread over Treasury Bills (T-bills), particularly for private NBFCs (Chart 3b). II.2 Bank Lending to NBFCs Banks are the second-largest source of funding for NBFCs after debentures. Following the IL&FS episode, NBFCs’ reliance on bank borrowings increased compared to market borrowings and they also started changing their borrowing mix by swapping short term borrowing for longer term borrowings to better manage their asset-liability profiles. While growth in bank lending to NBFCs was on a path of deceleration, the same contracted in September 2020 after the onslaught of COVID-19 in line with a decline in lending by the dominant player – public sector banks (PSBs) (Chart 4). Combined share of market and bank borrowings of NBFCs in total borrowings declined from 80.8 per cent in March 2019 to 73.9 per cent in September 2020 (Chart 5). In short, it is evident that NBFCs faced constraints in raising funds in the aftermath of COVID-19. As alluded to earlier, several schemes were introduced to provide targeted liquidity to affected sectors on top of the injection of ample liquidity and aggressive rate cuts undertaken by the Reserve Bank. The next section discusses the subject of interest for this study, viz., the TLTRO.
III. Targeted Long-Term Repo Operations (TLTRO) The Reserve Bank added Long Term Repo Operations (LTROs) to its arsenal in February 2020 to ensure availability of liquidity as well as transmission of rates. Under LTROs, the Reserve Bank provides longer term loans usually of 1-3 year maturity to banks at a floating rate linked to the policy repo rate on the back of government securities as collateral which enables banks in lending more to the real economy. When COVID-19 struck, the Reserve Bank introduced TLTRO to provide targeted liquidity to sectors and entities experiencing liquidity constraints and restricted market access due to the pandemic3. The funds received by banks were to be invested in investment grade corporate debt. The operations were undertaken in two phases. Under TLTRO 1.0 which was announced on March 27, 2020, the Reserve Bank conducted four auctions in tranches of ₹25,000 crore each, amounting to a total of ₹1,00,000 crore. The tenor was up to three years at a floating rate linked to the policy repo rate. ₹1,00,050 crore was allotted under TLTRO 1.0. TLTRO 2.0 was announced on 17 April, 2020 which sought to address liquidity constraints faced by small and mid-sized corporates, including NBFCs and micro finance institutions (MFIs). Under the TLTRO 2.0 window, a sum of ₹50,000 crore was to be made available at policy repo rate for tenors up to three years. In the first tranche, total bids received amounted to ₹12,850 crore, with a bid to cover ratio of 0.54. Subsequently, on October 9, 2020, the Reserve Bank announced commencement of on-tap TLTRO of up to three years tenor for a total amount of up to ₹1,00,000 crore at a floating rate linked to the policy repo rate to revive economic activity in certain important sectors like agriculture, micro, small and medium enterprises (MSMEs) and secured retail, amongst others and it has been extended till December 31, 2021. The distribution of TLTRO funds under the first two phases suggests that ₹61,586 crores were disbursed to NBFCs and Housing Finance Companies (HFCs), of which 60 per cent were obtained by NBFCs. Among NBFCs, non-deposit taking NBFCs, particularly systemically important non-deposit taking NBFCs (NBFCs-ND-SI), were the major beneficiaries by getting 82.2 per cent of the funds. Within NBFCs-ND-SI, Investment and Credit companies (NBFCs-ICC) and Infrastructure Finance Companies (IFCs) garnered nearly three-fourth of the funds (Chart 6). IV. Data and Methodology This article seeks to empirically assess the impact of the first two phases of TLTRO on NBFCs’ liquidity position by comparing NBFCs that received funding via TLTRO with those that did not5. The impact of the policy on the asset-liability mismatch in various maturity buckets is investigated as TLTRO was essentially a tool to augment liquidity and NBFCs were reportedly facing issues in their short-term asset liability mismatch (ALM) buckets. The dataset used in this analysis – supervisory data of NBFCs that recorded the amount of funding received and other balance sheet indicators – is ideal for undertaking a difference-in-difference exercise wherein NBFCs that received TLTRO funding (treatment NBFCs) are compared with those that did not (control NBFCs). Difference-in-difference regression attempts are undertaken in the spirit of experimental research design wherein there is a treatment group and a control group as in a natural experiment. IV.1 Data and Stylised Facts There were 136 NBFCs that requested funding via TLTRO, most of which were NBFCs-ND-SI, as mentioned earlier. Data on their balance sheet and financial performance from December 2019 to December 2020 on quarterly basis were collected from the supervisory database and matched with the set of NBFCs that received funding to get a set of treatment NBFCs. NBFCs that did not get funding are included in the control group (Table 1). The number of companies in each quarter varies based on their reporting in the supervisory platform. | Table 1: Asset Size of Treatment and Control NBFCs | | (₹ Crore) | | Treatment NBFCs | | Period | NBFCs-D | NBFCs-ND | NBFCs-ND-SI | Total | | ICC | ICC | NBFC - MFI | NBFC - Factor | NBFC -ICC | NBFC -IFC | NBFC - NOFHC | NBFCs-ND-SI
Total | | Dec-19 | 1,52,652 | 873 | 36,101 | - | 5,23,024 | 29,945 | 27,440 | 6,16,510 | 7,70,034 | | | (3) | (1) | (10) | - | (35) | (1) | (3) | (49) | (53) | | Mar-20 | 3,26,849 | 1,599 | 47,405 | - | 6,64,100 | 7,70,746 | 28,895 | 15,11,145 | 18,39,594 | | | (6) | (2) | (11) | - | (48) | (3) | (3) | (65) | (73) | | Jun-20 | 3,28,090 | 2,808 | 44,631 | - | 6,56,740 | 8,05,097 | 31,219 | 15,37,687 | 18,68,585 | | | (7) | (4) | (10) | - | (48) | (3) | (3) | (64) | (75) | | Sep-20 | 4,09,992 | 2,403 | 44,155 | - | 7,16,281 | 8,27,570 | 32,468 | 16,20,474 | 20,32,869 | | | (8) | (3) | (9) | - | (50) | (3) | (3) | (65) | (76) | | Dec-20 | 4,06,914 | 2,483 | 36,818 | - | 4,82,795 | - | 32,762 | 5,52,376 | 9,61,773 | | | (6) | (3) | (6) | - | (36) | - | (3) | (45) | (54) | | Control NBFCs | | Period | NBFCs-D | NBFCs-ND | NBFCs-ND-SI | Total | | ICC | ICC | NBFC - MFI | NBFC -Factor | NBFC -ICC | NBFC -IFC | NBFC -NOFHC | NBFCs-ND-SI
Total | | Dec-19 | 40,221 | 227 | 7,630 | 1,298 | 3,13,335 | 5,690 | 2,722 | 3,30,676 | 3,71,123 | | | (2) | (1) | (4) | (1) | (50) | (1) | (1) | (57) | (60) | | Mar-20 | 45,146 | 224 | 10,416 | 1,431 | 4,97,605 | 23,321 | 11,853 | 5,44,627 | 5,89,997 | | | (4) | (1) | (6) | (1) | (74) | (3) | (2) | (86) | (91) | | Jun-20 | 44,377 | 22,286 | 10,203 | 1,201 | 4,64,337 | 76,783 | 12,108 | 5,64,632 | 6,31,295 | | | (4) | (3) | (6) | (1) | (71) | (4) | (2) | (84) | (91) | | Sep-20 | 46,528 | 22,995 | 9,585 | 1,320 | 5,26,639 | 72,864 | 14,916 | 6,25,323 | 6,94,846 | | | (4) | (2) | (6) | (1) | (76) | (4) | (2) | (89) | (95) | | Dec-20 | 35,232 | 24,771 | 964 | 1,451 | 3,32,450 | 23,466 | 5,345 | 3,63,676 | 4,23,679 | | | (2) | (3) | (1) | (1) | (49) | (3) | (1) | (55) | (60) | Note: Figures in parenthesis are number of NBFCs.
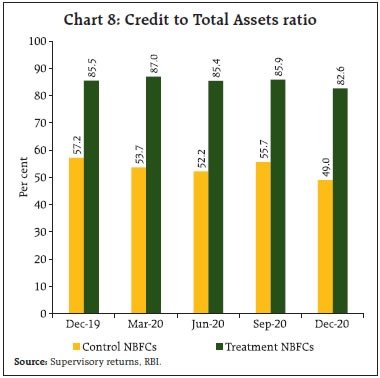
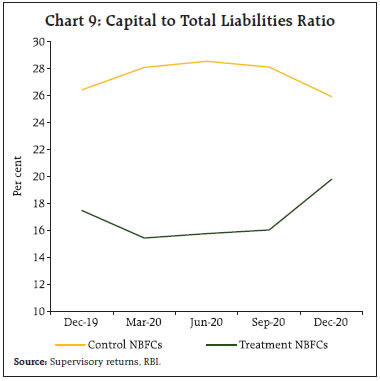
Source: Authors’ calculations based on supervisory data from December 2019 to December 2020 on quarterly basis. | In order to understand the nature of NBFCs that received the funding versus those that did not, we explore the characteristics of our sample of treatment and control groups with respect to size (total assets), soundness (capital/total liabilities), liquidity [(cash and bank balances + current investments) / total assets], profitability (return on assets, i.e., net profits/ total assets) and asset quality (Non-Performing Assets [NPA] ratio, i.e., Gross NPAs/ total assets).6 Table 2 summarises these key variables that are used in our analysis. It is evident that the beneficiaries of TLTRO funding were not chosen randomly but reflects cherry picking by banks based on certain NBFC specific characteristics. Firstly, the treatment NBFCs are bigger in size and are mainly those engaged in credit intermediation (Charts 7 and 8). Control NBFCs, being comparatively smaller in size, may be more reliant on paid up capital and reserves and surplus and are lower leveraged than the larger treatment NBFCs, which have access to additional sources of funds in the form of borrowings. This would explain the higher capital to total liabilities ratio of the former. In a similar vein, treatment NBFCs may be keeping lower liquid funds in their books as they can generally tap into low cost funding channels when necessity arises as against control NBFCs which may not be privy to such funding channels (Charts 9 and 10). 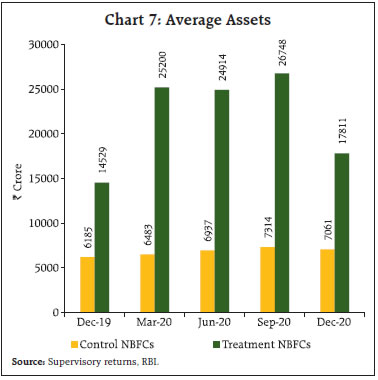
| Table 2: Descriptive Statistics of Key Variables | | Variables | Overall | | N | Mean | S.D. | Min | Max | | Total Assets | 732 | 14,106 | 38,702 | 117.5 | 4,05,061 | | Capital to Total Liabilities Ratio | 732 | 34.4 | 23.0 | 10.5 | 93.2 | | Liquidity Ratio | 732 | 13.0 | 14.2 | 0.5 | 58.5 | | Return on Assets | 732 | 1.2 | 1.5 | -1.4 | 4.6 | | NPA Ratio | 719 | 3.0 | 4.1 | 0 | 17.1 | | Credit to Total Assets Ratio | 731 | 69.3 | 27.0 | 0 | 94.9 | | Variables | Treatment NBFCs | | N | Mean | S.D. | Min | Max | | Total Assets | 332 | 22,955 | 55,396 | 117.5 | 4,05,061 | | Capital to Total Liabilities Ratio | 332 | 28.7 | 16.6 | 10.5 | 93.2 | | Liquidity Ratio | 332 | 11.0 | 7.7 | 0.5 | 45.2 | | Return on Assets | 332 | 1.2 | 1.2 | -1.3 | 4.5 | | NPA Ratio | 329 | 2.4 | 2.6 | 0 | 17.1 | | Credit to Total Assets Ratio | 332 | 80.4 | 10.6 | 44.6 | 94.9 | | Variables | Control NBFCs | | N | Mean | S.D. | Min | Max | | Total Assets | 400 | 6,760 | 8,891 | 223 | 53,367 | | Capital to Total Liabilities Ratio | 400 | 39.0 | 26.2 | 10.5 | 93.2 | | Liquidity Ratio | 400 | 14.6 | 17.7 | 0.5 | 58.5 | | Return on Assets | 400 | 1.2 | 1.6 | -1.4 | 4.6 | | NPA Ratio | 390 | 3.4 | 5.0 | 0 | 17.1 | | Credit to Total Assets Ratio | 399 | 60.1 | 32.5 | 0 | 94.9 | | Note: S.D. is standard deviation. In per cent except total assets which is in ₹ crore. |
 Generally, control NBFCs reported higher impaired assets than treatment NBFCs (Chart 11). Profitability of treatment and control NBFCs improved with the gradual resumption of economic activities (Chart 12).
IV.2 Identification and Empirical Design Since the choice of NBFCs for funding by banks was not random, it is necessary to evaluate the correlation of individual NBFC characteristics to the treatment status to isolate the impact of TLTRO. The following linear probability model was estimated for the period December 2019, the quarter before the implementation of TLTRO, to estimate the impact of balance sheet variables on the treatment status: 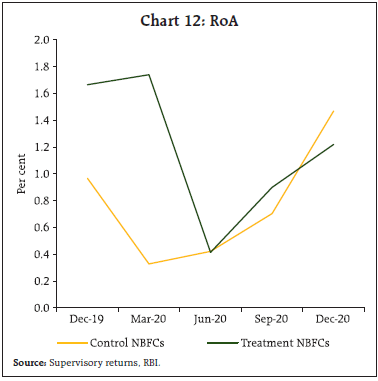
 where i indexes NBFCs and Treatedi is a dummy variable which takes the value one for NBFCs that received the funding and zero for those that did not. Following Gropp et al. (2018) and Giasante et al. (2020) and based on the stylised facts discussed in the previous section, the independent variables included are SIZE7 which is the total assets of the NBFC, ROA (net profits/ total assets) for profitability, NPARATIO (gross NPAs/ total assets) for asset quality, CAPITAL (capital/total liabilities ratio) for soundness and LIQUIDITY [(cash and bank balances + current investments)/ total assets)] for the liquidity position. Results indicate that Size, NPA ratio and liquidity significantly influence the probability of getting funds under TLTRO (Table 3). These characteristics will be controlled for in the main difference-in-difference exercise. Table 3: Linear Probability Model
(Dependent Variable – Treatment Dummy) | | Treatedi | Coefficient | | Size | 0.234** | | | (0.116) | | ROA | 0.00934 | | | (0.033) | | NPA Ratio | -0.0293** | | | (0.014) | | Capital | -0.00249 | | | (0.002) | | Liquidity | -0.00908*** | | | (0.003) | | Observations | 110 | | Adjusted R2 | 0.084 | Here, Size is a dummy variable which takes the value 1 if the total assets of a NBFC is in the top 25 percentile in the asset size distribution of December 2019 quarter.
Standard errors in parentheses.
* p < 0.10, ** p < 0.05, *** p < 0.01 | Following is the baseline difference-in difference specification:  where Mismatchi,t is the dependent variable defined as the difference between inflows and outflows (in ₹crore) for each maturity bucket; ꞵi is NBFC fixed effects; αt is time fixed effects; Treatedi is an indicator variable that equals one for the treatment NBFCs and zero for the control NBFCs; and Postt denotes the period after the intervention which takes the value of one from June 2020 onwards. Xi,t includes the control variables as previously mentioned. Additionally, two other liquidity augmenting policy measures, namely, a) Partial Credit Guarantee Scheme (PCGS), which was introduced in December 2019 to provide government guarantee to PSBs for purchase of pooled assets from financially sound NBFCs/HFCs and b) Special Liquidity Scheme (SLS) which was announced by the Government in July 2020 to improve the liquidity position of NBFCs/HFCs through a Special Purpose Vehicle are also controlled for in the estimation as the identity of the beneficiary NBFCs were available via supervisory datasets8. The coefficient of interest, δ, measures the difference, subject to controls, in mismatch between NBFCs that received funding via TLTRO and those that did not after the implementation of the policy compared to before and hence, is equivalent to a difference-in-difference estimate. Three specifications of the model were estimated. Model 1 is a regression with time and NBFC fixed effects and no controls, model 2 includes controls and model 3 has lagged NBFC specific independent variables to reduce the possible endogeneity problem, expressed in the following manner:  Standard errors are clustered at the NBFC level. V. Results As alluded to earlier, the model was estimated with ALM as the dependent variable, which is defined as the difference between inflows and outflows (in ₹ crore) for each maturity bucket. A positive coefficient value of mismatch indicates more inflows than outflows for the given bucket and is indicative of a comfortable liquidity position. An improvement in mismatch can be attributed to either an increase in inflows or a decrease in outflows. From an accounting perspective, issuance and repayment of market instruments by NBFCs are dealt with in the outflows part of the structural liquidity return. Therefore, in the context of our study, it appears that the NBFCs which received TLTRO funding, used that money to pay off the existing liabilities in those maturity buckets which were due for repayment shortly and in which NBFCs were facing liquidity crunch. This may result in a fall in outflows and subsequent improvement in the ALM position for those buckets. However, these funds availed via TLTRO have to be accounted for in subsequent maturity buckets, when they will be due for repayment. In such cases, treatment NBFCs may face negative and significant outflows in the appropriate long-term maturity buckets as compared to control firms. To assess the impact of TLTRO on ALM, we first looked at the less than one-year asset liability mismatch bucket. a) Less than One-Year Combined Maturity Bucket To better understand the changes in ALM profiles due to TLTRO, binscatter diagrams of mismatch for treatment and control NBFCs are plotted9 (Chart 13). Here, ‘0’ is March 2020, i.e., the period in which TLTRO was introduced and ‘-1’ is the period before introduction of TLTRO (December 2019) while ‘1’ is the period after the introduction of TLTRO (June 2020). In the less than one-year maturity bucket, treatment NBFCs were facing stress just before the introduction of the policy but the situation improved significantly for them thereafter, which was not the case for control firms (Chart 13). Further, estimation results show that this improvement is on account of TLTRO – treatment NBFCs had better liquidity position in the range of ₹ 441 crores - ₹751 crores (Table 4). It is probable that the improvement seen in this bucket is due to paying off the high cost borrowings (outflows) out of the books of the treatment NBFCs using the amount procured in the TLTRO window, which improved the ALM position.
| Table 4: Impact of TLTRO on Less than One Year Combined Maturity Bucket | | Dependent variable-Mismatch (₹ crore) | (1) | (2) | (3) | | Treatedi * Postt | 751.1** | 456.4** | 441.3** | | | (302.0) | (226.6) | (217.7) | | Adjusted R2 | 0.896 | 0.920 | 0.962 | | Observations | 725 | 711 | 534 | | Controls | N | Y | Y | | NBFC FE | Y | Y | Y | | Time FE | Y | Y | Y | Robust standard errors in parentheses
* p < 0.10, ** p < 0.05, *** p < 0.01 | Motivated by these results, a detailed evaluation of all maturity buckets in the less than one-year time frame has been undertaken in the following subsections10. i) 0-7 Days Maturity Bucket Treatment firms in this ultra-short term maturity bucket witnessed worsening in mismatch after the onslaught of COVID-19. However, this bucket reported ample funds for both treatment and control NBFCs in the period before COVID struck though the former witnessed a steep fall subsequently. Nevertheless, improvement was visible for treatment firms in the immediate aftermath of announcement of the policy on March 27, 2020 (TLTRO 1.0) and April 17, 2020 (TLTRO 2.0) which is commensurate with the short duration of the bucket (Chart 14). Table 5 confirms that treatment firms’ mismatch improved after the introduction of TLTRO in the range of ₹227 crores - ₹444 crores (Table 5). ii) Over One Month and up to Two Months Maturity Bucket In the 1-2 months maturity bucket, the treatment firms were facing liquidity stress in the pre-COVID period and the improvement is starkly visible after the introduction of the policy while control firms did not exhibit the same trend (Chart 15). After the introduction of the policy, the difference in mismatch between treatment and control firms varied between ₹214 crore and ₹281 crore on average (Table 6). | Table 5: Impact of TLTRO on 0-7 Days Maturity Bucket | | Dependent variable-Mismatch (₹ crore) | (1) | (2) | (3) | | Treatedi * Postt | 298.1** | 226.8** | 444.4*** | | | (119.1) | (114.6) | (143.0) | | Adjusted R2 | 0.917 | 0.917 | 0.935 | | Observations | 742 | 727 | 550 | | Controls | N | Y | Y | | NBFC FE | Y | Y | Y | | Time FE | Y | Y | Y | Robust standard errors in parentheses
* p < 0.10, ** p < 0.05, *** p < 0.01 |
iii) Over Two Months and up to Three Months Months Maturity Bucket Like the previous bucket, treatment firms witnessed stress in March 2020 for this bucket too which was subsequently alleviated (Chart 16). Control firms reported no such improvement. Table 7 confirms that treatment NBFCs benefitted from TLTRO in alleviating liquidity crunch in this bucket. Treatment firms benefitted by ₹220-235 crore on average due to the policy relative to control firms. The 0-7 days, 1-2 months and 2-3 months borrowings were due in a short while and considering the uncertainty caused by COVID-19 and the adverse liquidity situation NBFCs were grappling with, rolling over of funds was difficult. In such a scenario, NBFCs may have taken the prudent measure to concentrate on paying off debts using TLTRO funds. | Table 6: Impact of TLTRO on Over One Month and up to Two Months Maturity Bucket | | Dependent variable-Mismatch (₹ crore) | (1) | (2) | (3) | | Treatedi * Postt | 244.6*** | 214.0*** | 281.1*** | | | (88.55) | (79.80) | (104.9) | | Adjusted R2 | 0.691 | 0.697 | 0.761 | | Observations | 729 | 715 | 535 | | Controls | N | Y | Y | | NBFC FE | Y | Y | Y | | Time FE | Y | Y | Y | Robust standard errors in parentheses
* p < 0.10, ** p < 0.05, *** p < 0.01 |
| Table 7: Impact of TLTRO on Over Two Months and up to Three Months Maturity Bucket | | Dependent variable-Mismatch (₹ crore) | (1) | (2) | (3) | | Treatedi * Postt | 234.9** | 219.6*** | 234.0** | | | (91.64) | (79.75) | (103.6) | | Adjusted R2 | 0.668 | 0.666 | 0.741 | | Observations | 742 | 727 | 550 | | Controls | N | Y | Y | | NBFC FE | Y | Y | Y | | Time FE | Y | Y | Y | Robust standard errors in parentheses
* p < 0.10, ** p < 0.05, *** p < 0.01 |
iv) Over 6 Months and up to One Year Maturity Bucket In the longer maturity bucket of over 6 months and up to one year, treatment firms did not face stress in the immediate aftermath of COVID-19 and unlike other maturity windows, witnessed deterioration after June 2020 though it improved later (Chart 17). The results show that mismatch worsened for treatment firms in this bucket. However, this has to be seen in the context of adjusting for repayments, as discussed earlier. It is highly likely that banks bought debt of treatment firms that were due for repayment under this maturity window and that possibly explains the negative and significant coefficients under each specification (Table 8). However, being of a slightly longer tenure, it gives treatment NBFCs sufficient time to plan and raise resources to meet the funding needs.
| Table 8: Impact of TLTRO on Over 6 Months and up to One Year Maturity Bucket | | Dependent variable-Mismatch (₹ crore) | (1) | (2) | (3) | | Treatedi * Postt | -421.5* | -361.1** | -486.6** | | | (234.0) | (179.3) | (226.2) | | Adjusted R2 | 0.754 | 0.753 | 0.816 | | Observations | 742 | 727 | 550 | | Controls | N | Y | Y | | NBFC FE | Y | Y | Y | | Time FE | Y | Y | Y | Robust standard errors in parentheses
* p < 0.10, ** p < 0.05, *** p < 0.01 | b) Over One Year and up to Three Years Maturity Bucket Treatment firms reported more outflows relative to inflows in the one-three year maturity bucket in periods after the introduction of TLTRO, just like the over 6 months-1 year maturity bucket (Chart 18).
| Table 9: Impact of TLTRO on Over One Year and up to Three Years Maturity Bucket | | Dependent variable-Mismatch (₹ crore) | (1) | (2) | (3) | | Treatedi * Postt | -625.5** | -380.1* | -358.0** | | | (257.2) | (200.7) | (172.9) | | Adjusted R2 | 0.801 | 0.847 | 0.919 | | Observations | 742 | 727 | 550 | | Controls | N | Y | Y | | NBFC FE | Y | Y | Y | | Time FE | Y | Y | Y | Robust standard errors in parentheses
* p < 0.10, ** p < 0.05, *** p < 0.01 |
Table 9 confirms that treatment NBFCs faced deterioration in mismatch in this maturity bucket. As in the case of over 6 months-one year ALM window, it is likely that banks purchased papers of treatment NBFCs of one-three years tenure and hence, NBFCs that received the TLTRO benefit suitably accounted for it in their structural liquidity returns. Nevertheless, treatment NBFCs, being larger and good performers, can raise resources from the market or banks to pay off this debt as the need arises. The impact of TLTRO on incremental credit and incremental liquid assets was also investigated and found to be not significant. Robustness Checks As a robustness check, a dynamic specification in the following form was estimated to confirm that improvement in ALM of treatment NBFCs happened after the implementation of TLTRO: 
where Mismatchi,t is the difference between inflows and outflows (in ₹ crore), ꞵi is NBFC fixed effects, αt is time fixed effects, Treatedi is an indicator variable that equals one for the treatment NBFCs and zero for control firms. Dt is an indicator variable for each time period between December 2019 to December 2020 (excluding March 2020 which serves as the reference period). The same set of controls are employed here too. The coefficient of interest is δ, which measures the difference, subject to controls, in mismatch between NBFCs that received funding via TLTRO and those that did not in a given period compared to March 2020. The results are presented as event study plots. It can be observed that, after controlling for balance sheet characteristics, time-invariant factors (NBFC fixed effects) and time fixed effects, the difference in mismatch between treatment and control groups was not statistically significant in the pre-TLTRO period (December 2019) compared to March 2020. The difference begins to become statistically significant from June onwards, indicating the impact of the policy (Chart 19). These results also verify the assumption of parallel trends11. 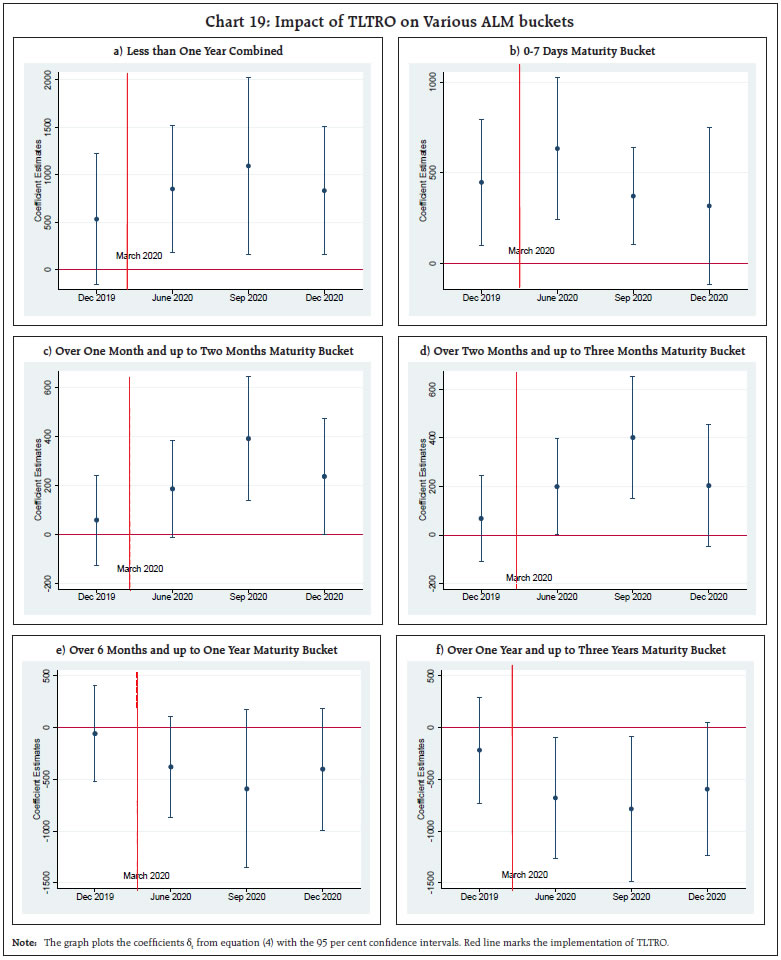 VI. Conclusion As NBFCs were finding their footing after the IL&FS default, the COVID-19 pandemic started a chain of adverse reactions which exacerbated their liquidity position. The Reserve Bank and the Government unleashed a slew of policy measures to salvage the situation, one of which was the TLTRO scheme that aimed at providing targeted liquidity to sectors and entities which were experiencing liquidity constraints and restricted market access. Under the scheme, banks were provided funds at the repo rate and were directed to invest in investment grade papers of corporates, including NBFCs. This paper analyses the impact of TLTRO on the ALM of NBFCs using a difference-in-difference methodology. The results show that the policy was beneficial in alleviating the liquidity stress faced by the treatment NBFCs in the period following COVID-19, and helped them navigate the tough times, especially since both markets and banks were not forthcoming in lending to them of their own accord. NBFCs that received funds via this scheme were facing stress in some short-term ALM buckets in the immediate aftermath of the onslaught of COVID-19 and those buckets witnessed betterment after the implementation of the policy as they repaid their extant liabilities. In the longer maturity buckets, treatment NBFCs had mismatch amounts in the negative zone, i.e., more outflows than inflows, as the debt purchased by banks under the scheme were due for repayment. The empirical exercise undertaken in this article, therefore, suggests that the Reserve Bank’s intervention for easing financial conditions proved to be timely and effective for the NBFC sector. References Bitra, Y., Meena, M., and A. Agarwal (2020), “Issues in Non-bank Financial Intermediation”, Reserve Bank of India Bulletin, June 2020. Giansante, S., Fatouh, M., and S. Ongena (2020), “Does quantitative easing boost bank lending to the real economy or cause other bank asset reallocation? The case of the UK”, Bank of England Working Paper No 883, August. Gropp, R., Mosk, T., Ongena, S., and W. Carlo (2018), “Bank Response to Higher Capital Requirements: Evidence from A-Quasi-Natural Experiment”, The Review of Financial Studies, Vol 32, Issue 1, pp: 266– 299. Jayakumar, N., Neelima, K.M., and G. Prasad (2021), “Performance of NBFCs during the Pandemic: A Snapshot”, Reserve Bank of India Bulletin, May 2021. Reserve Bank of India (2020), Report on Trend and Progress of Banking in India 2019-20. Reserve Bank of India (2021), Annual Report 2020-21. Rituraj, Jagadeesh, M., Kumar, A., and A. Meena (2020), “Market Financing Conditions for NBFCs: Issues and Policy Options”, Reserve Bank of India Bulletin, June 2020.
|