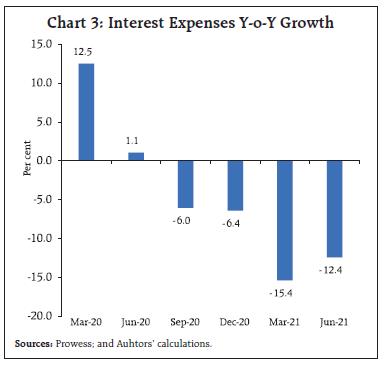
The course of the economy over the month and a half gone by has been altered by the slow retreat of the second wave of the pandemic. Aggregate demand conditions are buoyed by the release of pent-up demand post unlock, while the supply situation is improving with the monsoon catching up to its normal levels and sowing activity gaining pace. Reaffirming the traction that the economy is gaining, the manufacturing activity is gradually turning around, while contraction in services has moderated. Spurred by comfortable liquidity conditions, financial conditions stay benign and supportive of the recovery. Introduction This edition of the State of the Economy coincides with the fourth month of the Shalivahana Shaka – the Indian national calendar – when the south west monsoon stretches its embrace across India. It is a time of sacrifice and fasting, and of the celebration of material creations, especially water. It is the season of mists and mellow fruitfulness, its music drowning out the songs of spring1. In keeping with the spirit of the month of Sravana, sowing of major crops has picked up across the country, rapidly closing up the shortfall in sown area due to the initial lull in the progress of the rains; in fact, by end-July 2021, the normal area under sowing had been exceeded. In symphony, tractor sales have surged well above pre-pandemic levels and fertiliser sales are up strongly too. Rural unemployment is declining and so is the number of rural households demanding work under the Mahatma Gandhi National Rural Employment Guarantee Scheme, indicating that the market for farm labour is tightening as agricultural activity gathers steam. So, the first impulses of the recovery have arrived, riding on thunder and lightning as the monsoon intensifies. Another growth impulse is igniting financial markets. 2021 could well turn out to be India’s year of the initial public offering (IPO). Debut offerings by Indian unicorns – unlisted start-ups – kicked off by a food delivery app’s stellar IPO that was oversubscribed 38 times, have set domestic stock markets on fire and global investors in a frenzy. Following in its wake, the US$ 2.2 billion proposed listing by a payment and financial services app symbolises investor excitement surrounding India’s digitalisation – digital payment solutions; e-commerce; logistics. The IPO of a specialty chemical manufacturing exporter was subscribed 180 times. These IPOs of new age companies arrive as bullishness about India mounts, especially around Indian tech. In fact, India’s tech boom has been long awaited, with strong global and domestic appetite for what are widely believed to be world class businesses in the pipeline, notwithstanding initial losses that have largely stemmed from the deep discount business models adopted by them. These listings coincide with a broader rush by Indian companies to tap the market and the fomo (fear of missing out) factor driving investors, which have taken the benchmark indices to records. A new era has clearly begun. It is estimated that India has 100 unicorns (Credit Suisse, 20212), with 10 new ones created in 2019, 13 in 2020 in spite of the pandemic and 3 a month in 20213 so far. They do not rely on inherited wealth or dependence on bank loans or extra-business connections, but on talent and innovative ideas. These are the children of liberalisation, not of the wealthy (Aiyer, 20214). In fact, markets regard them as ‘concept stocks’ because they flout the existing conventions – they have neither made profits nor issued any guidance on ever getting to profitability. Evidently, without an established set of plain vanilla financial metrics to value these businesses, investors have shown that they tend to be open-minded. These IPOs also dispel the myth that start-ups have to domicile outside India to tap the public market. This is a great positive development for the domestic ecosystem of startups. It showcases the strength, maturity and scale of domestic equity markets. It will encourage a larger flow of savings than before into venture capital, and fund job creation, infrastructure, innovation and wealth. They could inspire young Indians to give wings to their dreams and break out of traditional moulds or other cocoons of inertia. Yet, this explosion of interest in these companies will only be sustained if they are able to convert innovative ideas into metrics such as breaking even at the level of earnings before interest, taxes, depreciation and amortisation (EBITDA) level without expensing business development costs, followed by cash flows and profits. Expanded and dynamic exploitation of innate advantages such as data and logistics will be essential to live up to investors’ starry-eyed expectations. The jury is still out. Investors will closely scrutinise their stories. Analysts will put it down to stock markets’ idiosyncratic behaviour, investors’ greed and bandwagon effects, including myopic pursuit of listing day gains. There are already warnings of systemic risks to financial stability that monetary policy authorities should not ignore as the unicorn IPO party gets going (Ranade, 20215). The bursting of the dotcom bubble in 2001 showed that many start-ups could go bust, but risk management practices have changed to diffuse this risk over many newcomers. And those that survive can go on to become the Googles, Facebooks and Amazons of the future. Yet another sign of revitalisation of the economy is the manner in which corporate India has faced the second wave of the pandemic relative to the first one. 1,427 listed non-financial companies have declared their earnings results so far and they account for 86.8 per cent of the market capitalisation of all listed non-financial companies in India. During the quarter that ended in June 2021, net sales of these companies surged by 57 per cent year-on-year (y-o-y) versus a decline of 34 per cent in April-June 2020 when the first wave raged (Chart 1a), in spite of anecdotal high-frequency evidence that the second wave took a bigger toll on rural sales than the first wave. The y-o-y jump in net sales this year is admittedly suffused with base effects because of the large fall in the corresponding quarter last year; however, even on a sequential basis (q-o-q) that skirts base effects, net sales of these companies declined around 9 per cent, an appreciable improvement over the plunge a year ago (Chart 1b). This suggests that with the ebbing of the second wave, demand is limping back towards normal levels, but a catch-up will take some more time. 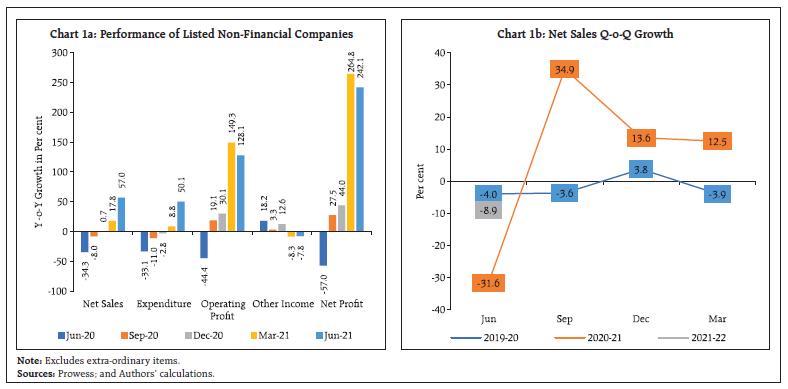 Expenditure of these companies shot up y-o-y and posted shallower declines q-o-q relative to preceding quarters (Chart 2), reflecting elevated international commodity prices and cost pressures domestically. In particular, expenses on wages and salaries jumped way above the increases posted in the five preceding quarters, indicative of stepped-up rehiring. Listed companies in two sectors, viz., information technology (IT) and auto and ancillaries, constituted the highest proportion of total wages and salaries paid by all listed non-financial companies (Table 1). Hiring activity by the three top IT companies are showing signs of an ebullient revival6. In contrast, interest expenses fell sharply, reflecting the impact of deleveraging (Chart 3). 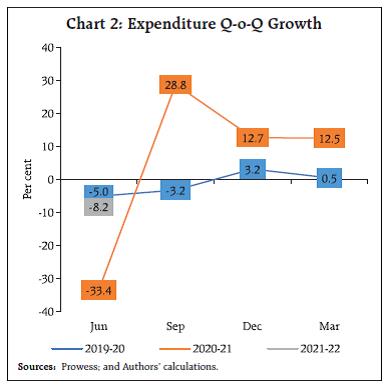 With the faster rise in sales relative to expenditure, both operating and net profits increased by more than 100 per cent and, in fact, net profits increased by closer to 250 per cent in April-June this year. The quarter also saw the sharpest increase in credit rating upgrades relative to downgrades since the beginning of the pandemic7. Forward earnings are on the rise, with metals and basic materials leading the way, indicating that the recovery is gathering steam and far from its peak (Chart 4). Private equity and venture capital investment at US$ 8.8 billion in July 2021 grew four times on y-o-y basis, with 119 funding deals led by IT and IT enabled services (ITes) companies.8 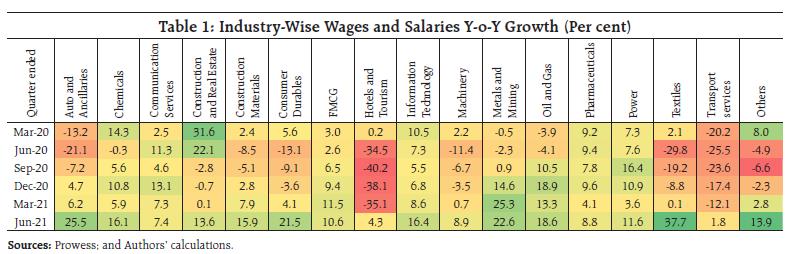
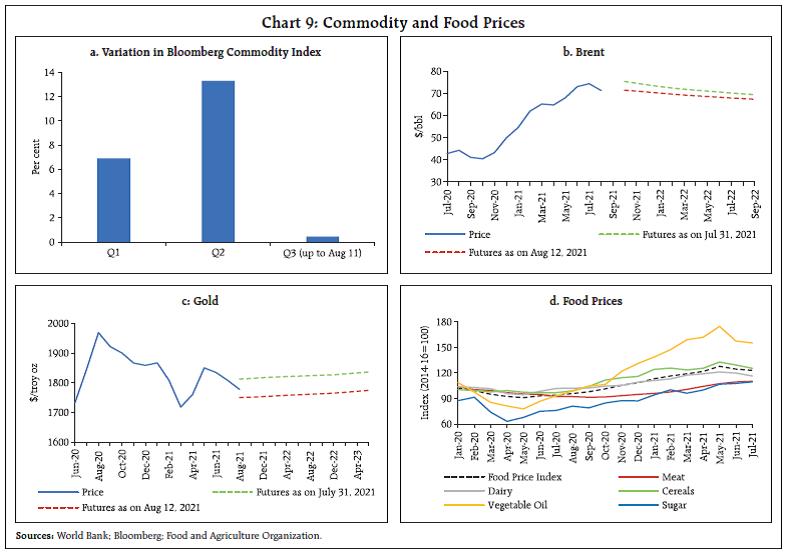
 Among listed financial companies – 390 companies representing 88.5 per cent of market capitalisation of all listed financial sector companies in India – net sales, which primarily includes interest income, increased marginally but other income, which includes fees, commissions and profit/loss from transactions in securities, saved the blushes and recorded a sharp rise relative to a year ago. Expenditure growth remained subdued, reflecting the easy cost conditions in the economy as a result of the Reserve Bank’s measures to expand liquidity and ease financial conditions. Taken together, these factors helped financial companies to post substantial growth in operating profits, literally snatched from the virulence of the second wave. Furthermore, a fall in provisioning costs contributed to the sharp growth in net profits posted by these companies (Chart 5). 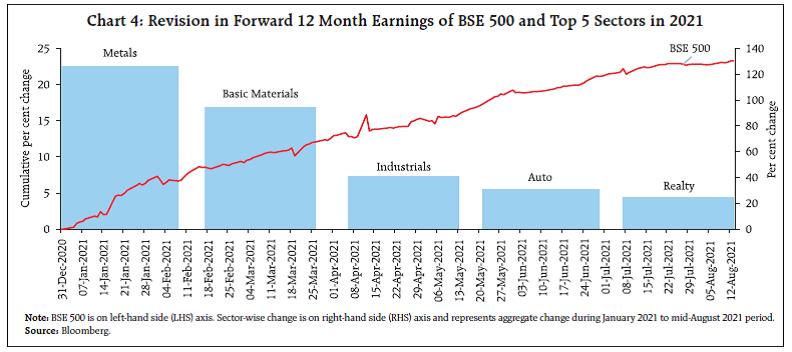 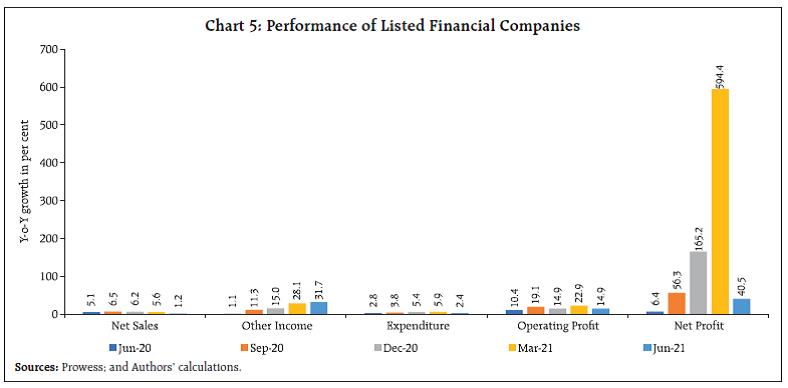 To end this section on a light-hearted note and move on to the business parts of this article, The Economist magazine has updated its Big Mac Index, which it projects as a tongue-in-cheek guide to whether or not currencies are at their “correct” level. It is based on the notion that in the long run, exchange rates should move towards the rate that would equalise the prices of an identical basket of goods and services (in this case, a burger) in any two countries. It was never intended as a precise gauge of currency misalignment, but it has become a global standard, a part of several economic textbooks and the subject of dozens of academic studies. Its updates sometimes produce bizarre estimates of mis-valuation. For instance, in its latest GDP per capita adjusted update, the Swiss franc turns out to be overvalued by 6.5 per cent, making a mockery of the label of currency manipulator by the US Treasury. The Indian rupee is 18 per cent undervalued by the same metric, but no beef products are used here – the Maharaja Mac in which chicken patties are used, forms the basis of valuation. Also, what is almost forgotten is that the US dollar, the numeraire currency against which these mis-valuations are measured, has been debased by 253 per cent and the price of the American burger has, as a result, risen from US$ 1.60 when it was introduced 35 years ago to US $ 5.65. So we decided to give the Big Mac’s currency valuation powers a go by and turned it on its head. Looking at affordability or how many burgers can a currency buy relative to the US dollar, we measure how much a country’s GDP is valued in purchasing power terms. Voila! The results uphold conventional wisdom – in terms of the Maharaja Mac, India is currently the fourth largest economy in the world after China, the US and Japan9 (Chart 6a). This broadly conforms to the latest update of the IMF as of April 2021 – on purchasing power parity, India is the third largest economy in the world in PPP terms (Chart 6b). II. Global Setting The global economic recovery is gaining traction, although its diverging and unequal pace is fraught with downside risks. In its July update of the World Economic Outlook (WEO), the International Monetary Fund (IMF) has identified vaccine access as the principal fault line along which the global recovery is split, with the advanced economies (AEs) gaining a head start due to rapid immunisation while most emerging market economies (EMEs) still struggle to secure vaccine supplies and bring down infections and mortalities. Hence, the IMF’s global growth forecast for 2021 remains unchanged at 6.0 per cent, but there are offsetting variations across country groups. While the AEs are poised to grow at a higher pace than projected earlier (in April 2021), EMEs are expected to grow slower, owing mainly to marked down growth forecasts for emerging Asian economies (Table 2). In Q2:2021, as per data available so far, the UK was the fastest growing economy in the world with growth of 20.7 per cent (q-o-q, saar)10, followed by the Euro area which logged growth of 8.3 per cent, with re-opening facilitated by the rapid pace of vaccination and booming consumer/business confidence and ongoing government support. The US economy, on the other hand, grew by 6.5 per cent in Q2:2021, much below the consensus estimate (8.5 – 9 per cent). Strong consumer spending was punctured by inventory drawdown and lower residential investment. Nevertheless, the US surpassed its pre-pandemic level of GDP during the quarter. The global composite purchasing managers’ index (PMI) at 55.7 hit a 4-month low in July 2021. Underlying this easing, the manufacturing and services PMI also tumbled, even though all indices have stayed in expansion mode for 13 months in a row (Chart 7). Among other indicators, the employment situation is improving across the board in advanced economies. The unemployment rate in the European Union dipped from 7.3 per cent in May to 7.1 per cent in June, with 4,87,000 jobs created. In the US, the unemployment rate decreased to 5.4 per cent in July, with nonfarm payrolls rising more than expected. The unemployment rate has moderated in other AEs as well, including Australia, Canada and the UK. Even as global merchandise trade remains buoyant, trade in services lags behind. As per World Trade Organization’s (WTO) release on July 23, 2021, global services trade plunged by 9.0 per cent (y-o-y) in Q1:2021, after declining by 21.0 per cent in 2020. The persistent weakness in travel acts as the main drag on services trade. Granular data for monthly merchandise trade show that the y-o-y growth rate remained in double digits but mainly on a favourable base (Chart 8a). Global freight prices remained elevated across key routes during July due to pandemic-related disruptions, with freight rates for outbound shipment from China to Europe soaring by around 8 times. These routes are also used by Indian exporters to ship their products to the USA and European countries, which are India’s major export destinations (Chart 8b). 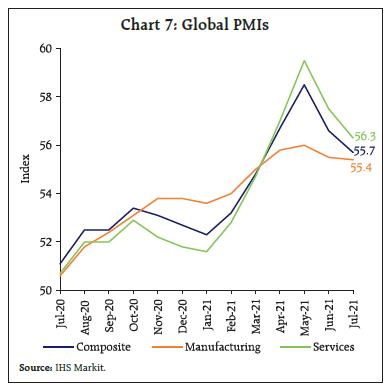 With the recovery strongly afoot, commodity prices have been soaring. The Bloomberg commodity index rose for four months(end-to-end) before easing in August so far (Chart 9a). Crude oil prices have largely been on an uptrend in 2021 so far; the WEO’s July Update assumes that it will rise by about 60 per cent above its low base of 2020. Around mid-July, however, there was a sharp correction in prices due to demand concerns sparked by the rapid spread of the delta variant of the virus and the OPEC plus reaching an agreement to ease supply with an additional output of 400,000 barrels per day each month from August onwards. Another round of easing has set in from early August on demand concerns as also high stockpiles in the US (Chart 9b). Due to continuing safe haven demand and rallies in US Treasury yields, bullion had stabilised around the US$1,800 per troy ounce mark in July, but fell to a 4-month low by the second week of August on strengthening dollar and higher yields (Chart 9c). Food prices, barring sugar and meat, moderated for the second consecutive month in July (Chart 9d). Nevertheless, the food price index in July 2021 was 31.0 per cent higher than its level a year ago. 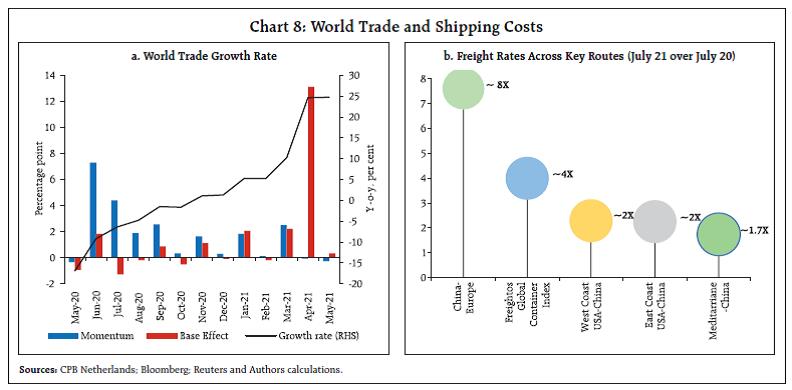
 In the financial markets, AE stocks were lifted by strong rallies. The regulatory crackdown in China in July led to massive sell-offs, which pulled down the overall EME index into the red on a year-to-date basis (Chart 10a). On the other hand, 10-year Treasury yields in the US continued to dip through July. On July 19, as delta variant concerns triggered sharp corrections in stock markets world-wide and led to strong safe haven demand, the 10-year yield ebbed to its lowest level since the second week of February. With the Federal Reserve following up a modestly hawkish Federal Open Market Committee (FOMC) statement with dovish assurance, long-term Treasury yields remained soft. The jobs report for July, however, has brought the rally to a pause (Chart 10b). The US dollar, on the other hand, strengthened on the back of better economic performance and the improving inflation outlook for the US. The US dollar’s rally was sharp in July and has continued into August, while most other currencies, particularly the EME currencies, have depreciated against the dollar (Chart 10c). Overall, there has been a sharp retrenchment of capital flows to EMEs in July, with net outflows from the equity segment (Chart 10d). 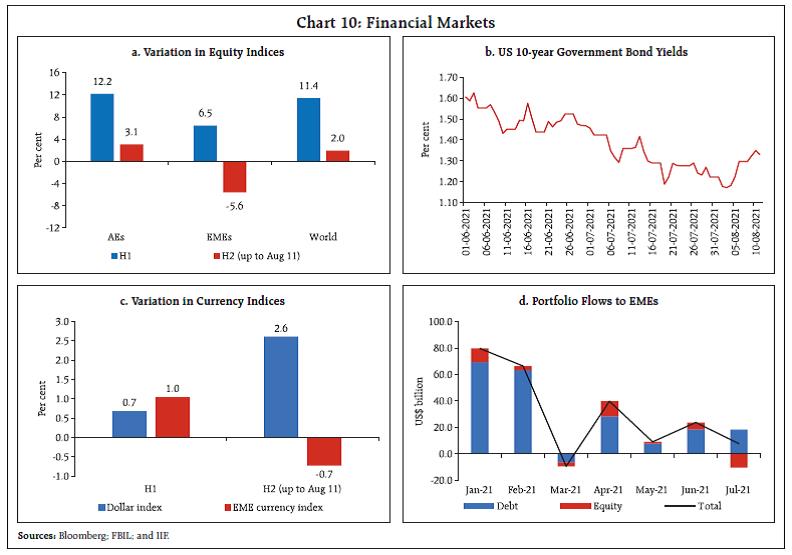 Inflation continues to perch above the inflation target of most EMEs, with AEs also grappling with a rise in recent months. In the US, the core personal consumption expenditure (PCE) inflation at 3.5 per cent in June was at a 30-year high. CPI inflation in July remained at the 13-year high level reached in the previous month. The latest FOMC statement, however, maintains that the recent spike in inflation is largely due to transitory factors. This view is endorsed by the IMF in its latest WEO. The rise in core inflation in the US is largely contributed by increase in prices of used cars, lumber and air travel, a result of pandemic-induced disruptions rather than exhaustion of spare capacity. The Euro area, with an inflation print of 2.2 per cent in July, is the latest AE with above-target inflation on record. In EMEs, inflation remains high on the back of firming commodity prices and supply disruptions (Chart 11). House prices are booming in almost every major economy, with historically low interest rates, savings accumulated during lockdowns and a desire for more space as people work from home fueling the demand11. Divergent monetary policy paths are being forged by central banks. Both Brazil and Russia effected their fourth rate hikes in 2021, with an equal magnitude of 100 basis points (bps) in July and August, respectively. Chile is the latest EME to start policy normalisation, with a rate hike of 25 bps in July while Mexico effected its second consecutive 25 bps hike in August. Among AEs, the Bank of Canada tapered its weekly bond purchase programme for the third time by C$1 billion to C$2 billion. The Bank of England, even as it maintained a pause on rate and quantum of asset purchases, gave guidance on how it would unwind its quantitative easing. On the other side of the spectrum, the European Central Bank (ECB) has maintained a persistently accommodative monetary policy stance to meet its inflation target. It set a forward guidance that interest rates will remain at their current level or lower till the inflation target is durably achieved. The ECB has changed neither the pace nor the quantum of purchases under the Pandemic Emergency Purchase Programme. After its July meeting, the Federal Reserve stated that the US was a good deal away from “substantial further progress” on its goals of maximum employment and price stability. This assuaged market sentiments. Furthermore, the Fed introduced two standing repo facilities entailing overnight collateralised lending – a domestic standing repo facility and a repo facility for foreign and international monetary authorities (FIMA Repo Facility)12. Overall, the near-term outlook for the global economy remains clouded by mounting concerns over the highly contagious delta variant that is ravaging several parts of the world. Risks to global growth are slanted to the downside at the current juncture. Worsening inflation expectations and the resultant tightening of financial conditions could drag growth down with macroeconomic and financial spillovers to EMEs. III. Domestic Developments The course of the economy over the month gone by has been altered by the slow retreat of the second wave of the pandemic. After peaking in the first week of May, the 7-day moving average (MA) of daily new cases dipped from around 40,000 in the first half of July 2021 and touched a low of 36,074 on August 16, 2021. On the vaccination front, over 55 crore doses have been administered by August 16, 2021. During the period July 26-August 8, there has been a sharp jump in rural vaccinations: of the total 9.87 crore doses administered in this period alone, 63 per cent were in rural parts13. 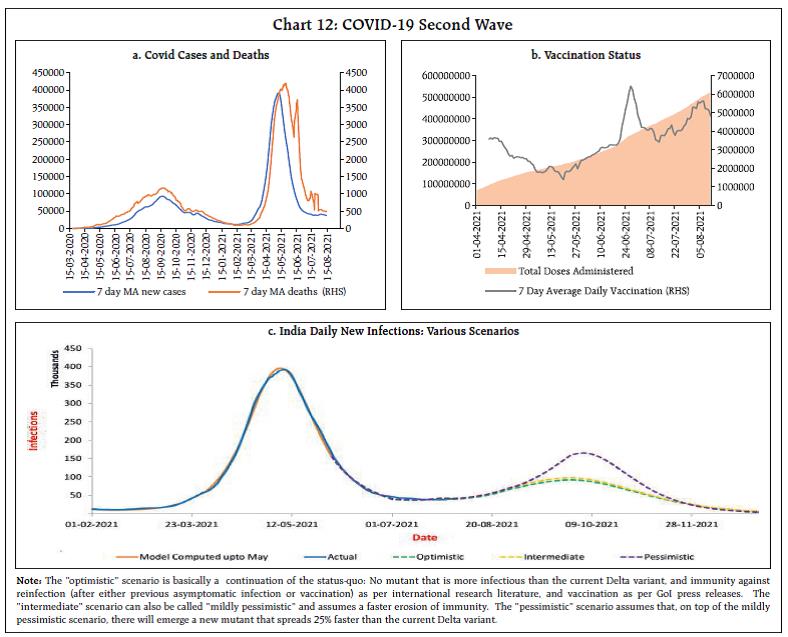 According to the 4th National Seroprevalence Survey14 conducted by the Indian Council of Medical Research (ICMR), around 68 per cent of the India’s population above the age of 6 years has gained SARS-Cov-2 antibodies, suggesting that the country is inching towards herd immunity. On the other hand, model-based simulations suggest that India is likely to see a rise in Covid infections building into a new wave that may peak in October15. The forecast underscores the need for India to accelerate its vaccination campaign, deploy surveillance methods to identify emerging hotspots and stay vigilant through genome sequencing, given the potential for new variants to emerge. With the cautious unwinding of restrictions by states, human mobility has risen to levels last seen in February 2021, prior to the onset of the second wave (Chart 13a and 13b). Electricity generation readings, too, have recovered to peak levels seen in April 2021 and are closing on to the pre-pandemic level, i.e., July 2019 (Chart 13c). Aggregate Demand Aggregate demand conditions are buoyed by pent-up demand released by unlocks and vaccination. E-way bill collections rose to their highest level in the last four months, clocking a growth of 17.3 per cent sequentially over June 2021. Normalised to February 2020 levels, E-way bills, both intra-state and inter-state, surpassed pre-pandemic levels (Chart 14a). In August so far (up to August 8, 2021), daily average E-way bills declined sequentially by 5.8 per cent, with implications for GST collections going forward. Toll collections rebounded in July, nearing the March 2021 record when Fastag was made mandatory (Chart 14b). The rise in toll collection was also supported by an increase in truck rentals on the back of increased factory output and a 10-15 per cent rise in dispatches, as per the Indian Foundation of Transport Research and Training (IFTRT)16. Toll collections in the in August so far (up to August 12, 2021) remained flat over the corresponding period a month ago. Fuel consumption recorded an uptick in July 2021. While the consumption of petrol reached pre-pandemic levels and aviation turbine fuel (ATF) recorded a sequential improvement, diesel consumption slipped marginally (Chart 15a). Automobile wholesales recorded an uptick in July, with positive momentum in growth of the passenger vehicle segment as manufacturers scaled up production and dispatches to dealerships to replenish inventory levels. Retail sales of motor vehicles turned around, hitting a growth of 33.7 per cent y-o-y and 27.7 per cent m-o-m in July. Normalised to February 2020, both transport and non-transport vehicle registrations improved, with the non-transport segment near normalising to pre-pandemic levels and the transport segment reaching 50 per cent of pre-pandemic levels (Chart 15b and c). 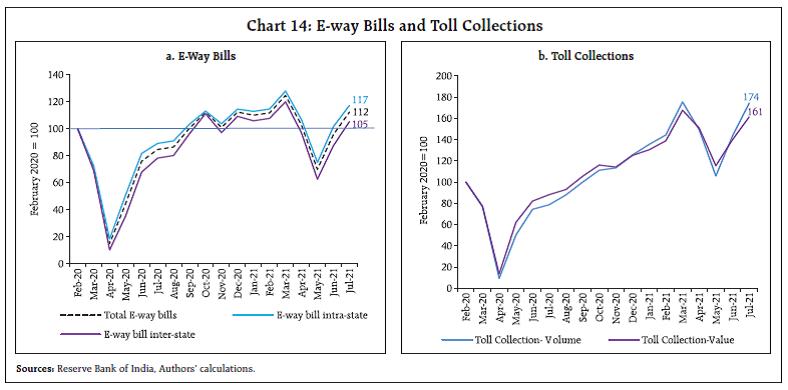
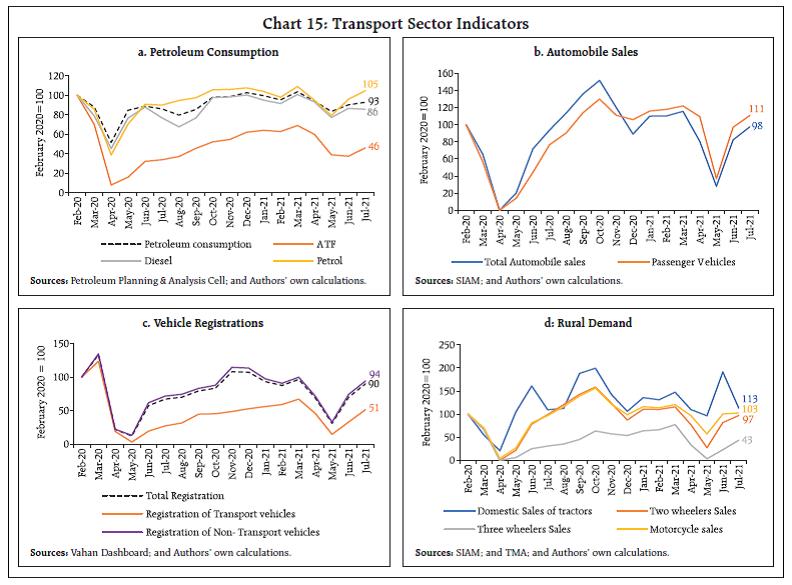 Rural demand remained up-beat, with tractor sales registering a growth by 3.3 per cent y-o-y in July, well above pre-pandemic levels. With the normal monsoon and sowing gaining traction, industry experts remain bullish on the segment, expecting a good run in the coming months. Sales of motorcycles revived, even as two- wheeler sales remained moderate in July 2021 (Chart 15d). Freight carried by Indian Railways remained resilient, marking an increase of 18.4 per cent in July (112.7 million tonnes) over its level a year ago. Of the major commodities, cement freight recorded a stark uptick - an indication of construction activity picking up (Chart 16). The aviation sector finally recorded some rebound in air passenger footfalls in the first week of August as airlines introduced special fares, and vaccinations improved travel sentiments. Currently, international flights are operating only to and from about 28 countries with which India has entered into “air bubble”17 agreements. Normalised to February 2020 levels, high frequency indicators of construction activity –steel consumption and cement production –inched closer to the baseline (Chart 17). In July 2021, the fast-moving consumer goods (FMCG) sector saw sales picking up in the rural areas and small towns as sentiments improved on the back of the favorable monsoon. Consumer electronics recorded the best-ever July sales, driven up by pent-up demand. The active number of operational kirana outlets increased by 17 per cent m-o-m in July18. 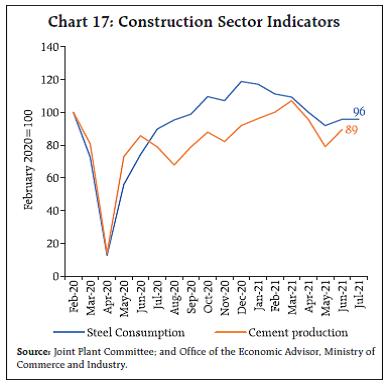 As per the household survey of the Centre for Monitoring Indian Economy (CMIE), the unemployment rate plunged to 6.95 per cent in July from 9.17 per cent a month ago. The labour participation rate also improved by 60 basis points in July 2021 over a month ago, reaching March 2021 levels (Chart 18). The fall in unemployment was more pronounced in rural areas than in their urban counterparts, pointing to the resilience of the rural sector on brightened agricultural prospects. On July 23 and August 2, 2021, the Ministry of Statistics and Programme Implementation (MoSPI) released the periodic Labour Force Survey for the period July 2019-June 2020, providing the first formal evidence of the impact of the pandemic’s first wave on labour market conditions (Annex). The Employment Purchasing Managers’ Index (EPMI) suggests that hiring has accelerated in the manufacturing sector while the services sector still shows contraction in July19 (Chart 19). During Q1:2021-22, the union government’s gross fiscal deficit (GFD) was kept in check, helped by higher tax and non-tax revenues and lower revenue expenditure relative to the same period last year (Chart 20). Gross tax revenues improved considerably – even compared with 2019-20, gross tax revenue marked an increase of 32.8 per cent, with most tax heads hitting double-digit growth in collections (Table 3). There is a strong positive momentum under all major tax heads, which is complemented by positive base effects in the case of corporation tax and GST (Chart 21). Momentum is being generated by a surge in profitability of large corporates, improved compliance and enforcement resulting from sharing of GST data with the Central Board of Direct Taxes, higher taxes on fuel, and the sharp recovery in both exports and imports. | Table 3: Tax Revenue of Union Government | | | Q1
(₹ crore) | Growth in Q1:2021-22 | | 2019-20 | 2020-21 | 2021-22 | over 2020-21 | over 2019-20 | | Gross Tax Revenue | 4,00,421 | 2,69,686 | 5,31,606 | 97.1 | 32.8 | | Direct Tax | 1,69,898 | 1,18,910 | 2,51,418 | 111.4 | 48.0 | | of which: | | | | | | | Corporation Tax | 70,640 | 54,212 | 1,23,689 | 128.2 | 75.1 | | Income Tax | 96,927 | 62,123 | 1,22,692 | 97.5 | 26.6 | | Indirect Tax | 2,30,523 | 1,50,775 | 2,80,188 | 85.8 | 21.5 | | of which: | | | | | | | GST | 1,52,601 | 98,888 | 1,69,084 | 71.0 | 10.8 | | Excise | 36,951 | 35,347 | 67,907 | 92.1 | 83.8 | | Customs | 39,480 | 15,416 | 41,356 | 168.3 | 4.8 | | Source: Controller General of Accounts (CGA). |
GST collections for the month of July 2021 at ₹1.16 lakh crore, again surpassed the ₹1 lakh crore mark, indicating that the blip in June may have been transitory (Chart 22). In Q1:2021-22, there is also an improvement in the union government’s capital outlay by 41.1 per cent over a year ago, which bodes well for medium term growth prospects. The revenue expenditure to capital outlay (RECO), an indicator of the quality of expenditure, stood at 6.8 in Q1:2021-22 as against the budget estimate (BE) of 5.7. The revenue deficit to gross fiscal deficit (RD-GFD) ratio holds at 62 per cent as against the BE of 75.7 per cent (Chart 23) (Misra et al., 2021)20. As per the latest information available for 19 states, their capital outlay has expanded sharply during Q1:2021-22 as against a decline of 53.4 per cent in Q1:2020-21 (Chart 24). States account for more than 60 per cent of the general government’s capex. India’s merchandise exports stayed above US$ 30 billion for the fifth successive month in July 2021. Robust demand in partner countries for engineering goods, petroleum products and chemicals powered the export performance (Chart 25a and 25b). In fact, 22 out of 30 major commodity groups featured in this broad-based expansion. The cutting edge to the export effort is being provided by a few items, which together accounted for around 57.3 per cent of total exports through 2013-2020 (Chart 26a to 26d). The engineering goods segment has emerged as a bright spot, in particular.
During April-July 2021, India’s merchandise exports reached US$ 130.8 billion - around one-third of India’s total export target of US$ 400 billion set for 2021-22 (Chart 27). India’s merchandise imports have exceeded pre-pandemic levels, reflecting the recovering strength of economic activity (Chart 28a). Non-oil-non-gold imports have exceeded US$ 25 billion for eight months in a row, attesting to a revival of domestic demand being underway. Import growth has remained broad-based, with 18 out of 30 major commodity groups expanding vis-à-vis July 2019 levels (Chart 28b). Aggregate Supply The south-west monsoon is catching up with its normal levels. The cumulative rainfall from June 1 to August 13 is 7 per cent below the long period average (LPA) as against 2 per cent above the LPA a year ago. In line with the monsoon’s progress, sowing activity is gradually gaining pace. As on August 13, 2021, kharif acreage stood at 997.1 lakh hectares – 1.8 per cent below its level a year ago but 2.1 per cent above the normal acreage. Overall, around 93 per cent of sowing has already been accomplished, with sugarcane recording the highest acreage of 114.7 per cent of the normal. Acreage under tur – the main kharif pulse – has been higher by 5.2 per cent over a year ago. Other pulses and coarse cereals are yet to achieve normal levels (Chart 29).
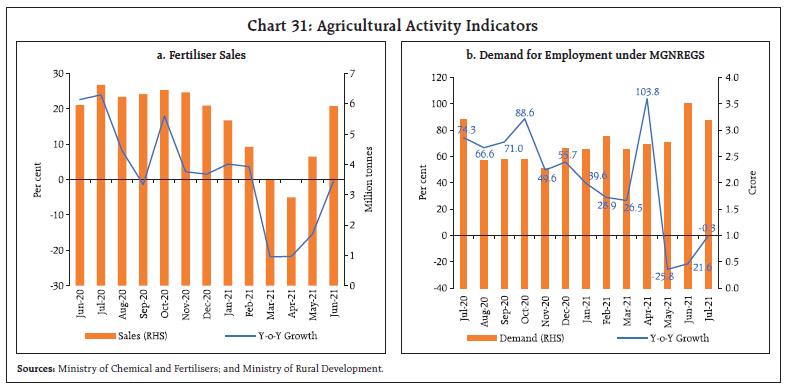
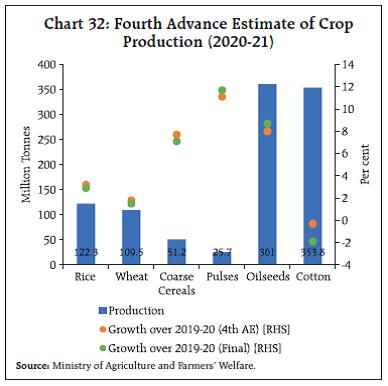
State-wise analysis shows that kharif sowing is on the verge of completion in the major producer states in northern and central parts of the country (Chart 30). The momentum of fertiliser sales in June and July remained strong (Chart 31a). The Ministry of Agriculture and Farmers’ Welfare has released the fourth Advance Estimates of agricultural crops production for the year 2020-21 on August 11, 2021 (Chart 32). 2020-21 marked the fifth consecutive year of record production of the foodgrains. This higher growth in production has stemmed from the record high acreages in anticipation of higher public procurement, adequate temporal as well as spatial rainfall distribution, ample supply of labour, increase in export demand and supportive policy measures to boost production and export. 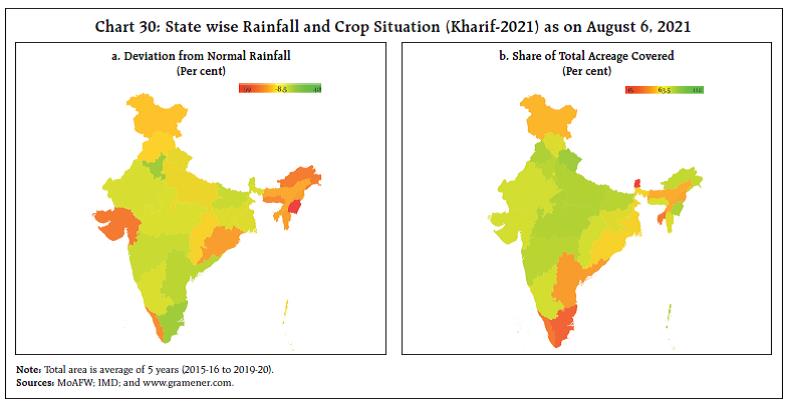
 A total of 41.8 lakh tonnes of cereals (rice and wheat) has been distributed to beneficiaries under the Pradhan Mantri Gareeb Kalyan Yojana (PMGKAY) 4.0 by August 9, 2021 out of the total allocation of 198.8 lakh tonnes. As of end-July, the stock position of cereals was comfortable (2.5 times the buffer norms) auguring well for the outlook on food security. Recent policy measures, namely, reduction in tariff value on import of edible oils by up to US$ 112/tonne, cutting down the customs duty on import of lentils from 30 per cent to 10 per cent and imposition of stocking norms on pulses are also aimed at venting domestic supply pressures. Reaffirming the traction that the economy is gaining, the headline PMI Manufacturing Index hit a 3-month high in July from the contraction it had entered in June after a gap of 11 months. All sub-indices exhibited expansion, with output and new orders recording a sharp rebound (Chart 33a). On the other hand, the services index contracted for the third consecutive month, but the contraction moderated to 45.4 in July from 41.2 a month ago (Chart 33b). Inflation On August 12, headline CPI inflation for the month of July 2021 came in at 5.6 per cent, down 70 bps from 6.3 per cent a month ago and reinforcing the view that the recent upsurge has peaked and the worst would be behind us (Chart 34a). Despite positive momentum (month-on-month change in prices in the current month) of around 70 bps that should have pushed up inflation, large favourable base effect (month-on-month change in prices a year ago) of close to 140 bps counterbalanced it and brought about the moderation in headline inflation in July. Among constituents, food and beverages inflation moderated to 4.5 per cent in July from 5.6 per cent in June, coming from a softening of inflation in oils and fats, fruits, pulses, prepared meals and spices along with a deepening of deflation in vegetables prices and sugar prices moving into deflation. On the other hand, inflation in meat, fish, eggs and milk picked up. Fuel inflation remained in double digits in July at 12.4 per cent, though it was a tad lower by around 20 bps from the historical high reading of 12.6 per cent in June. High inflation in LPG, kerosene, and firewood and chips kept overall fuel inflation elevated. CPI fuel and light (weight of 6.84 per cent in the CPI) contributed to around 14 per cent of headline inflation in July (Chart 34b). CPI inflation excluding food and fuel or core inflation softened by close to 30 bps to 5.8 per cent in July 2021 from 6.1 per cent in June, stemming from an easing of inflation in transportation and communication (mainly due to mobile telephone charges, bus fares and motor vehicles), personal care and effects (primarily on account of gold and silver), household goods and services (primarily on account of household services like domestic cook/servant) and education (primarily from tuition and other fees). On the other hand, inflation picked up in recreation and amusement (mainly due to television, computers and newspapers), pan, tobacco and intoxicants, clothing and footwear, and housing. High frequency food price data from the Ministry of Consumer Affairs, Food and Public Distribution (Department of Consumer Affairs) indicate an uptick in cereal prices in August so far (August 1-12, 2021). Prices of pulses, on the other hand, continue to soften. Edible oil prices are seeing some pressures. Among key vegetables, prices of potatoes, onions and tomatoes saw some seasonal increase in prices (Chart 35). 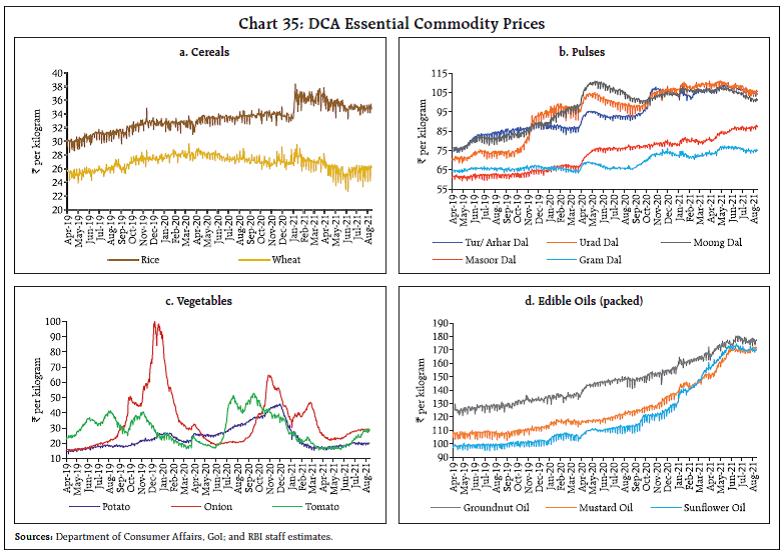
| Table 4: Petroleum Product Prices | | Item | Unit | Domestic Prices | Month-over-month
(per cent) | | Aug-20 | Jul-21 | Aug-21^ | Jul-21 | Aug-21 | | Petrol | ₹/litre | 83.80 | 102.81 | 103.56 | 4.5 | 0.7 | | Diesel | ₹/litre | 77.40 | 93.51 | 93.68 | 2.8 | 0.2 | | Kerosene (subsidised) | ₹/litre | 22.92 | 33.34 | 34.29 | 3.8 | 2.8 | | LPG (non-subsidised) | ₹/cylinder | 604.88 | 845.13 | 845.13 | 3.1 | 0.0 | ^: For the period August 1-12, 2021.
Note: Other than kerosene, prices represent the average Indian Oil Corporation Limited (IOCL) prices in four major metros (Delhi, Kolkata, Mumbai and Chennai). For kerosene, prices denote the average of the subsidized prices in Kolkata, Mumbai and Chennai.
Sources: IOCL; Petroleum Planning and Analysis Cell (PPAC); and RBI staff estimates. | Since around mid-July 2021 to August 12, 2021, pump prices have remained steady at ₹103.56 per litre (average of the pump prices in the four major metros) for petrol and ₹93.68 per litre for diesel. While kerosene prices registered an increase, LPG prices were kept unchanged in the first half of August (Table 4). Input costs, as reflected in the PMIs, increased further in July across manufacturing and services, but the rate of increase in costs remained modest. Selling prices for manufacturing and services registered increases in July though the extent of pass-through of input costs remained muted. The Reserve Bank’s in-house surveys on industrial, services and infrastructure outlook suggest that the elevated input cost pressures are likely to persist in Q2:2021-22. Firms expect to pass on the cost burden to the consumers in Q2 by increasing selling prices, especially for services and infrastructure. IV. Financial Conditions Persevering with its efforts to nurture market confidence, keep financial conditions benign, and bring down the cost of funds across the financial system, the Reserve Bank announced a number of measures for liquidity management. First, it commenced the secondary market G-sec acquisition programme version 2.0 (G-SAP 2.0) in July 2021, committing upfront to purchase G-secs worth ₹1,20,000 crore in Q2:2021-22, of which G-secs of ₹40,000 crore were acquired in two tranches of ₹20,000 crore each through auctions conducted on July 8 and 22, 2021. Two more auctions of ₹25,000 crore each were announced on August 6, of which one was conducted on August 12 and the other is scheduled for August 26, 2021. In order to steer the smooth evolution of the yield curve and ensure liquidity across the term structure, the Reserve Bank has purchased securities across the maturity spectrum up to 14 years with an emphasis on the maturity bucket of over 5 to 9 years (Table 5). Furthermore, in his monetary policy statement of August 6, Governor Shri Shaktikanta Das explained that options are always open to include both off the run and on the run securities in the G-SAP auctions and operation twist. The expectation, as he stated, is that “secondary market volumes would pick up and market participants [would] take positions that lead to two-way movements in yields”.21 Second, the Reserve Bank extended the on-tap targeted long term repo operation (TLTRO) scheme22 for specific pandemic-hit sectors by three months up to December 2021. Additionally, to provide comfort to banks on their liquidity requirements, including meeting the Liquidity Coverage Ratio (LCR), the Reserve Bank also extended the period of relaxation for banks by three months to avail of funds under the marginal standing facility (MSF) by dipping into the Statutory Liquidity Ratio (SLR) up to an additional one per cent of net demand and time liabilities (NDTL), i.e., cumulatively up to 3 per cent of NDTL. Table 5: Maturity Profile of Government Securities Purchased under G-SAP
(up to August 12, 2021) | Residual Maturity in August 2021
(Years) | Face value of G-sec purchased
(₹ crore) | Share in total purchase
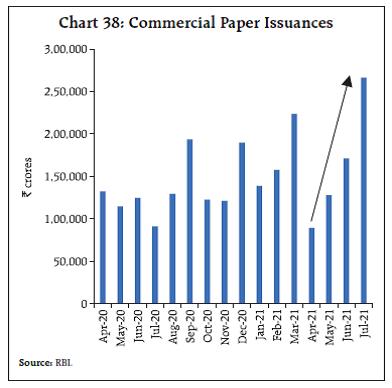
(Per cent) | | Up to 5 | 34,174 | 21.4 | | Over 5 to 10 | 1,05,792 | 66.3 | | Over 10 to 14 | 19,609 | 12.3 | | Total | 1,59,575* | | | *: Total purchases made under G-SAP amounted to ₹1,65,000 crore, which includes purchase of G-sec of ₹1,59,575 crore and SDLs of ₹5,425 crore on June 17, 2021. | Third, the amount under 14-day variable rate reverse repo (VRRR) auctions has been enhanced to ₹2.5 lakh crore on August 13, 2021; ₹3.0 lakh crore on August 27, 2021; ₹3.5 lakh crore on September 9, 2021; and ₹4.0 lakh crore on September 24, 2021. In response, a section of the media has sought to resurrect the ghosts of January 11, 2021 when markets misread the first announcement of a VRRR auction of ₹ 2 lakh crore as liquidity tightening. Those fears proved unfounded. This time around in certain sections, the VRRR time path has been linked to the upward adjustment in the inflation forecast and misconstrued as more than coincidence. We view them as distinctly separate and hence, issues around the inflation forecast are addressed in the concluding section; here, the rationale for the VRRR is set out. First, the suggestion for increasing the amount under VRRR auctions and for pre-announcing an evenly paced time path of progressive action came from market participants as part of pre-policy consultations. We believe that the request is justified from the point of view of participants who plan their liquidity operations well and seek a reward for time preference in the form of higher remuneration, as opposed to ‘idle’ banking which procrastinates in favour of parking lazily in the fixed rate reverse repo on an overnight basis. Second, the Reserve Bank has painstakingly emphasised that the VRRR auctions are an integral part of the system liquidity surplus. The choice of variable rate auction or fixed rate reverse repo is entirely with market participants. They can ab initio opt for the overnight fixed rate reverse repo or even if they have placed funds with the Reserve Bank for 14 days, they can withdraw at the end of the auction tenor and either park them at the fixed rate overnight window or deploy them in the market. Third, the notion of VRRRs being a liquidity withdrawal tool by stealth is absurd when the Reserve Bank is simultaneously committing to conduct GSAP and other liquidity injecting operations. At the end of September, out of the current overhang of liquidity of ₹ 8.5 lakh crore under the Liquidity Adjustment Facility (LAF), about ₹4.5 lakh crore will still get parked at the fixed rate overnight reverse repo window if it has not increased even further by then. Fourth, from March 2020, the Reserve Bank’s liquidity management operations have been kept in an auto-pilot mode, with only the marginal standing facility and the fixed rate reverse repo passively available. With containment measures being eased, workplaces returning to normalcy and financial market timings being restored, it is only apposite to regularise liquidity management operations - with the 14-day variable rate auction as its main instrument - so that they are in sync with the requirements of the economy. Buoyed by the Reserve Bank’s liquidity enhancing measures, the system remained awash with liquidity, with surpluses in the form of average daily net absorption under the LAF stepping up to ₹6.0 lakh crore during July and ₹7.6 lakh crore in August (up to August 12) from ₹4.9 lakh crore a month ago (Chart 36). Spurred by comfortable liquidity conditions, overnight money market rates – the weighted average call rate (WACR), the tri-party repo and the market repo rate – traded below the reverse repo rate by an average 15 bps, 18 bps and 14 bps, respectively, during mid-July to August 2021 (up to August 12). Term money market rates, including 3-month certificates of deposit (CD) rates, 3-month commercial paper [Non-Banking Financial companies (NBFC)] rates and the 3-month T-bill rate, traded slightly above the reverse repo rate (Chart 37). Favourable liquidity conditions have resulted in a large number of corporates taking recourse to the commercial paper (CP) market for raising funds even as bank credit remained muted. CP issuances surged by over 190 per cent y-o-y to ₹2.66 lakh crore in July 2021 from ₹1.71 lakh crore in June and ₹3.89 lakh crore in the first quarter. Cumulatively, CP issuances for April-July 2021 increased by 41.3 per cent to ₹6.55 lakh crore, from ₹4.64 lakh crore during April-July 2020 (Chart 38). 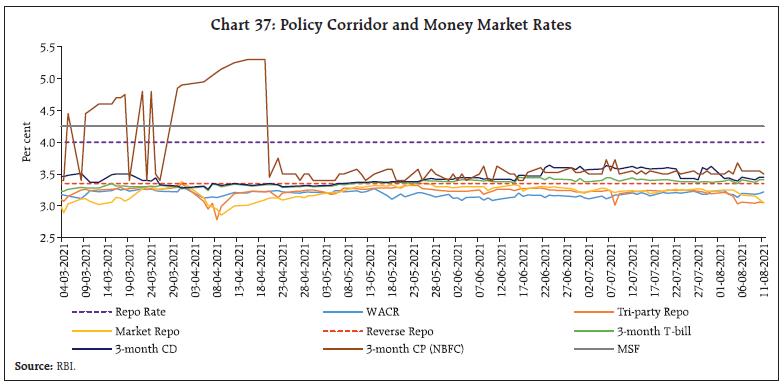
 In the July edition of this article, it was hoped that the confluence of policy guidance and market expectations embodied in the results of the primary auction of July 9 would endure and facilitate the orderly evolution of the yield curve over the rest of the year. Propitiously, conditions for this convergence also fell into place. First, fears of additional borrowing due to GST shortfalls were allayed. Second, the Reserve Bank resorted to uniform price auctions to assuage investor anxieties with regard to the winner’s curse in multiple price primary auctions. Third, GSAP and other operations were conducted to ensure adequate liquidity and its distribution all along the yield curve. Fourth, the June reading of the CPI that arrived on July 12 showed retail headline inflation levelling off, albeit at the elevated level of the preceding month, and what is noteworthy, core inflation fell by 40 basis points. In the secondary market, yields eased up to mid-July in sympathy with the decline in US treasury yields and softening of international crude prices. In the primary auctions of July 23 and August 6, however, the policy-market consensus broke down as market participants turned impervious to all the developments described earlier and bid over-bearishly, especially in respect of benchmark papers. The Reserve Bank has been painstakingly emphasising that it does not view g-sec yields as cast in stone but evolving in an orderly manner in alignment with underlying fundamentals. It has focused on the key role of the g-sec market in facilitating monetary transmission by establishing benchmarks for other financial market segments. This assumes significance when the credit channel is muted and waves of the pandemic threaten to destabilise financial markets and institutions. From mid-July, yields have hardened, with the 10-year benchmark (6.31 GS 2031) yield closing at 6.23 per cent on August 12, 2021 (Chart 39). Mirroring G-sec movements, corporate bond yields hardened and spreads widened across the rating spectrum and issuer categories during July and in the first half of August from a month ago (Table 6). The average spread of 3-year AAA rated corporate bonds over the G-sec yields of corresponding maturity issued by (i) public sector undertakings (PSUs), banks and financial institutions (FIs), (ii) corporates and (iii) NBFCs increased by 14 bps, 8 bps and 6 bps, respectively, in August (up to August 12). Reserve money (RM) excluding the first-round impact of the cash reserve ratio (CRR) restoration, actually slackened in relation to the surge that was recorded a year ago (Chart 40). Currency in circulation - the largest component of RM - grew at 10.0 per cent (22.4 per cent a year ago), which is the slowest pace of currency demand recorded since November 2017. Deposit mobilisation remains resilient after the seasonal slack in the first quarter; however, scheduled commercial banks’ (SCBs) credit to the commercial sector still lags substantially behind. The transmission of policy rate changes to lending and deposit rates of SCBs has improved considerably since March 2020 on account of enduring surplus liquidity conditions and external benchmark-based pricing. The 1-year median marginal cost of funds-based lending rate (MCLR) softened by 100 bps cumulatively during March 2020 to July 2021. During the same period, the median term deposit rate (on fresh deposits) moderated by 150 bps across all tenors (Chart 41a), with the decline being pronounced in deposits of maturity of up to one year (178 bps) (Chart 41b). Private banks have reduced term deposit rates more than public sector banks (PSBs).
Indian equity markets traded range-bound, with the BSE Sensex recording a modest gain of 0.2 per cent during July 2021 to close the month at 52,587 (Chart 42). While flows from FPIs into the equity market were negative in July, mutual funds made net purchases of ₹19,716 crore during the month. Domestic equities commenced August 2021 on a positive note, buoyed by recovery in auto sales, robust GST collections and the rise in India’s manufacturing PMI for the month of July 2021. Having increased by 5.4 per cent during August 2021 so far, the BSE Sensex closed at a lifetime high of 55,437 on August 13, 2021.
Foreign direct investment (FDI) inflows have stayed robust in 2021-22 so far (Chart 43). Cumulatively, net FDI increased to US$ 11.4 billion in April-June 2021 from US$ (-)0.5 billion a year ago (US$ 14.0 billion in April-June 2019). Foreign portfolio investors (FPIs) turned net sellers in the equity market in July 2021, after being net buyers in the preceding two months, on concerns over the ‘Delta’ variant and rising oil prices. Net FPI outflows of the tune of US$ 1.1 billion occurred in July 2021 (Chart 44). FPIs sold equities in other major EMEs as well. In August (up to 11th), FPIs were net buyers in Indian and other major EME equity markets. Foreign exchange reserves reached an all-time high of US$ 621.5 billion on August 6, 2021, equivalent to less than 15 months of imports projected for 2021-22 (Chart 45).
In the foreign exchange market, the Indian rupee (INR) depreciated against the US dollar in July 2021 with rising crude oil prices and the FPI sell-off during the month. However, the INR has appreciated against the US dollar in August (up to 12). In terms of the 40-currency real effective exchange rate (REER) index, INR depreciated by 0.1 per cent in July 2021 over its level in June 2021 due to moderation in domestic inflation and concomitant decline in relative price effect, and depreciation of INR in nominal terms (Charts 46a & 46b). PAYMENT SYSTEMS Transactions across all digital payment modes demonstrated growth (y-o-y) in July. Real Time Gross Settlement (RTGS) payments posted robust growth in both value and volume terms, reflecting an uptick in business activity. On the retail side, transaction volumes exhibited a rising momentum across the Unified Payments Interface (UPI), the Immediate Payment Service (IMPS) and the National Electronic Toll Collection (NETC), Rapid formalisation and digitisation of the economy was also evident from the Reserve Bank’s Digital Payments Index (DPI)23 (Chart 47). The Reserve Bank decided to extend membership in the Centralised Payment Systems (RTGS and NEFT) to authorised non-bank Payment Service Providers (PSPs), viz., Prepaid Payment Instrument (PPI) issuers, Card Networks and White Label ATM operators. This is expected to bring in efficiencies in payments and settlements, reduce transaction failures and boost public confidence in digital payments. The Government of India and the National Payments Corporation of India (NPCI) have launched the ‘e-RUPI’ - a one-time QR code/SMS string-based payment mechanism - on August 2, 2021. It is designed as a pre-paid e-voucher, which can be delivered to the beneficiary’s mobile, and can be redeemed without the requirement of a card, digital payment app or internet banking access. It is a person/purpose - specific digital payment solution, which is expected to make direct benefit transfers (DBT) more effective.
V. Conclusion Sravana 2021 is also a time of the year when the Reserve Bank connects with the transcendental calm within. Submersed in this inner stillness, it looked beyond the dilemmas and trade-offs in the here and now to contemplate the world of tomorrow. Against the backdrop of widespread anxiety about the safety of and access to deposits with troubled banks, the recent enactment of amendments to the Deposit Insurance and Credit Guarantee Corporation (DICGC) Act is a major step towards ameliorating depositor distress. Henceforth, when a bank faces stress, its depositors will be able to get back their deposits up to ₹5 lakh (up to which deposits are insured by the DICGC) within 90 days. This is a significant change. It enhances the mandate of the DICGC from a limited pay-box function to pay-box plus one which will boost public confidence in the banking system. This augurs well for consumer protection and overall financial stability. Taking stock of the work in progress towards a central bank digital currency (CBDC) - a fiat liability denominated in the national unit of account that is digitally issued and accessible to all economic agents – there is a quiet confidence within that its time is nigh24. The CBDC is a part of the Reserve Bank’s endeavour to provide a safe, secure and reliable payments and financial system, which will also exploit the country’s pole position in the domain of digital payments worldwide. The CBDC may not directly replace demand deposits held in banks and will complement physical cash. It would compete with other online and offline payment methods and thereby support a more resilient and diverse payment system while shunning the risks associated with private digital currencies. The Reserve Bank is conscious that the CBDC has to be meticulously planned, designed and tested. Going forward, CBDCs could form the backbone of a highly efficient new digital payment system, enabling broad access and providing strong data governance and privacy standards, and safeguarding the payment system against illicit activities. The UK Financial Conduct Authority’s announcement of March 5, 2021 about the sunset of the London Interbank Offered Rate (LIBOR), the most widely used benchmark in the history of financial markets is widely regarded as a watershed without parallel25. The Reserve Bank has been monitoring global developments related to this transition and has tasked the Indian Banks’ Association (IBA) to work out a transition plan. Banks have to engage in: (i) development of alternate reference rate(s) to replace MIFOR; (ii) development of fallback clauses that are customised to the Indian market but based on practices adopted globally; (iii) promoting stakeholder awareness to deal with contract renegotiation; and (iv) notifying a cut-off date closer to the LIBOR cessation date beyond which institutions should cease to enter into new contracts that make reference to LIBOR. On June 8, 2021, the Reserve Bank advised banks and other regulated entities to cease entering into new contracts that use LIBOR as a reference rate and instead adopt any Alternative Reference Rate (ARR) as soon as practicable and in any event by not later than December 31, 2021. On August 6, the Reserve Bank decided to allow banks to extend export credit using any other widely accepted ARR. It also indicated that in the case of derivative contracts, a change in the reference rate will not be treated as restructuring. With the growing intensity and reach of the Reserve Bank’s delivery of its supervisory function, the focus of the Reserve Bank’s new approach to ‘continuous supervision’ is on early identification of risks and conduct of supervisory actions, helping supervised entities to strengthen their internal defences and resilience, and bringing focus on root cause analysis. With continuous engagement and more frequent reviews of risk profiles and supervisory assessments being envisaged, PRISM26, a web-based and an end-to-end workflow automation system, is expected to strengthen compliance by supervised entities (SEs). PRISM will have various functionalities (inspection; compliance; incident functionality for cyber security; complaints; and returns functionalities), with built-in remediation workflows, time tracking, notifications and alerts, management information system (MIS) reports and dashboards. In closing, we turn to what was arguably a challenging meeting of the monetary policy committee (MPC) held during August 4-6, 2021. Against the backdrop of inflation plateauing in June, albeit at elevated levels outside the tolerance band and the economy weakened by two waves of the pandemic, the MPC voted unanimously to keep the policy interest rate unchanged and by a 5/1 majority to maintain the accommodative stance it articulated in its previous meeting. It was perhaps the most widely anticipated MPC meeting outcome and yet, some dust was stirred and some misgivings. In terms of best practices in central banking, a high level of monetary policy predictability is considered desirable. Predictability has come to be closely related to the credibility of the central bank. In fact, over the last few decades, central banks have progressively increased their emphasis on the transparency and predictability of their actions, recognising the need for greater accountability in the form of objective and systematic behaviour that hones the ability of the public to anticipate monetary policy decisions correctly and understand the monetary policy framework. Transparency is, on its own, insufficient to ensure a lasting impact on the formation of expectations; guiding expectations requires not only forward-looking communication, but also consistency between words and deeds. This is what the MPC has sought to achieve in its forward guidance. The stance of monetary policy shifted from neutrality to accommodation in June 2019 in anticipation of the slowdown in activity getting more pronounced – real GDP growth moderated from 8.3 per cent in 2016-17 to an average of 6.7 per cent in 2017-19 and fell to 4 per cent in 2019-20. In October 2019, the MPC made its forward guidance more explicit. It decided “to continue with an accommodative stance as long as it is necessary to revive growth, while ensuring that inflation remains within the target.”27 All through it has abided by this guidance in deeds and words, augmenting it (a) in March 2020 to “mitigate the impact of coronavirus (COVID-19) on the economy”28 when the pandemic struck, (b) in October 2020 to bring in time-contingent accommodation guidance – “at least during the current financial year and into the next financial year”29, (c) in April 2021 to “continue to mitigate the impact of COVID-19 on the economy”30 as the second wave of the pandemic intensified, and (d) in June 2021 to commit to “revive and sustain”31 growth on a durable basis. The MPC’s decision is backed with all available evidence – mobility-, activity- and survey-based. Yet it is, in the ultimate analysis, a judgment call because at the heart of the association between growth and inflation, a sacrifice is embedded. A reduction in the rate of inflation can only be achieved by a reduction in growth; an increase in growth is only possible by paying the price of an increase in inflation, always and everywhere. Called the sacrifice ratio in economics, the latest estimates for India suggest that for a one percentage point reduction in the rate of inflation, 1.5-2 percentage points of GDP growth has to be foregone. The MPC voted to give growth a chance to claw its way back into the sunlight. After all, growth had fallen in 2019-20 to its lowest rate in the 2011-12 based GDP series and after two waves of the pandemic in 2020-21 and the first half of 2021-22, it couldn’t conceivably be higher than in 2019-20! But what if the MPC doggedly attacks the supply shock induced price pressures in spite of the current state of the pandemic-ravaged economy and as a consequence, economic activity wilts into depression? No amount of humility will wipe away the tears then. Also, our MPC is India-focused; it has to be. It must choose what is right for India, emulating none, not emerging nor advanced peer. In the process, has monetary policy forsaken its dharma, its primary mandate of price stability? Let the facts speak. Given the knife-edge trade-off imposed by the sacrifice ratio, the conduct of monetary policy has converged to a glidepath of graduated disinflation that spreads the inherent output losses over a period rather than a ‘cold turkey’ approach that applies the sledge hammer but causes large GDP losses which kill the nascent recovery and set back the Indian economy by several years due to precipitate policy action. The MPC demonstrated its commitment and ability to anchor inflation expectations around the target of 4 per cent during 2016-20. The once-in-a-century pandemic ratcheted up inflation all over the world and India was not immune. The MPC had to tolerate higher average inflation in 2020-21. For the year 2021-22, inflation is expected to average 5.7 per cent, which is a decline of 50 basis points from the preceding year’s average in spite of still being in the midst of the pandemic’s second wave. Furthermore, it needs to be kept in mind that the upward revision in the inflation forecast from 5.1 per cent in June to 5.7 per cent in August is essentially a correction for the deviation of the past – as against the projection of 5.2 per cent for inflation in April-June, the actual outcome turned out to be 5.6 per cent due to incomplete coverage and intensification of containment measures. So far, inflation is on track to staying within the trajectory envisaged and it is likely to stabilise during the rest of the year. In our view, this is a credible forward-looking mission statement for the path of inflation.
Annex Box: Results of Periodic Labour Force Survey During the period covered by the MoSPI’s Periodic Labour Force Survey (PLFS), the unemployment rate fell from 5.8 per cent in 2018-19 to 4.8 per cent in 2019-20 with sharper fall in rural areas32. The labour force participation rate (LFPR) also improved during this period with improvement in both rural and urban areas (Table 1). The labour market structure, which shifted towards services during the last survey round, saw a reversal in 2019-20. Across the sectors, there was a decline in the share of employment while agriculture increased its share to become the major employment provider in 2019-20 (Table 2). In rural areas, the share of self-employed in agriculture also increased during this period. This shift in employment towards agriculture partly reflects the impact of the first wave of the pandemic when there was an exodus of migrant workers back to the villages. The decline in employment during the first wave of Covid-19 is also reflected in urban areas for which information is also available up to July-September 2020. After a significant decline in employment and LFPR during Q1: 2020-21, Q2 registered an improvement in labour market indicators. The brunt of the pandemic was felt mostly by casual workers whose share in employment declined by 50 per cent in Q1 2020-21. With the easing of restrictions, employment in this category came back to near normalcy in Q2 2020-21. However, compared to 2019-20, the recovery in the labour market is still not complete (Table 3). | Table 1: Labour Market Indicators | | in per cent | | Survey period | Unemployment rate | Labour participation rate | | | Rural | | PLFS 2019-20 | 4 | 40.8 | | PLFS 2018-19 | 5 | 37.7 | | PLFS 2017-18 | 5.3 | 37.0 | | | Urban | | PLFS 2019-20 | 7.0 | 38.6 | | PLFS 2018-19 | 7.7 | 36.9 | | PLFS 2017-18 | 7.8 | 36.8 | | | Rural+Urban | | PLFS 2019-20 | 4.8 | 40.1 | | PLFS 2018-19 | 5.8 | 37.5 | | PLFS 2017-18 | 6.1 | 36.9 |
| Table 2: Worker Division by Industry (Rural+Urban) | | in per cent | | Industry division (as per NIC) | PLFS 2019-20 | PLFS 2018-19 | PLFS 2017-18 | | Agriculture | 45.6 | 42.5 | 44.1 | | Mining & quarrying | 0.3 | 0.4 | 0.4 | | Manufacturing | 11.2 | 12.1 | 12.1 | | Electricity, water etc. | 0.6 | 0.6 | 0.6 | | Construction | 11.6 | 12.1 | 11.7 | | Trade, hotel & restaurant | 13.2 | 12.6 | 12.0 | | Transport, storage & communications | 5.6 | 5.9 | 5.9 | | Other services | 11.9 | 13.8 | 13.2 | | Services Sector | 42.3 | 44.4 | 42.8 | | All | 100.0 | 100.0 | 100.0 | | Source: MoSPI. |
Table 3: Quarterly Labour Market Indicators-Urban
(Persons-All Ages) | | (in per cent) | | Quarter | Labour Force Participation Rate | Worker Population Rate | Unemployment Rate | | April-June 2019 | 36.2 | 32.9 | 8.9 | | July - September 2019 | 36.8 | 33.7 | 8.4 | | April - June 2020 | 35.9 | 28.4 | 20.9 | | July - September 2020 | 37.0 | 32.1 | 13.3 | | Source: MoSPI. | |
|