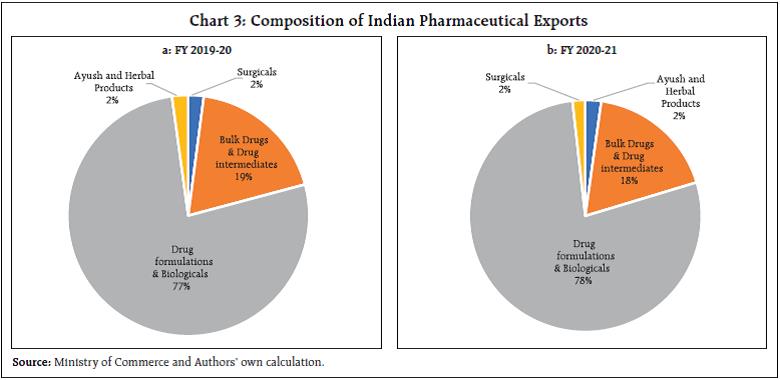
This article examines the determinants of India’s pharmaceutical exports in the context of the post-COVID scenario. Empirical results using panel data estimation of 42 pharmaceutical firms over the period 2007 to 2019 suggests that import intensity and research and development (R&D) expenditure are the two key determinants of export intensity. A strategy to diversify sources of imported inputs and incentivising R&D expenditure may be necessary to boost India’s exports competitiveness further. I. Introduction India ranks third worldwide for pharmaceutical production by volume and fourteenth by value (IBEF, 2021). The Indian pharmaceutical sector contributes about 2 per cent to India’s GDP and around 8 per cent to the country’s total merchandise exports. The sector has exhibited resilience to many economic shocks, and this can be substantiated by India’s more than 18 per cent growth in exports of pharmaceuticals during 2020-21, a pandemic hit year, when global output and trade contracted. Even during the global 2008 recession, the Asian pharmaceutical market was the least affected, with the Indian counterpart having negligible impact (Bhatt and Panigrahi 2014). The Ministry of Commerce had reported that Drugs and Pharmaceuticals is one of the only two commodity groups which registered a positive growth in April 2020 vis-à-vis April 2019. The trade surplus of India in June 2020 was also primarily driven by the robust performance of pharmaceutical exports. The global pandemic being both a medical and an economic shock, entails wide-ranging implications compared with any other economic shock, particularly in the context of the recent rise in both the price and share of imports by this sector from China and a changing political landscape. During the 1918 Spanish flu episode, some of the peculiarities of the industry had come to the forefront. Many untested remedies helped generate short-term profit for some firms, and the scope for using a pandemic to their own financial advantage by patent medicine firms was soon noted. The gains irrespective of patent rights, however, often proved to be transient, as in the case of Aspirin during the Spanish flu, which was ceased from usage after incidents of aspirin poisoning surfaced (History.com Editors, 2020). The current pandemic presents a major opportunity for the Indian drug industry to display its credentials in manufacturing and testing of vaccines and strengthen its reputation. Instances of this include the Serum Institute of India (SII), the world’s largest producer of vaccine by volume. The SII successfully launched the indigenously developed intra-nasal vaccine, Nasovac for the prevention of H1N1 infections and also collaborated as a manufacturing partner for the Oxford-AstraZeneca COVID-19 vaccine. Although such opportunities of collaboration apparently seem to benefit the sector, it’s substitutability with R&D efforts might potentially challenge the sustainability of the sector. Another pertinent issue relates to the nature of the global value chain, particularly the global dependence on China for pharmaceutical intermediary inputs. The Indian Drug regulatory authority had recently highlighted how 57 active pharmaceutical ingredients (API’s) of antibiotics, vitamins and steroids could go out of stock if there’s a prolonged shutdown in China1. Against this background, the aim of article is to examine the idiosyncrasies of the Indian Pharmaceutical Industry’s changing dynamics over the last two decades and the role of exogenous parameters that continue to affect the performance of the sector. More specifically, the export market is analysed to explore opportunities for enhancing India’s pharmaceutical exports. The rest of the paper is organised into five sections. The second section presents a brief survey of the literature, and the third section presents some stylised facts. The fourth section discusses data sources and the methodology used for the empirical analysis, and the fifth section offers an analysis of the empirical findings. The concluding section provides some policy perspectives. II. Survey of Literature After the replacement of the process patent regime, the generic producers of the industry faced many challenges as it increased patent terms in compliance with the “The Agreement of Trade-Related Aspects of Intellectual Property Rights” (TRIPS) agreement. India does not allow patents on minor modification of existing products, thus preventing their evergreening. Furthermore, the country requires compulsory licensing if the patent does not work in India or the resulting product has exorbitant prices (Dhar and Joseph, 2019). Along with the favourable policies in accordance with the World Trade Organisation (WTO) regime, it is also argued that in order to widen the export market, the industry should adopt strategies to collaborate with multinationals not only in R&D manufacturing but also in marketing new patented products and improving the standards of production. The argument is borne out on the lines of specialisation of the Indian industry and is strengthened by the fact that a substantial percentage of the turnover of Indian companies is spent on improving the marketing networks (Lalitha, 2002). In terms of firm-specific advantages, the R&D efforts are considered as one of the prime factors, and in this context, R&D efforts involved in any modification in the process technology is more relevant than the introduction of new products. On the other front, generics which are relatively less intensive in R&D can complement the sales value along with patented drugs by Multi-National Corporations (MNCs) in the pharma export basket, and government incentives are argued for in this context. Achieving this complementarity requires provision of correct incentives and a reiteration of R&D expenditure (Aggarwal, 2004). Furthermore, although strategic government policies were the main factors responsible for transformation of the Indian industry from an importer of drugs to an innovation driven cost-effective producer and distributor of quality drugs, the limitations of low productivity and low R&D intensity continue (Pradhan, 2006). After the pandemic, while falling disposable incomes due to an economic shock might adversely affect the industry, it can have a favourable impact on generics sales since lower incomes may induce patients to purchase more generic drugs (Mishuk, et al., 2018). However, it is necessary to understand the channels through which the external effects can be transmitted into the core of the very industry to reduce the severity of impact from any such shocks. III. Stylised Facts Indian pharmaceutical sector contributed around 2 per cent to India’s GDP (Department of Pharmaceuticals, 2019). Apart from this, the allied fields of pharmaceuticals such as healthcare, medical technology and biotechnology, generate massive employment across the country. The pharmaceutical export market turnover was US$24.4 billion in 2020-21, witnessing an 18.1 per cent (y-o-y) growth. India’s domestic pharmaceutical market is estimated at US $41 billion in 2021 and likely to grow to US$65 billion by 2024 and further expected to reach US$130 billion by 20302 (Chart 1). Both the export and domestic markets thus stand equally important for this sector. III.A. India as the Pharmacy of the World Pharmaceuticals exports from India stood at US$ 20.7 billion in FY20 and reached US$ 24.4 billion in FY21. The Compound annual growth rate (CAGR) of the exports was around 9 per cent from 2008-09 to 2020-21 (Chart 2a and 2b). In spite of the high growth, India’s current global market share by value at about 1.5 per cent is insignificant relative to the US, which has approximately 40 per cent of the global market share. However, in terms of volume, India stands at the third position, accounting for nearly 10 per cent of global production. This is an indication of the low prices of Indian pharmaceutical products. India’s composition of pharma exports reveals that approximately 70 per cent is in the form of drug formulations and biological and about 20 per cent constitutes bulk drugs and drug intermediaries (Chart 3a and 3b). This not only facilitates production processes across the world, but also contributes to the supply of final products in the form of generics. In 2001 when prohibitive prices of patented HIV drugs had led the disease to assume endemic proportions, Cipla had brought down the cost of the drug to US$ 400, which was one twenty-fifth of what was being charged earlier. Several other Indian generic drug companies followed this, leading to an 18-fold increase in the number of people who could be treated for AIDS between 2003 and 2009. Generic versions of many such drugs have enabled a larger market share for the country and ensured that regions such as Africa with a high incidence of diseases and low incomes had access to low-cost medications. 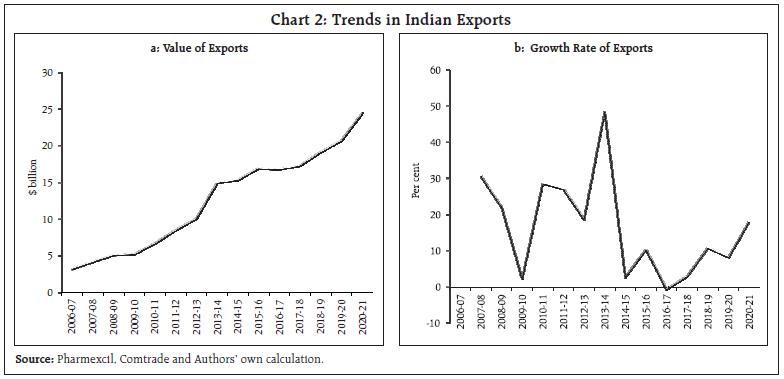
 III.B. High Active Pharmaceutical Ingredients (APIs) Dependency The focus on finished formulations in the last two decades had resulted in negligence of in-house manufacture of APIs. This led to an increased reliance on China in particular, with estimates of API imports reaching as high as 85 per cent3. According to the Boston Consulting Group (BCG) and Confederation of Indian Industry (CII) Report, the major medications for which APIs originate from China include painkillers like paracetamol; anti-infectives like Amoxicillin, first-line antidiabetics like Metformin and anti-ulceratives like Ranitidine. The report points that these are no local manufacturers for various medications like Penicillin-G and its derivatives 6-Aminopenicillanic Acid, making our country dependent on import of key starting materials (KSMs) used in essential antibiotics. More than 75 per cent of India’s KSMs import originate from China (Joshi, 2018). The upsurge in imports from China point towards China’s large capacities (which are built up by the government and managed by private industry) and India’s liberal approach in approving registrations for Chinese products4 (Patel, 2018). III.C. Characterisation of the sector’s R&D Expenditure Post TRIPS, India as a whole has seen an increase in the R&D expenditure, but it is still considerably below that of other developed economies. Calculation of return to research capital5 for the top five Indian firms by profits in 2018 and that of top 5 firms of the global industry has yielded a higher value for the Indian firms, which might indicate that previous year’s return on research is more in the case of India (Table 1). Since the initiation of drug discovery by major companies in the 1990s, out of 200 preclinical trials and clinical-stage development of compounds, only one has reached the market so far (Differding, 2017). India witnesses a high number of enrollments in Chemistry and Biology, but there is a persistent disparity between the number of fine chemists and biologists. | Table 1: Return on Research Capital (RORC) | | RORC of top 5 global firms by profit | RORC of top 5 Indian firms by profit | | Company Name | Gross profits ($ billion) | R&D expenses ($ billion) | RORC | Company Name | Gross profits (Rs. Million) | R&D expenses (Rs. Million) | RORC | | Pfizer | 42.399 | 7.683 | 5.518 | Cipla Ltd. | 129743.8 | 8642.2 | 15.012 | | Novartis | 31.589 | 9.000 | 3.509 | Aurobindo | 124571.1 | 5895.1 | 21.131 | | Merk | 28.785 | 10.208 | 2.819 | Dr.Reddy's | 108990.0 | 14707.0 | 7.410 | | Glaxosmithkline | 25.787 | 5.609 | 4.597 | Cadila | 71098.0 | 6381.0 | 11.142 | | Roche | 23.940 | 11.755 | 2.036 | Alkem | 57816.7 | 3142.5 | 18.398 | | Source: CMIE database, author’s calculations. | III.D. The US FDA approved manufacturing firms. The US food and Drug Administration (USFDA) had started inspections of clinical development sites in India in 2005. As of 2020, India had more than 100 US FDA approved manufacturing sites, which surpasses any other country outside the US (PwC 2020). Consequently, several poor manufacturing practices of the industry came to the forefront, which initially affected many firms adversely but over time led to adoption of better measures which helped the sector to penetrate many markets and achieve global credibility. In this regard, indications of the global importance of the Indian sector also came to the forefront when due to supply chain disruptions causing drug shortages during the pandemic, India got clearance of four drug majors and several Indian companies were also included in FDA’s first time generic drug approval list for 2020 (The Pharma Letter, 2020). III.E. The importance of joint ventures in the Indian pharmaceutical industry With the pharmaceutical business models witnessing a paradigm shift from a fully integrated company structure towards establishing networks, Indian companies are likely to play an increasingly important partnering role (PwC, 2020). While foreign firms are incentivised by India’s cost advantage in the industry, domestic firms find it an opportunity to compensate for the industry’s low levels of innovation. With TRIPS agreement in place and absence of investment to develop innovative products, such partnerships have led the MNCs in India to turn towards contract manufacturing and research services (CRAMS), marketing alliances, collaborative research and clinical trials and formation of licensing agreements with foreign firms to bring novel medications to the country at reasonable prices (Chokkakula and Kolapalli, 2018). Significant rises in the number of joint ventures, alliances and mergers and acquisition in the industry has helped the Indian companies to gain a foothold in the western regulated markets, diversify their portfolios and gain R&D capabilities and in all to increase the export competitiveness of the country (Mishra and Jaiswal, 2012). IV. Data Source and Methodology To examine the impact of various factors that can potentially influence the exports of the pharmaceutical industry; a balanced panel dataset of 42 Indian pharmaceutical firms is used for a period of 13 years from 2007 to 2019. The selection of the firms was conditioned by the availability of data but the firms under consideration account for a majority (nearly 68 percent) of sales revenue in 2019. The data of the firms is sourced from Prowess IQ of CMIE database. The panel estimation methodology follows the underlying equation: 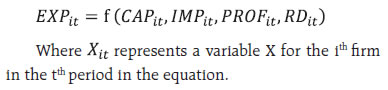 The dependant variable (EXP) is the value of exports of firms divided by their respective total sales. This variable has often been interpreted as export competitiveness or export intensity of the firms. The variation in the dependant variable is explained by capital intensity (CAP), import intensity (IMP), profitability (PROF) and the research and development intensity (R&D). Here intensity of a variable is calculated by taking the ratio of the variable with respect to the sales of the firm in the corresponding time period. In the present paper, instead of using annual values, a three year moving average of the variables is considered to make the dataset more consistent over the period of time. This can account for the process of adjustment along with a reduction of the potential simultaneity bias in the envisaged relationship (Mishra and Jaiswal, 2012). The above equation is estimated by using panel data techniques. Four models, namely the pooled regression model, fixed effect model, first differencing model and random-effects model are estimated. The pooled effect model assumes that the intercept and slope coefficients are the same for all 42 firms, thus implicitly assuming that there is no distinction among the firms. To prevent such camouflaging, further models are explored. In the random-effects model, the intercept of an individual is assumed to be a random drawing from a much larger population with a constant mean value and the individual intercept is expressed as a deviation from the mean (Gujarati, Porter and Gunasekhar, 2015). The first differencing method can also be used as a different procedure to estimate the coefficients. The possibility that idiosyncratic errors may be serially uncorrelated is too strong in our dataset, and thus alternatively, it can be assumed that the first difference of the idiosyncratic errors are serially uncorrelated. This challenges the efficiency of the fixed-effect model since it is asymptotically efficient under homoscedasticity and no serial autocorrelation. Under such circumstances, there arises a possibility that the first differencing estimator might be more efficient (Wooldridge, 2002). To compare between the first difference and fixed-effect models, we can note R2 values of the two models (Nwakuya and Blue, 2019). To determine the suitability of the models, three main tests are carried out. To choose between the pooled and the fixed effect model, a restricted F-test is carried out. On the other hand, a Lagrange multiplier test is carried out to choose between the pooled and the random-effects model (Breusch and Pagan, 1980). Finally, if both the fixed effects and random effects model are selected over the pooled model, the Hausman test is applied to choose the appropriate model (Hausman, 1978). In the dataset, since the cross-sectional observations are more as compared to the time series components, the individual coefficients are calculated using robust standard errors to control for heteroscedasticity. V. Results and Analysis The four models have been estimated, and the results have been presented in Table 2. In the pooled model, except for profitability, all the coefficients have turned out to be significant. This implies that if all firms are assumed to be homogenous in nature, a higher ratio of imports and research and development to sales would imply a uniformly higher export intensity for each of the firms. Simultaneously a higher capital to sales ratio would lower the export intensity. Among the four variables, the high coefficient of R&D implies that under this homogenous firm setup, the industry can increase its export intensity if the R&D expenditures as a whole is increased by some major pharmaceutical companies with positive externality effects across the sector, or simply by voluntary collaboration among firms. After the tests were conducted, both the fixed effect and random effect models turned out to be more suitable than the pooled model, implying that the assumption of homogeneity among firms did not hold. Between the fixed effect and the random effect model, the test results asserted the fixed effect model to be more suitable. While comparing the fixed-effect model and first difference model, it is noted that the adjusted R2 value increased substantially from 0.32 to 0.48 as we moved from the fixed effect to the first differencing model and therefore one could choose the first differencing model on this basis. | Table 2: Estimation of the models | | Dependent Variable (EXP) | | Variables | Pooled model | Fixed effect model | Random effects model | First Difference model | | CAP | -0.123*** (0.020) | -0.085*** (0.014) | -0.087*** (0.014) | -0.135*** (0.020) | | IMP | 0.412*** (0.044) | 0.511*** (0.033) | 0.503*** (0.033) | 0.684*** (0.035) | | PROF | 0.019 (0.030) | 0.113*** (0.033) | 0.101*** (0.031) | 0.104*** (0.036) | | R&D | 0.877*** (0.157) | 0.135 (0.127) | 0.190 (0.125) | 0.345** (0.160) | | R2 | 0.23 | 0.37 | 0.35 | 0.49 | | Note: Figures in parentheses are standard errors; ***: significant at 1 per cent; **: significant at 5 per cent. | In both models, i.e. the fixed effect and the first differencing, the coefficient of CAP turned out to be negative, thus suggesting that the higher capital intensive a firm is, the lower may be its export intensity. This effect was also observed when the Indian manufacturing sector as a whole was studied (Mishra and Jaiswal, 2012). In case of the pharmaceutical industry, it had been noted that working capital management skills seem intrinsically superior compared to skills in utilising physical assets (Majumdar, 1994) and an association of higher exports with lower working capital intensity might reflect the same. Profitability, PROF has a significant positive effect on exports, supporting our earlier observation that higher profitability is associated with firms having more exports. The import intensity (IMP) turned out to be positive and significant, with its coefficient higher than R&D in both models. Larger imports of raw materials seem to improve export performance. This can be explained by the price and quality competitiveness of pharmaceutical exports (Bhaduri and Ray, 2004). The affinity to import higher-quality imports for export purposes may be driven by the need to comply with the stringencies of various regulatory agencies like USFDA to penetrate sensitive markets. In terms of price competitiveness, it can be noted that cheaper imports of intermediaries from China help the industry to maintain lower prices in the export market. The high dependency of the sector for imports has been noted in,Section 3.B., which is empirically confirmed by the regression result. The coefficient of R&D is positive and significant at 5 per cent in the first differencing model, whereas it is insignificant in the fixed-effect model. Its magnitude is noted to be far lower than the coefficient of IMP. This seems counter-intuitive for an industry which has been recognised to be highly research and development intensive. Following the results, it seems that most of the variations in export intensity is explained by imports. This implies that the industry has become more dependent on imports rather than research and development. In Section 3.E, we had seen that after the TRIPS agreement, when the process patent regime was replaced, the sector has been evidently relying on joint ventures with foreign firms and universities for their research and development capabilities. This might undermine the importance of research and development in the Indian industry and can explain the composition of India’s large export of generics. This proposition is fuelled by the fact that in the wake of the pandemic, the world collaboration with Indian firms primarily stand on the basis of manufacturing and not on R&D as in the case of the SII which is the manufacturing partner for the Oxford-AstraZeneca vaccine for COVID-19 and Indian Immunologicals which has collaborated with Griffith University. The analysis strengthens the argument that the Indian pharmaceutical industry is driven more by a value addition model rather than an innovation-driven setup. VI. Conclusion The pandemic has perhaps been the greatest stress test for the pharmaceutical industry in the current century. As the third-largest producer of pharmaceutical products in the world, India has received global attention with expectations to meet global demand for vaccines at a low cost. The high import dependency and surprisingly low R&D intensity of exports in the Indian pharmaceutical sector call for timely diversification of source countries for importing raw materials so as to mitigate potential supply-side bottlenecks. Apart from securing own supply chain, the country can also use the pandemic to elevate the sector’s position in the global supply chain by standing as a reliable exporter of pharmaceuticals. Furthermore, the sector globally being highly research-intensive, a long-term approach towards shifting the focus to R&D, without depending much on joint ventures and higher incentives for R&D in Production Linked Incentive (PLI) scheme should be explored. References: Aggarwal, A. (2004). Strategic Approach to Strengthening the Export Competitiveness of firms in the Indian Pharmaceutical Industry. RIS Discussion Papers. doi:RIS-DP# 80/2004 Bhaduri, S., and Ray, A. S. (2004). Exporting through technological capability: econometric evidence from India’s pharmaceutical and electrical/electronics firms. Oxford Development Studies, 32(1), 87-100. doi:https://doi.org/10.1080/1360081042000184138 Bhatt, S., and Panigrahi, A. (2014). Impact of Recession on Indian Pharma Sector. International Journal of Research in Commerce, Economics and Management, 4(11). Retrieved from https://papers.ssrn.com/sol3/papers.cfm?abstract_id=2518881 Breusch, T., and Pagan, A. (1980). The Lagrange Multiplier Test and its Application to Model Specification in Econometrics. Review of Economic Studies, 47, 239-253. Chokkakula, B. M., and Kolapalli, M. R. (2018). Corporate strategies adopted by Indian Pharmaceutical Industry for restructuring. International Journal for Drug Regulatory Affairs (IJDRA), 6(4), 33-41. doi:10.22270/idra.v614.282 Department of Pharmaceuticals. (2019). 2019-2020 Annual Report. Government of India, Ministry of Chemicals and Fertilizers. Dhar, B., and R.K, J. (2019). The Challenges, Opportunities and Performance of the Indian Pharmaceutical Industry Post-TRIPS. (K. Liu, & R. U, Eds.) Innovation, Economic Development, and Intellectual Property in India and China. ARCIALA Series on Intellectual Assets and Law in Asia., 299-323. doi:https://doi.org/10.1007/978-981-13-8102-7_13 Differding, E. (2017). The Drug Discovery and Development Industry in India—Two Decades of Proprietary Small-Molecule R&D. ChemMedChem Reviews, 12, 786-818. doi:10.1002/cmdc.201700043 Government of India, Ministry of Commerce & Industry. (2020). PIB. Retrieved from https://pib.gov.in/PressReleasePage.aspx?PRID=1624102#:~:text= India’s%20overall%20exports%20(Merchandise%20 and,the%20same%20period%20last%20year. Gujarati, D. N., Porter, D. C., and Gunasekhar, S. (2015). Basic Econometrics. New Delhi: McGraw Hill Education. Hausman, J. (1978). Specification Tests in Econometrics. Econometrica, 1251-1271. IBEF. Pharmaceuticals. Retrieved from IBEF: https://www.ibef.org/archives India, Pharmaceuticals Export Promotion Council of India (pharmexcil). (2018). 15th Annual Report. Ministry of Commerce & Industry, Government of India. Joshi, S. (2018). Self-sufficiency in manufacture of APIs and Intermediates is. Indian Drugs, 55(4), 5. Retrieved from https://www.indiandrugsonline.org/issue-details?year=2018&start=3 KPMG Advisory Services Pvt Ltd. (2007). Human Resource and Skill Requirements in the Pharmaceutical Sector. National Skill Development Corporation. Lalitha, N. (2002). Indian Pharmaceutical Industry in WTO Regime: A SWOT Analysis. Economic and Political Weekly, 37(34), 3542-3555. Retrieved from https://www.jstor.org/stable/4412521 Majumdar, S. K. (1994). Assessing Firms’ Capabilities: Theory and Measurement: A Study of Indian. Economic and Political Weekly, 29(22), M83-M89. Retrieved from http://www.jstor.com/stable/4401267 Mishra, P., and Jaiswal, N. (2012, March). Mergers, Acquisitions and Export Competitiveness: Experience of Indian Manufacturing Sector. Journal of Competitiveness, 4(1), 3-19. doi:10.7441/ joc.2012.01.01 Mishuk, U. A., Quian, J., Howard, J. N., Harris, I., Frank, G., Kiptanui, Z., Hansen, R. (2018, March). The Association Between Patient Sociodemographic Characteristics and Generic Drug Use: A Systematic Review and Meta-analysis. Journal of Managed Care & Speciality Pharmacy (JMCP), 24(3), 252-264. Retrieved from www.jmcp.org Nwakuya, M., and Blue, E. O. (2019). Comparative Study of Within-Group and First Difference Fixed Effects Models. American Journal of Mathematics and Statistics, 177-181. doi:10.5923/j.ajms.20190904.04 Patel, D. (2018). Pharma Sector: 80 percent APIs via Chinese imports despite similar making costs. Retrieved from The Indian Express: https://indianexpress.com/article/business/business-others/pharma-sector-80-per-cent-apis-via-chinese-imports-despite-similar-making-costs-5222951/lite/ Pradhan, J. P. (2006). Global Competitiveness of Indian Pharmaceutical Industry: Trends and Strategies. Institute for Studies in Industrial Development (ISID), Working Paper 2006/05. PricewaterhouseCoopers (PwC). (2020). Global pharma looks to India: Prospects for growth. Retrieved from https://www.pwc.com/gx/en/pharma-life-sciences/pdf/global-pharma-looks-to-india-final.pdf History.Com Editors (2020). Spanish Flu. Retrieved from https://www.history.com/topics/world-wari/1918-flu-pandemic The Pharma Letter. (2020). Relief for Indian Pharma as US FDA green lights the way, Retrieved from https://www.thepharmaletter.com/article/relief-for-indian-pharma-as-us-fda-green-lights-the-way Wooldridge, J. M. (2002). Econometric Analysis of Cross Section and Panel Data. The MIT Press.
|