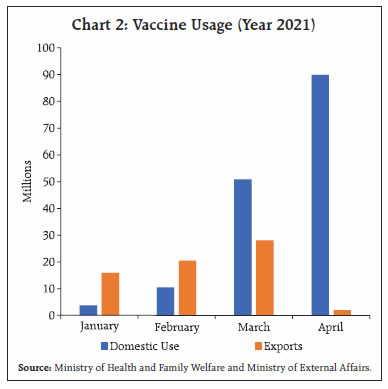
The ferocity of the COVID-19 second wave has overwhelmed India and the world. War efforts have been mounted to stop the second surge in its tracks. Real economy indicators moderated through April-May 2021.The biggest toll of the second wave is in terms of a demand shock - loss of mobility, discretionary spending and employment, besides inventory accumulation, while the aggregate supply is less impacted. The resurgence of COVID-19 has dented but not debilitated economic activity in the first half of Q1:2021-22. Although extremely tentative at this stage, the central tendency of available diagnosis is that the loss of momentum is not as severe as at this time a year ago. Introduction References to epidemics and major disasters like fire, floods and famines, are replete in ancient texts, medical doctrines and holy scriptures. The first systematic record of the visitations of pandemics in India covers the period between 1817 and 1920. In a meticulous chronicle of this period by a father for his eight-year-old son, it is revealed that of the 70 million lives lost worldwide, 57 per cent died in India – clearly, we were the epicentre1. Of all the pandemics of this age – cholera, plague, and influenza – it was influenza that was global in its impact. The influenza pandemic of 1918-20 turned out to be the deadliest, killing 40 million people worldwide of which 20 million died in India. This was also the time of the ‘rise of the west’, a phenomenon widely attributed to globalisation and mass migration, but should equally be associated with the pandemics which caused Asia’s share in global output and population to fall precipitously. After 1920, influenza pandemics have occurred from time to time and we are familiar with them – Asian flu (H2N2), 1957-58; Severe Acute Respiratory Syndrome (SARS), 2002-04; swine flu (H1N1)2, 2009-10; Middle East Respiratory Syndrome (MERS), 2012 – but none as deadly as the Spanish flu pandemic of 1918-20. Until COVID-19 struck! It is also recorded that the Spanish flu appeared in waves. While the first wave spread widely in 1918, the second wave occurred towards the close of the year and was the deadliest, with some countries experiencing a third wave in 1919 and even a fourth in 1920. The second wave was W-shaped, affecting adults between 25 and 40, apart from the very young and the elderly. The only saving grace was that it was short-lived, populations rapidly acquired herd immunity and the virus mutated into less harmful variants within months. India was the worst affected country in absolute terms, with deaths accounting for 5 per cent of its population. Mahatma Gandhi contracted it as it spread to Gujarat; parts of his family residing there were devastated by it. By the last quarter of 1918 it had spread across the country. The ferocity of the current second wave of COVID-19 has shaken the nation3. The pandemic’s trajectory in India has become near-vertical (Chart 1). On May 6, 2021, India reported 4,14,188 people testing COVID-positive, the highest figure for any country at any point of time during the pandemic. This new surge has overwhelmed India and the world as spillovers break on various shores. The “double mutant” first detected in India has begun to be found in several other countries. Even as scientists labour to understand how big a threat it poses, more variants are appearing. A more immediate global consequence is the pressure on vaccine supplies. With case numbers rising domestically and stretching the health and medical production infrastructure to its limits, India could ship just 1.9 million doses abroad in April, as compared with 64 million in the three prior months4, impacting commercial commitments and the COVAX scheme5 to supply more shots worldwide (Chart 2). The new surge of infections has also hit the global shipping industry as India is one of the largest sources of shipping crew, with a share of 15 per cent in global seafarers6. India is also one of the major contributors to nurses of the world, commemorating international nurses’ day on May 12. The need of the hour is to do whatever it takes to bring the second wave under control. 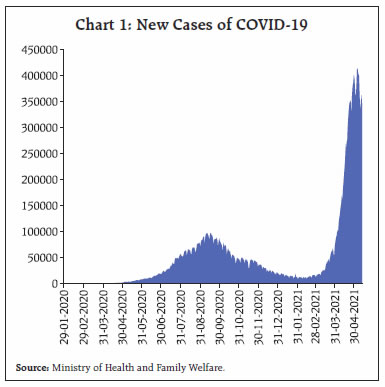
 India is mobilising a war effort to stop the second surge in its tracks (Table 1). The initial response has focused on micro-containment zones and ‘test, track and treat’7. As the health infrastructure of the country came under intense pressure, including supply chains and logistics of oxygen and other life-saving drugs and equipment8, 551 pressure swing adsorption (PSA) oxygen generation plants have been approved in public health facilities across the country. Imports of nebulisers, oxygen concentrators and 15 other life-saving medical devices have been cleared. The supply of oxygen is being prioritised for medical purposes. Steel companies, both public and private, have reduced the production of nitrogen and argon so as to produce medical oxygen in most plants. Corporates and businesses are weighing in by setting up large COVID centres, isolation facilities and by enabling storage and transportation of oxygen-related equipment9. The Indian railways chipped in by waiving charges on ‘Oxygen Express’ trains. By the end of April, production of liquid medical oxygen increased nearly 36 per cent over the level at the start of the month10. By mid-May, production has reached close to 9500 tonnes a day (versus a demand of 7500-7800 tonnes a day), with almost the entire output earmarked for medical purposes11. | Table 1: Additions to the Hospital Infrastructure During the Pandemic – Select Statistics | | | COVID Beds | Isolation Beds | ICU Beds | Oxygen Supported Beds | | COVID Hospitals - 2084 | 4,68,974 | 2,63,573 | 50,408 | 1,54,993 | | COVID Health Centres - 4,043 | 3,57,096 | 2,31,462 | 25,459 | 1,00,175 | | Total | 8,26,070 | 4,95,035 | 75,867 | 2,55,168 | | Source: PIB (https://pib.gov.in/PressReleasePage.aspx?PRID=1710629) | Recognising that vaccination offers hope to end the pandemic, a massive vaccination drive has been launched. From May 1, all Indians aged 18 years and above can be vaccinated and they can choose their vaccines. State governments have greater flexibility in procuring and stockpiling vaccine doses. The private sector is now fully engaged in the national vaccination efforts. Efforts are underway to step up the production and administration of vaccines. Global support has poured in, with over 40 governments committing to help India with medical essentials. The World Trade Organisation’s Director-General Ngozi Okonjo-Iweala tweeted: “India unselfishly exported over 40 per cent of her vaccines. Timely for India to get this support”. The US has decided to divert vaccine-related raw materials to India for production of vaccines. Gilead Sciences and Merck, two large US has pharmaceutical companies, took steps to expand access to their drugs in India through the voluntary licensing route, while committing support to Indian companies manufacturing Remdesivir as well as contributing 450,000 vials up-front12. Russia began exporting the Sputnik V vaccine to India from May 1, 2021. Oxygen concentrators, liquid oxygen, cryogenic oxygen tanks, oxygen cylinders, mobile oxygen production plants and ventilators have been reaching through air and sea from a host of other countries – Singapore; the UK; France; Germany; the UAE; Ireland; Australia; Saudi Arabia; Hong Kong; and Thailand (Table 2). The Asian Development Bank (ADB) has sanctioned US$1.5 billion to support India’s pandemic response13. From every Indian, Anugrahitosmi!14 As raw materials become available and production capacity is ramped up, India will resume its export commitments at full steam. | Table 2: Global Support | | Medicines and Equipment | Quantity | | Oxygen Concentrators | 9200 | | Oxygen Cylinders | 5243 | | Oxygen Generation Plants | 19 | | Ventilators/Bi PAP | 5913 | | Remdesivir | 3.44 lakhs | Note: Cumulative support received till May 10, 2021
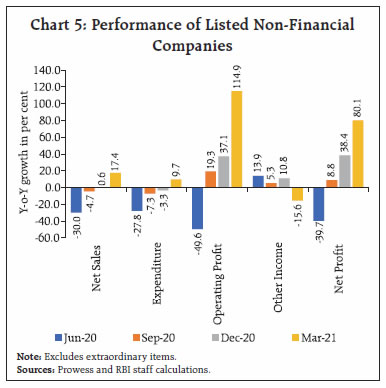
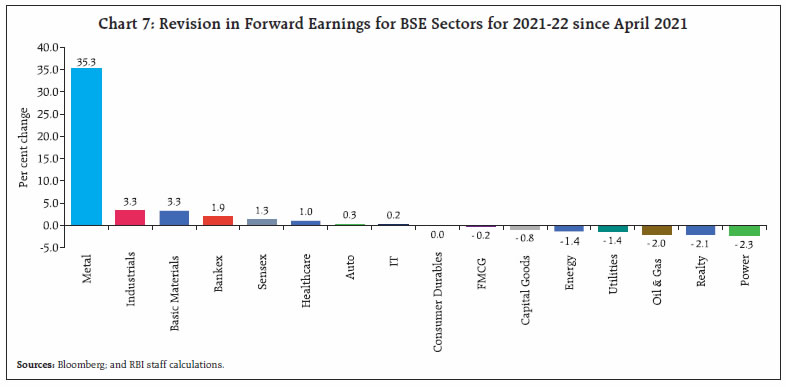
Source: PIB | There are, however, glimmers of hope amidst the gloom. At the end of the first half of May, the test-positivity rate in the ‘maximum city’ Mumbai, among the worst-hit in the second wave, dipped to 7.9 per cent on May 12 from 26.6 per cent in early April. Daily new cases in the city have declined from a recent peak of 10,000 on April 7 to around 2400 on May 12. Discharges are higher than daily detections and as a result, the active caseload has fallen from a peak of 90,000 on April 12 to about 40,000 on May 12. India’s second wave hit Mumbai (and Maharashtra) first. The rest of India may hope that its trajectory is a sign of things to come (Chart 3). How has the second wave impacted the economy? In a pandemic, such assessments tend to get blurred by disproportionate base effects and hence, measuring momentum can shine some light into the haze, as discussed in Section III. High frequency indicators for April and May 2021 are scanty in view of data lags, but they suggest that the biggest toll of the second wave is in terms of a demand shock - loss of mobility, discretionary spending and employment, besides inventory accumulation. Aggregate supply is less impacted. As Section III shows, agriculture remains robust. In the National Statistical Office (NSO) print for March 2021, industrial production surged out of a two-month contraction on the tailwinds of a large favourable base effect. Nonetheless, seasonally adjusted annualised month on month momentum was positive for the fourth consecutive month. Yet anecdotal evidence points to feedback loops from the demand contraction seeping through into curtailments of output in the months ahead unless infections ebb. 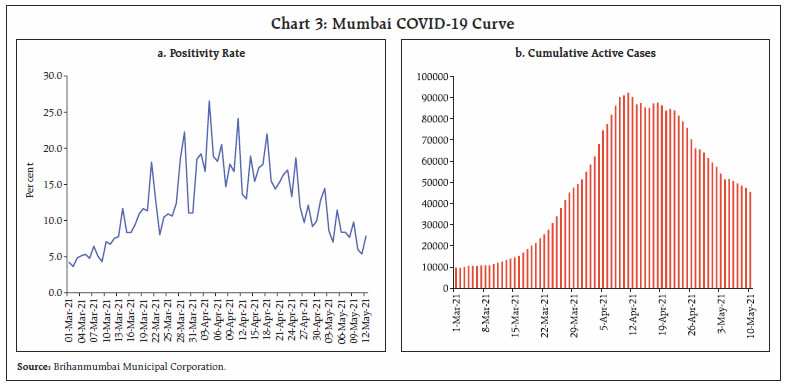 In order to gauge the impact of the second wave, therefore, these proximate indications need to be seen in comparison with the Reserve Bank’s real GDP growth projection of 26.2 per cent given in the MPC’s resolution of April 7 for the first quarter of 2021-22, which was made before the full fury of the resurgence (Chart 4). Meanwhile, corporate performance is undergoing a silent transformation as if it is positioning itself for a turn in the business cycle. The initial set of earnings results declared by 288 Indian listed companies (constituting around 51 per cent of the market capitalisation of all listed non-financial companies) for Q4:2020-21 marks a distinct shift from the previous quarters, with top-line growth gaining prominence in a broad-based manner (Table 3). Sales emerged out of a prolonged contraction, fuelled by improvement in volumes, higher realisations and favourable base effects. Raw material costs grew sharply but other operating expenses such as wages and salaries grew at a slower pace as benefits from economies of scale set in and interest expenses declined. Thus, notwithstanding elevated raw material costs, the growth of operating profits and net profits was higher than in preceding quarters (Chart 5). 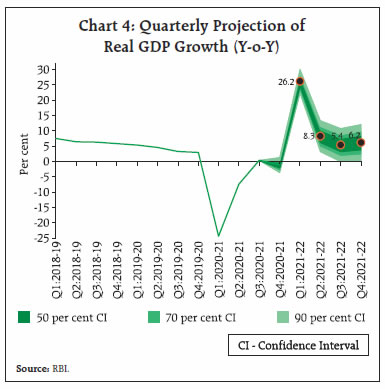 Furthermore, earnings results of 82 listed banking and financial sector companies in India (constituting around 68 per cent of the market capitalisation of all listed financial companies) indicate that net sales growth, which primarily includes interest income, remained moderate in Q4:2020-21. On the other hand, other income, which includes fees, commissions and profit/loss from transactions in securities, registered a sharp rise. Total expenditure growth moderated, reflecting the impact of fall in credit costs (Chart 6). Despite the second wave, analysts remain upbeat on 2021-22 corporate earnings15 (Chart 7). 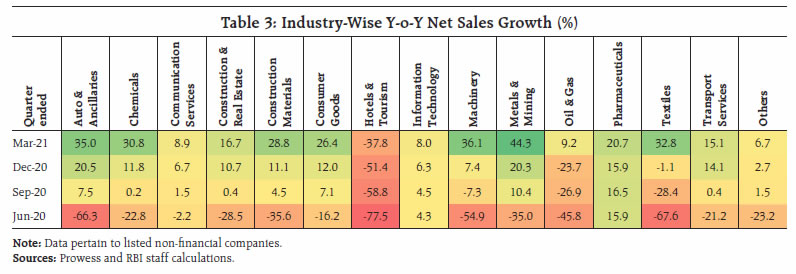
 Thus, there is a shift in corporate performance. While net profits were higher in Q4 than in any preceding quarter, they were driven by sales growth turning positive after a hiatus of six quarters in respect of non-financial companies. On the other hand, financial companies, including banks, relied on other income and lower provisioning for the rise in their net profits. Overall, the corporate sector is turning into a net saver in the economy. On May 5, the Reserve Bank went on the front foot against the second wave, unfurling a set of measures as part of a financial safety net for the economy. The objective, as Governor Shri Shaktikanta Das put it, is to alleviate any constraint from the financing side for all stake holders and above all the common man facing spikes in health expenditure. To quote from his statement made on that day: “The Reserve Bank of India (RBI) will... deploy all resources and instruments at its command in the service of the nation, especially for our citizens, business entities and institutions. The devastating speed with which the virus affects different regions of the country has to be matched by swift-footed and wide-ranging actions that are calibrated, sequenced and well-timed so as reach out to various sections of society and business, right down to the smallest and the most vulnerable. ...We will continue to be proactive throughout the year – taking small and big steps – to deal with the evolving situation.” 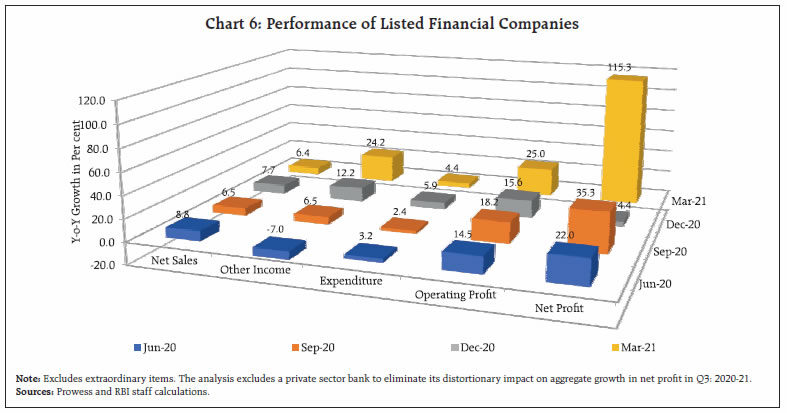
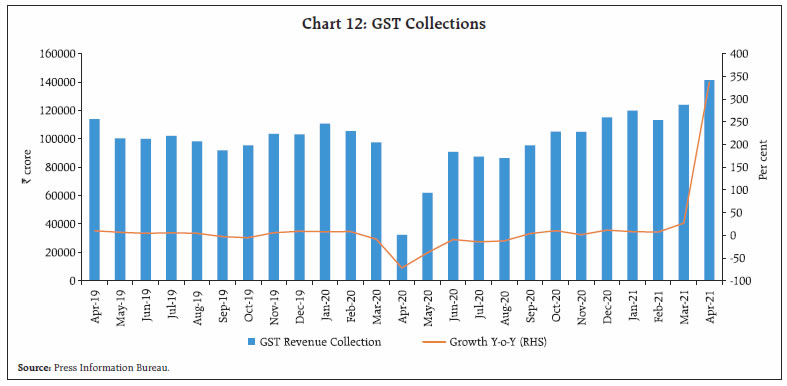
 As overarching protective cover, system-level durable liquidity was bolstered by the announcement of the second tranche of government securities acquisition programme (GSAP) 1.0 which is going to be bigger than the first tranche - ₹35,000 crore of purchases of government securities will be auctioned on May 20 as against ₹25,000 crore offered in the first tranche on April 16. This enlargement rewards the orderly evolution of the yield curve that has taken place since the first tranche. It is timed to pre-emptively replenish the drainage of liquidity due to the restoration of 0.5 percent of the cash reserve ratio (CRR) that will take it back to its pre-pandemic level of 4 per cent of net demand and time liabilities (NDTL). As the narrative in the following sections will show, the Reserve Bank has been supplementing these bulk operations with operation twists, transactions on the Negotiated Dealing System-Order Matching (NDS-OM) platform and with primary dealers as well as forex operations that in the net have turned out to be domestic liquidity positive. For 2021-22, on top of enhanced ways and means accommodation announced in April, State Governments were allowed more relaxed access to Over Draft (OD) facilities in terms of the maximum number of days of OD in a quarter. Further, banks were allowed to utilise 100 per cent of floating provisions/countercyclical provisioning for making specific provisions for non-performing assets. And for the citizen, know your customer (KYC) procedures at banks were eased by relaxing punitive restrictions and extending the scope of video KYC (video-based customer identification process). The use of digital channels for the purpose of periodically updating KYC details should work towards customer satisfaction. The theme of the May 5 measures, first stage of the Reserve Bank’s strategy to combat the second wave is: small is beautiful, with a focus on small businesses, MSMEs and individual borrowers, small finance banks and MFIs. Resolution Framework 2.0 offers succour for individual borrowers who have availed of personal and/or business loans, small businesses engaged in retail and wholesale trade other than MSMEs, and MSMEs, i.e., the most vulnerable category of borrowers. Even for those individuals, small businesses and MSMEs that have restructured earlier, lending institutions can review working capital sanctioned limits, margins and the like as a one-time measure. For new MSME borrowers, banks have been allowed to get relief from CRR requirements for credit disbursed to the former, in addition to extending till end-December the exemption currently available for exposures up to ₹25 lakh. An important component of the May 5 measures relates to health services. The Reserve Bank stepped up to provide liquidity of ₹50,000 crore for a period of up to three years to banks ‘on tap’ so that they, in turn, can on-lend and support vaccine manufactures, importers/suppliers of vaccines, priority medical devices and COVID related drugs, hospitals/ dispensaries, pathology labs and diagnostic centres, manufactures and suppliers of oxygen and ventilators, logistics firms and patients for treatment. To encourage quick delivery of credit, banks can reckon these loans as priority sector lending till repayment or maturity. As a special incentive for fast disbursements, banks are also allowed to avail of reverse repo under the LAF that is remunerated at 25 bps lower than the repo rate as against 3.35 under the fixed rate reverse repo window and a rate of about 3.5 per cent under the 14-day variable rate reverse repo auctions. The Reserve Bank has also sought to exploit synergies with small finance banks and their last mile connectivity. A three-year special long-term repo (SLTRO) of ₹10,000 crore at the repo rate will be conducted every month starting May 17, 2021 to support fresh lending of up to ₹10 lakh per borrower to small business units, micro and small industries, and other unorganised sector entities. Governor Shri Das has committed the Reserve Bank to ‘battle readiness’ throughout the year, to go unconventional as needed, to be proactive in ameliorating the travails and distress all around, and to be on guard against future waves. Set against this backdrop, the remainder of the article is structured into four sections. Section II presents an overview of the rapidly evolving developments in the global economy. The underlying impulses in the domestic economy are examined in Section III. Section IV takes stock of current financial conditions, while the last Section sets out some perspectives. II. Global Setting Global economic activity is gaining firmer ground as vaccination drives gather momentum. In several advanced economies (AEs), this is unclogging the path for gradual easing of restrictions / social distancing norms. Signs of rebound are in sight again in improved prints of high frequency indicators, though it is likely to be hesitant and divergent both within and between economies. The upward revisions in global growth projections for 2021 by major international organisations point to an improved outlook. In the Asian Development Outlook (ADO), released on April 28, 2021 the Asian Development Bank (ADB) has forecast a strong rebound for developing Asia in 2021. Tourism-dependent economies remain the hardest hit, however, and are expected to revive relatively slowly (Table 4). The global composite PMI rose to a 11-year high in April, with services expanding at a higher pace than manufacturing for the first time since July 2020. (Chart 8). A strong bounce back in the US economy appears to be underway notching an annualised growth rate of 6.4 per cent in Q1:2021 on the back of stimulus, vaccinations and easing of lockdowns. The UK economy has emerged out of lockdown from the onset of Q2:2021. New surges of the virus have pushed the Eurozone into a double-dip recession, with widely differentiated growth profiles among members. Following corrections since mid-March, crude oil prices picked up in April and in the first half of May, briefly crossing US$ 69 per barrel before trading range-bound, despite the decision of the Organization of Petroleum Exporting Countries (OPEC) plus to ease current production cuts between May and July. At US$ 66.96 per barrel on May 13, 2021, brent prices marked an overall year-to-date gain of 31.0 per cent (Chart 9a). Gold prices pared some losses in April and May with the pullback in US treasury yields and a weakening US dollar boosting safe-haven demand (Chart 9b). Base metal prices continued to boil as demand-supply imbalances fuelled bullish sentiments (Chart 9c). 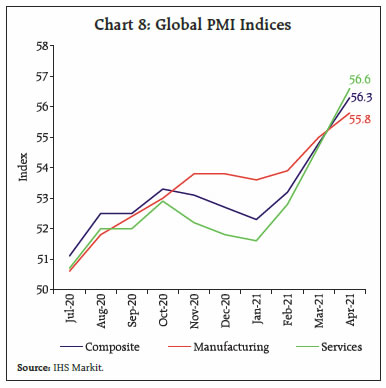 Financial markets regained buoyancy in April and the first half of May, marked by some volatility. Equity markets across major AEs rallied, barring brief corrections at the end of April. In May so far (up to May 13, 2021), AE markets have exhibited volatile movements, with sharp corrections on May 11-12 on rising inflation concerns (Chart 10a). Stock indices across major emerging market economies (EMEs) remained uneasy on country-specific factors. Overall, the Morgan Stanley Capital International (MSCI) AE and EME stock indices posted net gains of 7.5 per cent and 0.1 per cent, respectively, on a year-to-date basis by May 13, 2021 (Chart 10b). Global initial public offerings (IPO) have risen at a breakneck pace, with 875 issuances raising US$230 billion in the first four months of 2021 – a two-decade record16. 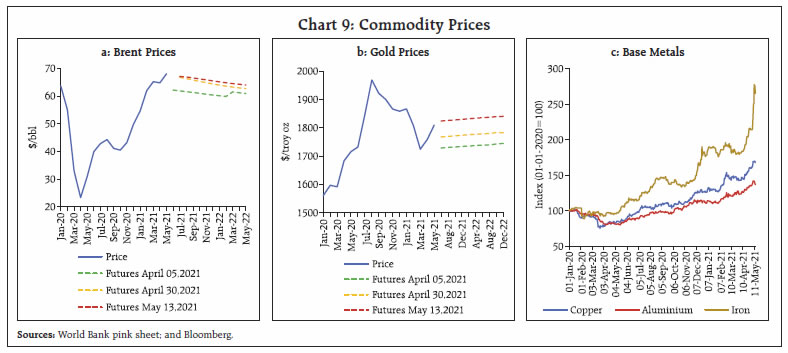 With markets retracting expectations of a premature roll-back of monetary accommodation, the US treasury bond yields have broadly eased in April and May so far (up to May 13, 2021), barring intermittent hardening, from a multi-month high in March (Chart 10c). As on May 13, 2021, the US 10-year G-sec bond yield had decreased by 8 basis points from 1.74 per cent recorded on March 31, 2021. Bond yields across most other AEs and major EMEs have exhibited similar movements (Chart 10d). In the currency markets, the US dollar broadly weakened in April and May so far, though on a year-to-date basis (up to May 13, 2021) it has recorded a marginal appreciation of 0.9 per cent. Most EME currencies strengthened against the US dollar, resulting in an appreciation in the MSCI emerging markets (MSCI-EM) index by 1.5 per cent in April and by 0.3 per cent in the first half of May (up to May 13, 2021) (Chart 10e). According to the Institute of International Finance (IIF), portfolio flows to EMEs resumed in April with a brief reversal in first week of May (Chart 10f). Total EM portfolio flows stood at US$ 45.5 billion in April, with debt flows accounting for US$ 31.2 billion of total inflows. In May so far (up to May 07, 2021), weekly data indicate net equity outflows. On the monetary policy front, the US Federal Reserve and the European Central Bank (ECB) maintained their dovish stance as well as asset purchases, attributing incipient signs of pick-up in inflation to transitory elements. The Bank of England (BoE) maintained its dovish stance and the quantum of asset purchases, but it has indicated its intention to slowdown the pace of asset purchases per week to £3.4 billion from £4.4 billion currently17. Most major AEs have persevered with highly accommodative monetary policies, except the Bank of Canada, which scaled back its weekly purchases of government bonds. The Bank of Russia and Banco Central do Brasil raised their policy rates again in April and May, respectively, marking their second consecutive hikes this year and indicating further policy tightening amidst inflation concerns, while the central bank of Turkey has maintained a pause in both April and May meetings, after raising its policy rate in March. China and Thailand, on the other hand, have maintained a pause on their policy rates since Q2:2020. 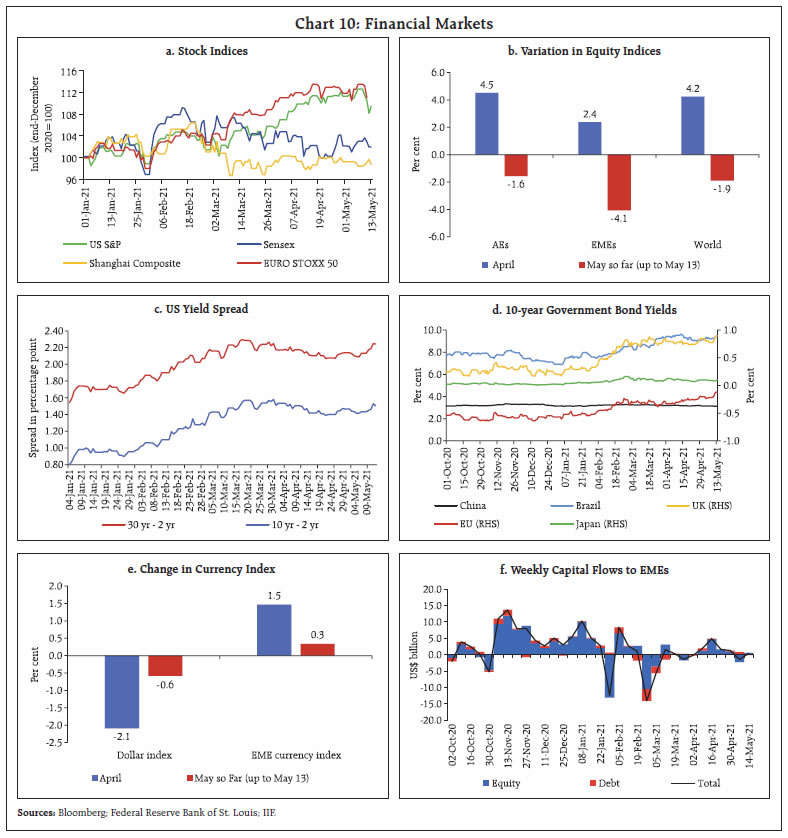 III. Domestic Developments Real economy indicators moderated in April and May 2021, as many states imposed restrictions to arrest the renewed surge in infections. The second wave has intensified in metros/cities, and relative to the first wave, it has spread rapidly across states, regions, and into rural pockets. Google mobility indicators exhibited a dip across all major cities in April and May as compared to the baseline. The Apple mobility index also corroborated this declining mobility across cities (Chart 11a and 11b). The impact of the second wave on the real economy seems to be limited so far in comparison with the first wave. Evidently, the localised nature of lockdowns, better adaptation of people to work from home protocols, online delivery models, e-commerce and digital payments are at work (Chart 11c and 11d). Aggregate Demand Aggregate demand conditions have been impacted, albeit not on the scale of the first wave. Goods and services tax (GST) collections in April at ₹1.41 lakh crore were the highest since the introduction of GST (Chart 12). E-way bills — an indicator of domestic trade — recorded double digit contraction at 17.5 per cent month-on-month (m-o-m) in April 2021, with intra-state and inter-state e-way bills declining by (-) 16.5 per cent and (-) 19 per cent, respectively (Chart 13). This could be pointing to a moderation in GST collections in coming months. Despite the sharp decline, total e-way bills remained above the pre-pandemic baseline of February 2020, indicating that domestic trade has remained resilient on the back of digitisation of sales platforms. 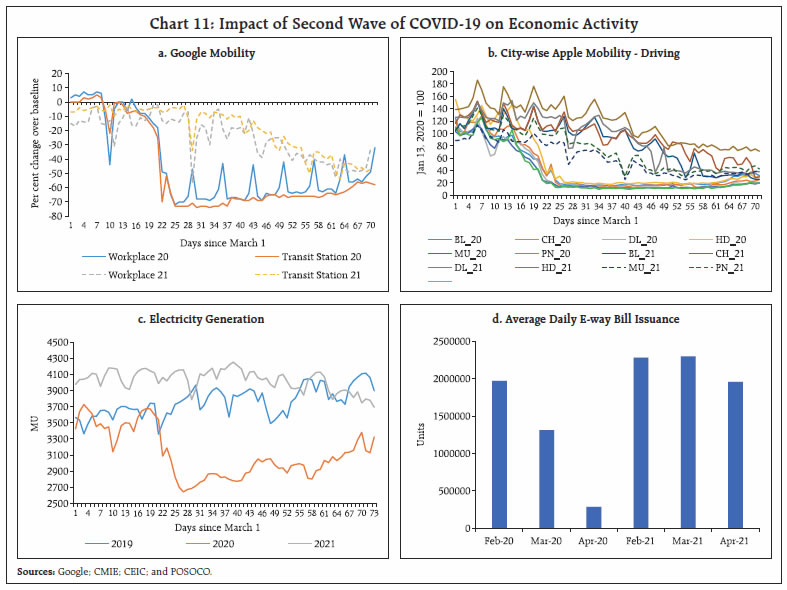
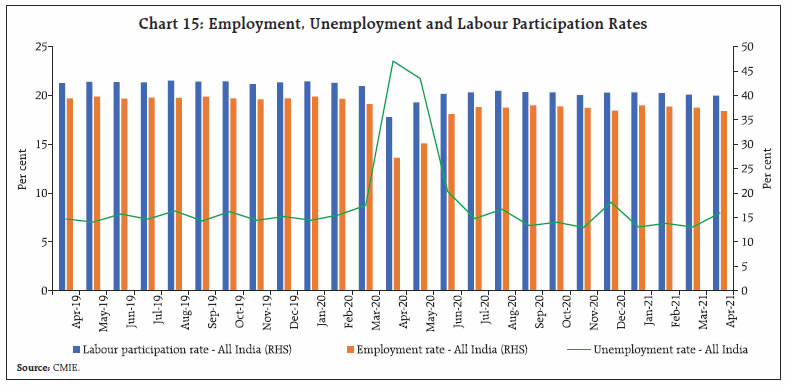
 Preliminary data on petrol and diesel sales point to a decline in fuel demand in April, attributable to mobility restrictions. Diesel sales contracted by 1.7 per cent m-o-m, while petrol sales declined by 6.3 per cent in April 2021. Electricity generation in April stagnated month-on-month but over the pre-pandemic base of April 2019, it increased by 8.1 per cent, indicating a limited hit of the second wave on industrial activity. On a year-on-year (y-o-y) basis, electricity generation expanded by 39.7 per cent. 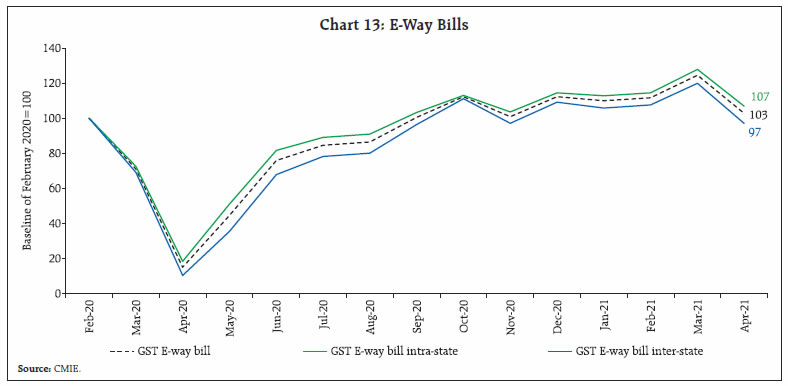 Most of the original equipment manufacturers (OEMs) of passenger vehicles (PVs) reported a m-o-m dip in April, reflecting subdued demand. Dispatches of two wheelers also contracted by 33.5 per cent m-o-m, mirroring frail rural demand. Other vehicular indicators such as Vahan registrations and commercial vehicles sales reported a sequential double digit contraction. Tractor sales, which had been enjoying a stellar run, weakened amidst supply chain constraints and dwindling footfalls at dealerships18. With restrictions on public movement, freight and passenger movements reflected moderation. The average number of daily fliers fell for the sixth week in a row ending May 1, 202119. The average number of daily fliers slid from less than 1,93,000 to 1,26,000 through the week ended April 17 to May 1. Railway passenger registrations have reverted to a slowdown mode since the first week of April (Chart 14). As per the household survey of the Centre for Monitoring Indian Economy (CMIE), employment conditions dampened in April, with the unemployment rate soaring to a four-month high of 8 per cent from 6.5 per cent a month ago. The unemployment rate, however, remained lower than the high of 23.5 per cent a year ago during the first wave. Similar movements were visible in both rural and urban areas (Chart 15). The pandemic has slowed down the labour participation rate to 39.9 per cent from an average of 42.7 per cent in 2019-20. 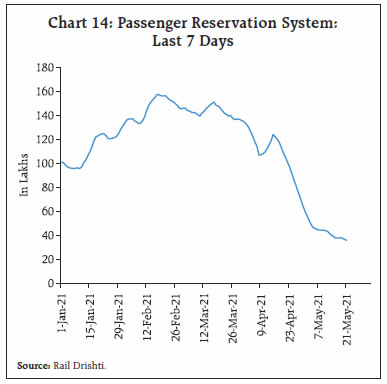
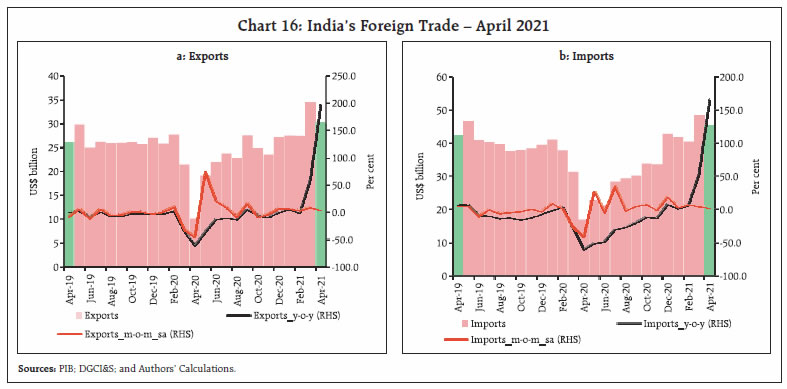 India’s merchandise exports surged to US$ 30.6 billion in April, reflecting a favourable base effect and an increase of about 16 per cent over the pre-pandemic level (April 2019) [Chart 16]20. The major sectors that powered export growth in April 2021 (compared with April 2019) were engineering goods, gems and jewellery, iron ore, drugs and pharmaceuticals, and electronic goods (Chart 17a). Strong external demand on the back of faster vaccine rollouts is evident in key exports destinations.
India’s merchandise imports rose by around three times to US$ 45.7 billion in April, though the growth remained moderate as compared with the pre-COVID period (April 2019). The major sectors which pulled up import growth were gold, electronics, pearls and precious stones and chemical products (Chart 17b). In recent months, gold imports have risen sharply, April marking the seventh consecutive month of expansion in both value and volume terms on top of record gold imports in March (Chart 18a and 18b). According to the Gems and Jewellery Export Promotion Council (GJEPC), improvement in demand conditions in major export destinations, pent up domestic demand for weddings postponed earlier along with the festive season, have pushed up demand for gold and jewellery. Improved business and consumer sentiments, reduction in customs duty, ebbing of gold prices from record peaks in August 2020 and the appreciation of Indian Rupee vis-à-vis US Dollar in Q4:2020-21 has also attracted retail investment in gold. The recent rise in crude prices, following the OPEC+ decision to cut production, has lent impetus to India’s oil import basket diversification. India has successfully diverted away from OPEC countries towards non-OPEC producers of crude in recent years, with a greater push for diversification coming in recent months (Chart 19). India has shifted towards non-OPEC producers, especially the USA, Qatar and Mexico, reducing its dependence on Saudi Arabia (Chart 20). In fact, the share of OPEC in India´s oil imports slipped in March to a two-decade low21.
The reopening of the Suez Canal increased pressure on global logistics and shortage of shipping containers have resulted in a steep rise in freight prices (Chart 21). The rise in freight is not limited to container shipping as dry bulk cargo freight rates have also risen sharply. The Baltic Dry Index, which gives the weighted average freight rates across different sizes and routes, is at a decade-long peak (Chart 22).
Aggregate Supply Despite adverse conditions in the face of the pandemic, harvesting of rabi crops has been progressing apace, being almost complete in respect of pulses and oilseeds. Cumulative procurement of wheat has been 35.4 per cent higher than a year ago (as of May 11, 2021), benefitting over 34 lakh farmers across all major producer states (Chart 23). The minimum support prices (MSP) outflow due to wheat procurement has led to a transfer of around ₹67,500 crores to the farming community, which may boost rural demand. The public stock of cereals reached 4.8 times the buffer norms by end-April. The area under summer crops has increased to over 80 lakh hectares mainly under pulses (by 69.2 per cent) and rice (15.5 per cent), incentivised by higher returns that farmers are realising for these crops. The India Meteorological Department (IMD) has forecast that South West Monsoon (SWM) will arrive in Kerala on May 31. In anticipation, the National Conference Kharif Campaign held on April 30, 2021, has placed food grain production at another record at 307 million tonnes, 1.7 per cent above the previous year’s record production. Except sugarcane, production targets set for all the crops are higher than for the previous year (Chart 24). The headline manufacturing PMI remained in expansion at 55.5 in April 2021, improving marginally from 55.4 a month ago (Chart 25a). The services sector PMI expanded in April too for the seventh consecutive month, but the pace softened (Chart 25b). Inflation CPI inflation in April 202122 moderated by 122 bps to 4.3 per cent from 5.5 per cent in March 2021 as food and core (CPI excluding food and fuel) inflation eased even as fuel inflation registered a substantial pick-up (Chart 26a). Large favourable base effects brought about the softening in food and core inflation. Among CPI groups, CPI food and beverages inflation moderated to 2.7 per cent in April from 5.2 per cent in March as the deflation in prices of vegetables, cereals, and sugar deepened, milk prices moved into deflation and inflation in pulses, spices, and prepared meals moderated (Chart 26b). The other noteworthy development was that CPI excluding food and fuel inflation moderated to 5.4 per cent in April from 5.9 per cent in March with most of the sub-groups registering a softening in inflation.
High frequency food price data from the Ministry of Consumer Affairs, Food and Public Distribution (Department of Consumer Affairs) for May so far (May 1-12, 2021) show, barring cereals, a pick-up in prices of key food items (Chart 27). With international crude prices on an upward trajectory since mid-April 2021, domestic pump prices also increased with a lag from early May onwards. Between May 3, 2021 to May 12, 2021 petrol and diesel pump prices (average of prices in four major metros) increased by ₹1.53 per litre and ₹1.85 per litre to ₹94.10 per litre and ₹86.33 per litre, respectively. At this level, pump prices are scaling new historic highs (Table 5). International commodity prices are registering sharp increases, cutting across agricultural, industrial raw-materials and energy segments. This is leading to a worsening of domestic cost conditions. | Table 5: Petroleum Product Prices | | Item | Unit | Domestic Prices | Month-over-month
(per cent) | | May-20 | Apr-21 | May-21^ | Apr-21 | May-21 | | Petrol | ₹/litre | 73.97 | 92.64 | 93.17 | -0.6 | 0.6 | | Diesel | ₹/litre | 67.07 | 84.54 | 85.21 | -0.7 | 0.8 | | Kerosene (subsidised) | ₹/litre | 14.43 | 30.32 | 30.38 | 3.2 | 0.2 | | LPG (non-subsidised) | ₹/cylinder | 578.63 | 819.63 | 819.63 | -1.2 | 0.0 | ^: For the period May 1 -12, 2021
Note: Other than kerosene, prices represent the average Indian Oil Corporation Limited (IOCL) prices in four major metros (Delhi, Kolkata, Mumbai and Chennai). For kerosene, prices denote the average of the subsidised prices in Kolkata, Mumbai and Chennai.
Sources: IOCL, Petroleum Planning and Analysis Cell (PPAC) and RBI staff estimates. |
IV. Financial Conditions System liquidity remained abundant, with daily net absorption under the liquidity adjustment facility (LAF) averaging ₹5.78 lakh crore in April 2021 and ₹5.21 lakh crore in May 2021 (up to May 12, 2021) [Chart 28]. The weighted average call rate (WACR), the tri-party repo and the market repo rate traded below the reverse repo rate by 15 bps, 18 bps and 23 bps, respectively, on average, during April and May 2021 (up to May 12). Among other key money market rates, the 3-month T-bill rate and 3-month certificates of deposit (CD) rate traded below or close to the reverse repo rate, while the interest rate on 3-month commercial paper (CP) rates ruled above the reverse repo rate in May 2021 (Chart 29).
The downward adjustment in deposit rates has accelerated in the wake of COVID-19 on account of persistent surplus liquidity amidst weak credit demand. During March 2020 through April 2021, the moderation in median term deposit rate (representing card rates on new deposits) has been of the order of 144 bps. During the same period, the 1-year median marginal cost of funds-based lending rate (MCLR) softened cumulatively by 95 bps, mirroring the reduction in overall cost of funds (Table 6). In the fixed income segment, the yield on 10-year G-sec declined by 14 bps to close at 6.03 per cent as at end-April 2021, enabled by G-SAP 1.0. In addition, the Reserve Bank signalled its stance on the yield curve through cancellations and devolvements in G-sec auctions. The first auction of 2021-22 on April 9, 2021 saw devolvement of the new 5-year G-sec paper for the entire notified amount of ₹11,000 crore. Furthermore, the Reserve Bank did not accept any bid for the 10-year G-sec paper (notified amount of ₹14,000 crore) on April 16, 2021 and also for another paper maturing in 2026 (notified amount of ₹11,000 crore) on April 23, 2021. In both these auctions, there was partial allotment of a G-sec maturing in 2061 on April 16, 2021 and another G-sec maturing in 2050 on April 23, 2021. Heading into May, the softening momentum was further supported by an operation twist for an aggregate amount of ₹10,000 crore on each side of the operation on May 6, and the announcement of another round of G-sec purchases under G-SAP 1.0 scheduled on May 20. In a primary G-sec auction conducted on May 14, 2021, the Reserve Bank did not accept any bid for 10 year G-sec paper with notified amount of ₹14,000 crore. With these developments, the benchmark 10-year G-sec yield eased to sub-6 per cent levels and closed at 5.99 on May 14, 2021. Of the gross borrowings by the Central government of ₹7.24 lakh crore for H1:2021-22, nearly 20 per cent amounting to ₹1.46 lakh crore has been completed so far (up to May 14, 2021). Corporate bond yields too eased, tracking the movement in G-sec yields. Furthermore, the spread on corporate bonds over corresponding G-secs moderated across issuer categories and ratings spectrum (Table 7). | Table 6: Transmission from the Repo Rate to Banks’ Deposit and Lending Rates | | (Basis points) | | Period | Repo Rate | Term Deposit Rates | Lending Rates | | Median Term Deposit Rate | WADTDR | 1 - Year Median MCLR | WALR - Outstanding Rupee Loans | WALR - Fresh Rupee Loans | | Feb 2019 - Sep 2019 | -110 | -9 | -7 | -30 | 2 | -40 | | Oct 2019 – Apr 2021* | -140 | -174 | -146 | -120 | -108 | -154 | | Mar 2020 - Apr 2021* | -115 | -144 | -107 | -95 | -90 | -123 | | Feb 2019 – Apr 2021* | -250 | -209 | -153 | -150 | -106 | -194 | | March 2021 | 0 | 0 | -1 | 0 | -8 | -16 | *: Latest data on WALRs and WADTDR pertain to March 2021.
WALR: Weighted Average Lending Rate.
WADTDR: Weighted Average Domestic Term Deposit Rate;
MCLR: Marginal Cost of Funds-based Lending Rate.
Source: RBI. | The Indian equity markets exhibited wild swings during April 2021 as investors turned anxious over the rapid spread of the second wave of COVID-19 infections, oxygen/ vaccine supply issues and fresh lockdown-like restrictions in various parts of the country (Chart 30). After a gap of six months, foreign portfolio investors (FPIs) turned bearish with net sales in equity markets of ₹11,116 crore in the month of April. Mutual funds, on the other hand, remained net buyers for the second consecutive month with net purchases of ₹5,526 crore. So far in 2021, FPIs are net buyers of stocks, worth ₹40,212 crore. FPIs turned net sellers in both domestic equity and debt markets, to the tune of US$ 1.7 billion in April 2021. In May (up to 10th), FPIs have continued to sell, prompting total net outflows of US$ 0.2 billion (Chart 31).
Foreign exchange reserves dipped to US$ 589.5 billion on May 7, 2021 on account of valuation loss, after reaching an all-time high of US$ 590.2 billion on January 29, 2021 (Chart 32). In the foreign exchange market, the Indian rupee (INR) depreciated against the US dollar in April 2021 on FPI outflows. The INR depreciated vis-à-vis the US dollar by 2.3 per cent in April over March 2021, but it has appreciated modestly in May (up to 11th). In terms of the 40-currency real effective exchange rate (REER) index, the INR depreciated by 2.6 per cent in April over its level a month ago (Chart 33).
Payment System Digital transactions continued to surge into April and May 2021 so far. Real Time Gross Settlement (RTGS) transactions volume registered a triple digit growth of 179 per cent (y-o-y) in April. In the suite of retail digital modes, the National Electronic Fund Transfer (NEFT), the Immediate Payment Service (IMPS), the Bharat Bill Payment System (BBPS) and the National Electronic Toll Collection (NETC) also recorded strong growth. Under the Unified Payments Interface (UPI), transaction volume increased by 164 per cent and its value more than tripled to ₹4.9 trillion in April from ₹1.5 trillion a year ago (Table 8). The rally in digital numbers is indicative of rising adoption of these modes of payments by the general public. V. Conclusion The resurgence of COVID-19 has dented but not debilitated economic activity in the first half of Q1: 2021-22. Although extremely tentative at this stage, the central tendency of available diagnosis is that the loss of momentum is not as severe as at this time a year ago. Tragically, the loss of life and the caseload of infections are higher. As the WHO points out, this is completely unlike the first wave – the B.1.617 variant of the coronavirus, which was first detected in Vidarbha and has 13 mutations, has been declared a ‘global variant of concern’ in view of its rapid transmissibility. Apart from the severe incidence of infections in India, it has already spread to nearly 50 countries23. The impact of the new infections appears to be U-shaped. Each shoulder of the U represents sectors that are weathering the storm - agriculture at one end and IT on the other. On the slopes of the U are organised and automated manufacturing on one side and on the other, services that can be delivered remotely and do not require producers and consumers to move. These activities continue to function under pandemic protocols. In the well of the U are the most vulnerable - blue collar groups who have to risk exposure for a living and for rest of society to survive; doctors and healthcare workers; law and order; and municipal personnel; individuals eking out daily livelihood; small businesses, organised and unorganised - and they will warrant priority in policy interventions. It is in this direction that the Reserve Bank, re-armed and re-loaded, has stepped out. This is the beginning. There is more work to be done. The effective reproduction number (R count), a key indicator of how fast COVID-19 infects people - the number of people in a population who can be infected by an individual at any specific time - is beginning to drop in India, according to a data modelling assessment of the University of Michigan. From a R count of 1.61 on April 1, the national metric stood at 0.99 on May 15, the lowest since mid-February, indicating a slowdown in the spread rate of the virus. On May 16, seven-day average of daily new cases declined for the eighth consecutive day, indicating that India might be approaching the peak of the devastating second wave. 18 states are reporting plateauing of new cases. The data show, however, that the wave is shifting from big cities to small towns and villages where testing is low and health infrastructure poor, and this is where we must refocus our efforts and energies to put down the virus. What has worked so far? Lockdowns have worked in controlling transmissibility. Localised lockdowns rather than nation-wide lockdowns have been preferred in order to balance the spread of infections versus the loss of economic activity but the jury is out on which works and where. The key lesson from the visitation of the second wave is vaccinate, vaccinate, vaccinate. As Professor Arvind Panagariya writes, “With its well-developed vaccine manufacturing ecosystem, India is well positioned to ramp up its production… at speed. It must mobilise all its brownfield capacity… while de-risking potential investors in greenfield capacity...”24. Several successes are being studied for replication - the Kerala model of preventing vaccine wastage; the Mumbai model of decentralised war rooms for bed allotment; the Pune model of strict containment; the UP model of door to door testing to isolate hidden Covid cases; the Jammu and Kashmir model of Atmanirbharta on medical oxygen; a more muted migration; compassion as a business skill; and most importantly, the resolve and fortitude to stand together and support people and families. As it is said in Zulu, Ubuntu, i.e., I am because you are25. The road ahead is fraught with danger, but India’s destiny lies not in the second wave, but in life beyond it. In these dire moments, one is reminded of the light shone by the late Shri S. S. Tarapore, the iconic and much revered Deputy Governor of the Reserve Bank: “गर जन्नत ही जाना हो तो चल मेरे साथ; याद रख ऐ बंदे कि रास्ता है दोज़ख़ के बीच” – If you wish to go to heaven, come with me. But remember, the path lies through hell26.
|