Bank credit growth, which witnessed a slowdown in 2019-20, experienced a further setback in 2020-21 in the wake of COVID-19-induced lockdown. However, with the gradual resumption of economic activity, credit to agriculture and services sectors has registered accelerated growth in the recent period. Even in the industrial sector, credit growth to medium industries has accelerated. Empirical estimates indicate that non-food credit is sensitive to interest rate changes with a lag, with industry and services sectors exhibiting greater sensitivity. Introduction Bank credit is the predominant source of finance for various sectors of the economy in a developing country like India though market-based sources of finance have also gained in importance in the recent years. Adequate and equitable distribution of bank credit among productive sectors of the economy has been an abiding concern among academics and policy makers (Yakubu & Affoi, 2014; Makinde, 2016). Non-food credit growth, which was quite robust in 2018-19, touching a peak year-on-year (y-o-y) growth of 15.3 per cent in November 2019, slowed down significantly during 2019-20 in line with deceleration in economic growth. The slowdown was exacerbated in 2020-21 due to the COVID-19-induced lockdown with economic growth turning negative in two successive quarters, viz., Q1 and Q2: 2020-21. Due to the shutdown of economic activities, credit demand was impacted severely resulting in a further deceleration in credit growth to various sectors of the economy. The Reserve Bank and the Government of India have taken a number of measures aimed at facilitating adequate and unimpeded flow of credit to the productive sectors of the economy to support economic recovery, as bank credit channel is an important channel of monetary policy transmission in India. In view of the importance of bank credit flows to various productive sectors of the economy, the Reserve Bank has been compiling and publishing sectoral deployment of bank credit data on the last working day of every month with a lag of about a month. These data covering important sectors of the economy are being collected from select banks, accounting for around 90 per cent of the total non-food credit extended by all scheduled commercial banks (SCBs) in India, through sectoral and industrial bank credit (SIBC) return. This article analyses the developments in sectoral deployment of bank credit during the period preceding the COVID-19 pandemic and compares them with developments during the COVID-19 period, i.e., during April-November, 2020-21. The article empirically estimates sensitivity of non-food credit to interest rate changes. The article is organised as follows: Section II presents important developments relating to non-food credit growth during 2020-21. Section III presents trends in sectoral credit in the recent period with special focus on key sectors. The empirical findings on interest rate sensitivity of credit to major sectors of the economy are presented in Section IV along with the concluding observations in Section V. II. Non-Food Credit Growth in 2020-21: Important Developments Non-food credit growth, which was robust in 2018-19, slowed down significantly in 2019-20; the growth was 6.1 per cent in March 2020 as compared to 13.4 per cent a year ago. The growth further decelerated to 5.9 per cent in November 2020 from 7.8 per cent a year ago (Chart 1a). The slowdown was broad-based with credit to all major sectors witnessing a lower growth due to the economic slowdown. The lockdown imposed in the wake of the pandemic resulted in a sharp contraction in overall economic activity in H1: 2020-21. However, credit growth to agriculture sector has exhibited a turnaround in the more recent months. Credit growth to the services sector, which had slowed down significantly in H2: 2019-20, too has accelerated in the recent months (Chart 1b and 2a). 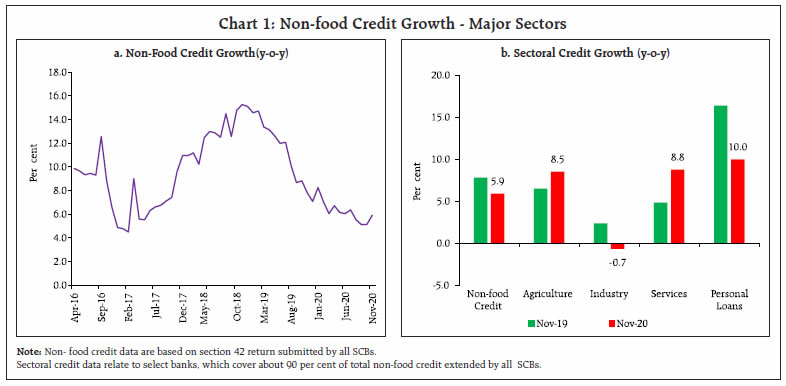 Owing to the turnaround in growth, there was a significant increase in the share of the services sector in the incremental credit flow between November 2019 and November 2020 (Chart 2b). Industrial credit growth, which turned negative between November 2019 and November 2020, reported a negative share in the incremental credit flow during this period. The share of personal loans in the total incremental credit flow also decreased from 58 per cent in November 2019 to around 46 per cent in November 2020, owing to a deceleration in the growth of credit to this sector. 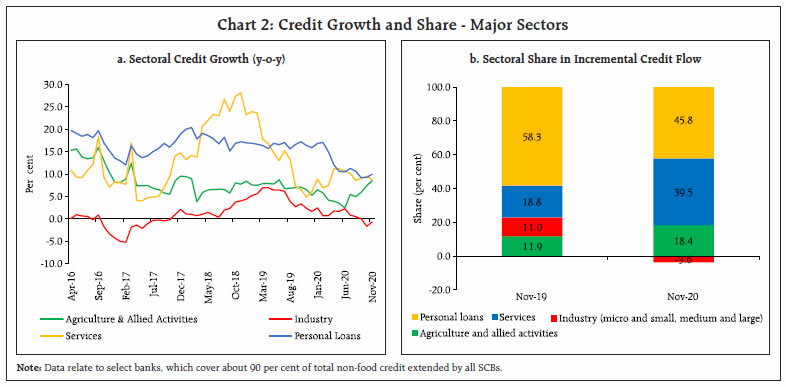 A further analysis of sectoral credit data reveals that private sector banks (PVBs), accounting for 31.9 per cent share in non-food credit in November 2020, played a significant role in the credit slowdown. The non-food credit extended by PVBs registered a decelerated growth of 9.0 per cent in November 2020 as compared to 13.5 per cent a year ago. However, public sector banks (PSBs), which accounted for around 65 per cent share in non-food credit, registered a higher growth of 5.2 per cent in November 2020 as compared to 4.5 per cent in November 2019. While PSBs have been primarily responsible for an accelerated growth in credit to agriculture and services sectors in the recent period, they have also been instrumental in the contraction in the overall industrial credit. Given that PVBs have a significant presence in the personal loans segment, they have driven the sharp deceleration in the growth of personal loans. It is evident from the above that PSBs are leading the revival of credit growth in the pandemic period (Table 1). | Table 1: Credit Growth to Major Sectors with their Share in Total Credit | | Major Sectors | Public Sector Banks | Private Sector Banks | All Banks | | Nov-2019 | Nov-2020 | Nov-2019 | Nov-2020 | Nov-2019 | Nov-2020 | | Non-food Credit | 4.5
(65.4) | 5.2
(64.8) | 13.5
(31.1) | 9.0
(31.9) | 7.2
(100) | 6.0
(100) | | Agriculture | 4.4
(76.4) | 7.6
(75.7) | 13.1
(22.2) | 10.7
(22.7) | 6.5
(100) | 8.5
(100) | | Industry | 0.4
(67.8) | -2.1
(66.9) | 8.0
(27.8) | 4.3
(29.2) | 2.4
(100) | -0.7
(100) | | Services | 3.2
(62.7) | 9.1
(62.9) | 7.0
(32.3) | 8.8
(32.3) | 4.8
(100) | 8.8
(100) | | Personal Loans | 12.1
(59.9) | 9.1
(59.4) | 25.6
(37.8) | 12.5
(38.7) | 16.4
(100) | 10.0
(100) | | Note: Data relate to select banks, which cover about 90 per cent of total non-food credit extended by all SCBs. Figures in brackets indicate share in the total. The share in total will not add up to 100 as share of foreign banks is not included. | The sharp deceleration in credit growth since H2: 2019-20, has resulted in the credit-deposit (C-D) ratio declining sharply between March 2019 and September 2020. The greater increase in deposits than credit has resulted in surplus liquidity in the banking system making banks invest more in government securities. The decline in C-D ratio was observed in the case of both PSBs and PVBs (Table 2). II.1 Credit Flow During 2020-21 (up to October 2020) Credit flow data pertaining to April-February 2019-20 represent the pre-pandemic period, while April-October 2020 represent the pandemic period.1 The growth (y-o-y) of fresh credit disbursed came down sharply to 8.1 per cent during the pandemic period as compared to 22.8 per cent growth in the pre-pandemic period (Chart 3). Prepayments were much higher in the pre-pandemic period with a y-o-y growth of 32.4 per cent as against 17.8 per cent during the pandemic period. Even repayments have come down and rollovers have increased during the pandemic period vis-à-vis the pre-pandemic period. Thus, the extent of deleveraging taking place in the pre-pandemic period seems to have come down during the pandemic period. It also appears that corporates and households have utilised the moratorium on loan repayments to tide over the funding pressures induced by the crisis. | Table 2: Credit Deposit Ratio of SCBs | | Bank Group | Pre-COVID-19 period | COVID-19 period | | Mar-19 | Mar-20 | Sep-20 | | Public Sector Banks | 72.85 | 70.18 | 66.40 | | Private Sector Banks | 91.36 | 90.45 | 86.73 | | All Banks | 78.18 | 76.00 | 72.04 | | Source: RBI; DBIE |
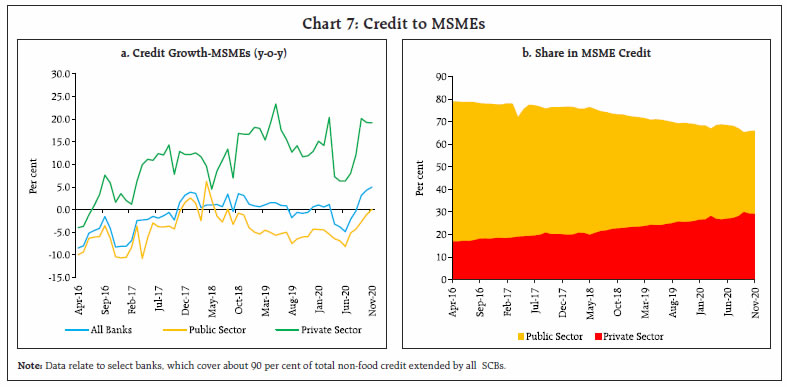
III. Bank Credit to Key Sectors of the Economy III.1 Agriculture and Allied Activities As noted earlier, credit growth to agriculture and allied activities accelerated in November 2020 as compared to a year ago. Credit growth to this sector has been increasing in the recent months with the growth in November 2020 being the highest since June 2019. The increase in credit to agriculture sector, which is a part of priority sector lending, is indicative of good performance of this sector. Agriculture accounted for a higher share in the total loan portfolio of PSBs as compared to PVBs. While agricultural credit growth increased for both PSBs and PVBs, it was higher in the case of PVBs. Because of the higher growth, even though agriculture accounted for about 13 per cent share in outstanding non-food credit of SCBs, its share in the incremental bank credit accelerated significantly between November 2019 and November 2020. Notwithstanding the lockdown, agriculture sector has performed relatively well on the back of record production in 2019-20. The good performance of agriculture sector augurs well for rural consumption and revival in the industrial sector, which may have a salutary impact on credit to the industrial sector going forward (Chart 4, Annex- T1 and T2). III.2 Industry Industrial credit includes credit to micro and small, medium and large industries, depending upon the firms’ investment in plant and machinery and their turnover.2 Large industries constituted around 82 per cent of the credit offtake to the industrial sector, while the micro, small and medium together constituted the rest in November 2020. Credit to the industrial sector has generally remained weak in the recent years. A peak of 6.9 per cent was achieved in April 2019 but there has been a continuous decline in credit offtake since then with credit growth turning negative in October 2020. The recent decline in credit growth was mainly due to large industries. Owing to the stressed assets in large industries, there was a general reluctance on the part of bankers to lend to these industries, with the problem getting compounded by the pandemic. 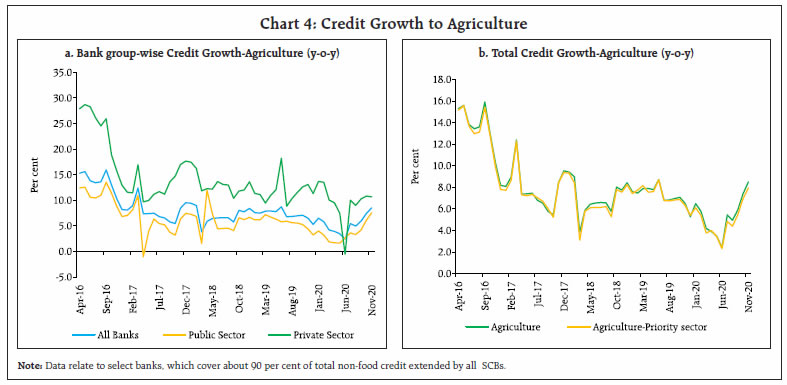 Although credit growth to large industries turned negative in November 2020, the silver lining has been the robust growth of credit to medium industries. Credit to micro and small industries registered a moderate increase between November 2019 and November 2020 (Chart 5.a). The contraction in credit extended by PSBs to the industrial sector started in December 2019 and has continued unabated in 2020. Industrial credit growth by PVBs was mostly in double digit till June 2020. However, it has also decelerated quite sharply since then, touching a low of 4.3 per cent in November 2020 (Chart 5.b). With the Indian economy poised to recover in 2021 and beyond, a turnaround in credit offtake to the industrial sector is expected. III.2.a. Credit to the Industrial Sub-Sector Insofar as credit to industrial sub-sectors is concerned, credit to ‘food processing’, ‘petroleum, coal products and nuclear fuels’, ‘leather and leather products’, ‘paper and paper products’, ‘mining and quarrying’, ‘glass and glassware’, ‘textile’, ‘beverages and tobacco’ and ‘vehicles, vehicle parts and transport equipment’ registered an accelerated growth in November 2020. However, credit growth to ‘rubber plastic and their products’, and ‘construction’ decelerated, while credit to ‘cement and cement products’, ‘all engineering’, ‘gems and jewellery’, ‘infrastructure’ and ‘basic metal and metal products’ contracted (Chart 6). III.2. b. Micro, Small and Medium Enterprises (MSMEs) MSME sector accounted for a share of around 18 per cent in the total credit to industry and around 5 per cent in the total non-food credit extended by the SCBs in November 2020. Credit growth to MSMEs which has generally remained subdued in the recent years, received further setback due to the pandemic. However, there has been a turnaround in credit to this sector in the recent months mainly due to a sharp increase in credit extended to the medium industries. Owing to the sharp increase in credit growth to medium industries, the overall credit to MSMEs in November 2020 accelerated to 5.0 per cent as compared to a contraction of 0.6 per cent a year ago. This reflects the positive effect of a number of measures taken by the Government of India and the Reserve Bank to contain the impact of pandemic on this sector. Some revival in credit disbursal to the MSME sector by both PSBs and PVBs has been witnessed since July 2020 (Chart 7a and 7b). III.2. c. Infrastructure The infrastructure segment accounted for around 36.6 percent of total industrial credit in November 2020. Credit to infrastructure sector, which had witnessed declining trend since 2009-10 and had contracted during 2016-17 and 2017-18, staged a turnaround in 2018-19. The sharp pick up in credit growth to infrastructure sector during 2018-19 was on the back of fresh loan disbursements by the banks mainly to investors in sectors like power, roads and ports, telecommunications, and other infrastructure like construction, railways, oil terminals and waterways. However, the momentum could not be sustained in 2019-20 and 2020-21. 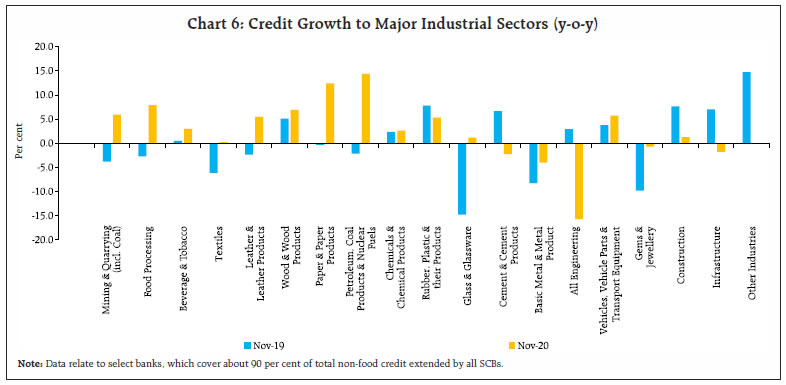
 Power sector accounts for the highest share of 55 per cent in infrastructure credit followed by roads and ports (around 20 per cent) and telecommunications (10 per cent). Credit to telecommunications segment along with roads and ports has hitherto been the major driver of infrastructure credit growth but in the recent period, credit growth to only roads and ports is increasing, while that of telecommunications and power sector has shown declining trend (Chart 8a). PSBs, which are at the forefront, accounting for 76 per cent of infrastructure credit, have led the decline. PVBs, which were quite resilient earlier, have also witnessed sharp deceleration in credit growth to infrastructure sector in the recent months (Chart 8b). III.3 Services sector Though credit growth to the services sector was quite robust in 2018-19, the momentum lost its pace in 2019-20. However, unlike the sharp moderation in growth of industrial credit and personal loans due to the pandemic, credit growth to the services sector has bucked the downtrend and posted an accelerated growth; this acceleration has been primarily due to ‘transport operators’ and ‘trade’. Further, ‘tourism, hotels and restaurants’ also registered accelerated growth notwithstanding the pandemic. However, growth in credit to non-banking financial companies (NBFCs), being the single-largest constituent of services sector, decelerated sharply (Chart 9a). Importantly, credit extended by both PSBs and PVBs to the services sector has exhibited resilience in 2020-21 so far (Chart 9 b). III.3.a NBFC sector Non-banking financial companies (NBFCs) serve as an alternative channel of finance to the commercial sector. The credit growth extended by SCBs to this sector moderated during the last decade and almost halved in 2017-18 as compared to 2007-08. Credit growth to this sector declined substantially from November 2016, though the sector witnessed an uptick in 2018-19. The credit growth extended by the SCBs to this sector moderated in 2019-20 due to the liquidity stress and rating downgrades faced by the NBFCs in the aftermath of the Infrastructure Leasing and Financial Services (IL&FS) crisis in August 2018 with banks turning cautious over funding to this sector. Consequently, NBFC sector witnessed a decelerated credit growth in March 2020. The lockdown compounded the slowdown with credit growth to this sector further decelerating in November 2020. 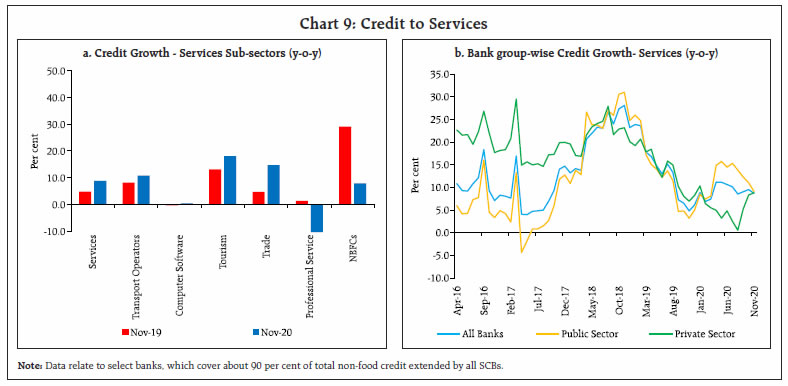 The Reserve Bank has taken a number of steps to address the liquidity issues faced by this sector, including recent introduction of targeted long-term repo operations (TLTROs) aimed at liquidity support to NBFCs, especially smaller ones, and micro-finance institutions (MFIs). The inclusion of NBFCs in TLTRO on tap scheme by the Reserve Bank in its monetary policy statement of February 5, 2021 is expected to facilitate lending by NBFCs to various sectors of the economy. III.3.b Trade The trade sector has performed well during the pandemic period with credit growth to this sector increasing steadily since July 2020. Credit growth to both wholesale and retail trade sectors remained upbeat, especially when the economy gradually opened up after the lockdown. This sector also witnessed growth on a financial year basis, i.e., November 2020 over March 2020. Consequently, the share of trade in annual incremental bank credit accelerated steeply to 14.1 per cent in November 2020 from merely 3.8 per cent in November 2019 (Annex-T2). III.4. Personal Loans Personal loans segment has generally performed well in the recent years, registering double digit growth. Some moderation was witnessed in this segment in 2019-20 mainly due to deceleration in growth of housing loans and credit cards outstanding. However, after the imposition of the lockdown, personal loans registered a sustained deceleration in growth. Within this sector, however, ‘vehicle loans’ continued to perform well. Housing loans, which constitute the largest component of personal loans, lost the growth momentum by November 2020 (Chart 10a). PVBs have been at the forefront in the personal loans segment. However, the pandemic has led to a slowdown in growth of personal loans by PVBs. Some recovery is, however, visible in November 2020 vis-à-vis October 2020 (Chart 10b). III.4.a Vehicle Loans Vehicle loans segment generally covers vehicle loans for personal use, i.e., mainly for cars and two wheelers. Though the implementation of regulatory requirements like Bharat VI norms, new insurance norms, and GST had impacted vehicle sales, vehicle loans bounced back in 2019-20. This segment has also exhibited resilience during 2020-21 due to the increased preference for personal vehicles over public transport due to the pandemic. III.4.b Credit Card Outstanding The credit card segment has gained in importance with greater recourse to digital payments in the recent years. The credit card outstanding was growing at a robust rate of over 20 per cent before the pandemic but the imposition of lockdown led to a sharp fall in its growth. This was because most of the business establishments, including e-commerce portals, were closed during the lockdown. With the opening up of the economy, growth in credit card outstanding has revived; it has been helped, to some extent, by moratorium on payment of credit card dues announced by the Reserve Bank. III.4.c. Housing Loans Housing loans accounted for over 50 per cent of personal loans extended by the banks in November 2020. This sector has been the major driver of growth in personal loans segment. Housing loan growth decelerated moderately in March 2020 and this deceleration extended further into 2020-21 due to the pandemic. The sharp deceleration is a cause of concern because of the adverse effect it may have on sectors like steel, cement, construction, etc. There are signs of a turnaround, as evidenced by a spurt in property purchases in the recent period mainly on the back of support extended by the Government to this sector. As the economy gathers momentum in 2021 and beyond, housing loans are expected to pick up. IV. Interest Rate Sensitivity of Sectoral Credit Demand: Some Empirical Findings The interest rate sensitivity of credit demand, total non-food credit as well as credit to the major sectors of the economy, has been empirically estimated with respect to changes in weighted average call rate (WACR). Since WACR is the operating target of the monetary policy and is closely aligned with the policy rate, it has been used as a proxy for policy rate in the empirical analysis. The interest rate sensitivity of credit demand is estimated using the following equation: average call money rate; gnpa is gross non-performing assets to total advances ratio; dum takes value 1 for 2016-17:Q3 and zero otherwise, representing the demonetisation period. The parameter γ measures the elasticity of credit growth to interest rate changes. p, q, r are the lag lengths of the variables3. The estimation is based on the quarterly data for the period 2007- 08:Q1 through 2019-20:Q4. The first two quarters of 2020-21, being outliers, have not been considered for the estimation as the economy was in sharp contraction due to the pandemic. The underlying variables used in the regression are in nominal terms. The regression results are reported in Annex-T3. The empirical estimates indicate that non-food credit is sensitive to interest rate changes with a lag, with industry and services sectors exhibiting greater sensitivity. However, the analysis could not find evidence of any statistically significant impact of interest rate change on credit demand in agricultural sector. This is possibly because credit to agriculture is covered under the priority sector and gets the benefit of interest rate subvention and, hence, may not be very sensitive to interest rate changes. NPAs have a lagged negative impact on non-food credit growth as well as on industrial credit growth. V. Conclusion The analysis of sectoral credit data provides insights into the flow of credit to various important sectors of the economy. The muted credit offtake in the recent past needs to be seen in the context of economic slowdown coupled with the COVID-19- induced lockdown. Bank credit growth, which had already started decelerating in 2019-20, experienced a further setback in 2020-21 in the wake of the pandemic. However, with the gradual resumption of economic activity, credit to agriculture and services sectors has registered accelerated growth in the recent period. Even in the industrial sector, credit growth to medium industries has accelerated, indicative of positive impact of several measures taken by the Government and the Reserve Bank. However, contraction in credit to large industries and infrastructure remains a cause of concern. The Reserve Bank has taken several measures to facilitate credit flow to various sectors of the economy, especially to the MSME and NBFC sectors. The inclusion of NBFCs in the TLTRO on tap scheme and measures to incentivise credit flows to MSME entrepreneurs in the monetary policy statement of February 5, 2021 are steps in this direction. Credit offtake is expected to pick up as the economy is poised to stage a smart recovery in 2021-22 on the back of decline in COVID infections and swift rollout of the vaccination programme in addition to a number of measures announced by the Government in the Union Budget 2021-22 to accelerate the growth momentum. References Makinde, H.O. (2016), “Implications of Commercial Bank Loans on Economic Growth in Nigeria’’, Journal of Emerging Trends in Economics and Management Sciences, 7(3):124-136. Yakubu, Z. and Affoi, A. Y. (2014), “An Analysis of Commercial Banks’ Credit on Economic Growth in Nigeria”, Current Research Journal of Economic Theory, 6(2): 11-15.
| Annex-T1: Sectoral Deployment of Credit by Major Sectors | | (Annual Variation in per cent) | | Serial. No | Sectors | Nov.19/ Nov.18 | Dec.19/ Dec.18 | Jan. 19/ Jan. 20 | Feb. 20/ Feb. 19 | Mar. 20/ Mar. 19 | Apr. 20/ Apr. 19 | May. 20/ May. 19 | Jun. 20/ Jun. 19 | Jul. 20/ Jul. 19 | Aug. 20/ Aug. 19 | Sep. 20/ Sep. 19 | Oct. 20/ Oct. 19 | Nov.20/ Nov.19 | | Non-food Credit (1 to 4) | 7.2 | 7.0 | 8.5 | 7.3 | 6.7 | 7.3 | 6.8 | 6.7 | 6.7 | 6.0 | 5.8 | 5.6 | 6.0 | | 1 | Agriculture Activities | 6.5 | 5.3 | 6.5 | 5.8 | 4.2 | 3.9 | 3.5 | 2.4 | 5.4 | 4.9 | 5.9 | 7.4 | 8.5 | | 2 | Industry (Micro, Medium and Large) | 2.4 | 1.6 | 2.5 | 0.7 | 0.7 | 1.7 | 1.7 | 2.2 | 0.8 | 0.5 | 0.0 | -1.7 | -0.7 | | | 2.1 Micro | -0.1 | 0.1 | 0.5 | -0.4 | 1.7 | -2.2 | -3.4 | -3.7 | -1.9 | -1.2 | -0.1 | 0.7 | 0.5 | | | 2.2 Medium | -2.4 | 2.5 | 2.8 | 3.9 | -0.7 | -6.4 | -5.3 | -9.0 | -3.1 | 2.8 | 14.5 | 16.7 | 20.9 | | | 2.3 Large | 3.0 | 1.8 | 2.8 | 0.7 | 0.6 | 2.7 | 2.8 | 3.7 | 1.4 | 0.6 | -0.6 | -2.9 | -1.8 | | 3 | Services | 4.8 | 6.2 | 8.9 | 6.9 | 7.4 | 11.2 | 11.2 | 10.7 | 10.1 | 8.6 | 9.1 | 9.5 | 8.8 | | | 3.1 Transport Operators | 8.1 | 7.8 | 6.1 | 5.3 | 4.3 | 5.5 | 5.5 | 3.5 | 5.5 | 5.2 | 3.5 | 6.5 | 10.7 | | | 3.2 Computer Software | -0.4 | -2.8 | -0.4 | 0.1 | 8.2 | 8.2 | 7.6 | 12.5 | 16.2 | 7.1 | 5.6 | 1.6 | 0.4 | | | 3.3 Tourism, Hotels & Restaurants | 13.1 | 15.3 | 17.4 | 16.9 | 17.9 | 15.0 | 17.6 | 16.8 | 18.8 | 17.6 | 19.7 | 12.0 | 18.0 | | | 3.4 Shipping | 5.1 | 5.0 | -10.9 | -11.8 | -15.4 | 0.1 | -16.0 | -15.2 | -11.9 | -16.3 | -14.5 | -9.0 | -20.5 | | | 3.5 Professional Services | 1.3 | 0.5 | 2.0 | -2.9 | 3.2 | 1.2 | 1.5 | 3.1 | 6.2 | 3.6 | 2.2 | 5.0 | -24.7 | | | 3.6 Trade | 4.6 | 5.8 | 4.8 | 6.7 | 4.6 | 7.5 | 6.1 | 6.1 | 9.2 | 12.5 | 11.5 | 14.0 | 14.7 | | | 3.6.1 Wholesale Trade (other than food procurement) | 2.8 | 6.8 | 8.6 | 13.6 | 5.1 | 10.0 | 11.4 | 10.9 | 16.5 | 19.9 | 21.2 | 22.6 | 26.5 | | | 3.6.2 Retail Trade | 6.0 | 5.0 | 1.7 | 1.2 | 4.1 | 5.4 | 1.9 | 2.2 | 3.2 | 6.7 | 4.2 | 7.5 | 5.7 | | | 3.7 Commercial Real Estate | 17.6 | 15.6 | 14.7 | 15.1 | 13.6 | 14.8 | 13.6 | 11.6 | 11.8 | 6.6 | 5.5 | 3.5 | 5.6 | | | 3.8 Non-Banking Financial Companies | 29.1 | 27.6 | 32.2 | 22.3 | 25.9 | 30.3 | 29.0 | 25.7 | 24.6 | 17.1 | 12.5 | 9.2 | 7.8 | | | 3.9 Other Services | -19.5 | -15.2 | -8.4 | -6.8 | -8.6 | -2.4 | -0.2 | 1.2 | -3.7 | -2.3 | 7.0 | 10.8 | 15.8 | | 4 | Personal Loans | 16.4 | 15.9 | 16.9 | 17.0 | 15.0 | 12.1 | 10.6 | 10.5 | 11.2 | 10.6 | 9.2 | 9.3 | 10.0 | | | 4.1 Consumer Durables | 68.0 | 66.2 | 41.3 | 43.4 | 47.6 | 43.7 | 43.5 | 53.3 | 62.3 | 65.1 | 22.3 | 23.8 | 26.2 | | | 4.2 Housing (Including Priority Sector Housing) | 18.3 | 17.6 | 17.5 | 17.1 | 15.4 | 13.9 | 12.9 | 12.5 | 12.3 | 11.1 | 8.5 | 8.2 | 8.5 | | | 4.3 Advances against Fixed Deposits (Including FCNR (B), NRNR Deposits etc.) | -7.7 | -7.0 | -2.2 | 6.9 | -4.1 | 0.8 | -4.3 | -8.4 | -4.0 | -0.1 | -1.6 | -2.3 | 2.6 | | | 4.4 Advances to Individuals against share, bonds, etc. | -16.5 | -17.8 | -11.2 | -11.6 | -14.9 | -15.4 | -18.5 | 8.1 | 18.5 | 24.1 | 23.9 | 24.5 | -6.6 | | | 4.5 Credit Card Outstanding | 24.1 | 25.3 | 31.6 | 33.0 | 22.5 | 4.8 | -0.8 | 2.8 | 7.9 | 7.4 | 6.3 | 4.9 | 8.0 | | | 4.6 Education | -3.3 | -3.2 | -3.1 | -3.4 | -3.3 | -3.4 | -3.3 | -3.9 | -3.8 | -5.2 | -4.5 | -2.7 | -2.6 | | | 4.7 Vehicle Loans | 4.7 | 7.2 | 9.8 | 10.3 | 9.1 | 8.6 | 6.3 | 7.1 | 8.1 | 8.4 | 8.8 | 8.4 | 10.0 | | | 4.8 Other Personal Loans | 21.1 | 19.4 | 20.7 | 20.6 | 19.7 | 13.7 | 12.3 | 12.1 | 13.3 | 13.0 | 13.2 | 14.3 | 14.9 | | 5 (memo) | Priority Sector | 3.5 | 6.1 | 4.0 | 0.3 | 5.8 | 3.0 | 2.5 | 1.9 | 4.1 | 4.4 | 4.5 | 5.9 | 8.9 | | | 5.1 Agriculture Activities | 6.3 | 5.4 | 6.1 | 5.4 | 3.8 | 4.0 | 3.4 | 2.3 | 4.8 | 4.4 | 5.5 | 7.0 | 7.9 | | | 5.2 Micro Enterprises | 6.2 | 5.7 | 8.1 | 6.7 | 7.7 | 3.3 | 1.5 | 6.5 | 5.1 | 5.4 | 6.7 | 6.8 | 6.1 | | | 5.2(a) Manufacturing | -0.1 | 0.1 | 0.5 | -0.4 | 1.7 | -2.2 | -3.4 | -3.7 | -1.9 | -1.2 | -0.1 | 0.7 | 0.5 | | | 5.2(b) Services | 9.8 | 8.9 | 12.4 | 10.7 | 11.0 | 6.2 | 4.0 | 11.9 | 8.7 | 8.8 | 10.2 | 10.0 | 9.1 | | | 5.3 Housing | 12.3 | 11.9 | 7.6 | 6.3 | 4.0 | 6.4 | 7.0 | 5.4 | 5.1 | 6.4 | 2.2 | 1.5 | 1.9 | | | 5.4 Micro-Credit | 45.7 | 47.0 | 53.8 | 50.1 | 58.7 | 28.6 | 26.1 | 24.9 | 3.9 | 2.4 | 0.8 | 0.7 | -2.6 | | | 5.5 Education Loans | -6.0 | -6.1 | -6.2 | -6.4 | -3.8 | -3.4 | -3.8 | -4.1 | -4.1 | -3.6 | -3.8 | -3.6 | -3.6 | | | 5.6 State - sponsored Orgs. for SC/ST | 13.5 | 16.9 | 7.8 | 35.1 | -2.3 | 0.8 | 3.9 | 4.2 | 6.5 | 10.2 | 25.6 | 36.0 | 51.9 | | | 5.7 Weaker Sections | 16.7 | 18.3 | 17.5 | 14.1 | 10.4 | 9.9 | 8.9 | 5.6 | 9.5 | 9.0 | 6.8 | 3.3 | 9.8 | | | 5.8 Export Credit | -28.7 | -18.1 | -22.9 | -13.2 | 3.5 | 9.7 | 20.8 | 17.1 | 7.6 | 6.2 | 2.6 | -1.4 | -2.3 | Note: 1. Data are provisional and relate to select banks which cover about 90 per cent of total non-food credit extended by all SCBs.
2. Export credit under priority sector relates to foreign banks only.
3. Micro & small under item 2.1 includes credit to micro & small industries in manufacturing sector.
4. Micro & small enterprises under item 5.2 includes credit to micro & small enterprises in manufacturing as well as services sector.
5. Priority Sector is as per old definition and does not conform to FIDD Circular FIDD.CO.Plan.BC.54/04.09.01/2014-15 dated April 23, 2015. |
| Annex-T2: Composition of Incremental Non-food Bank Credit | | (Annual Variation in Per cent) | | Serial. No | Sectors | Nov.19/ Nov.18 | Dec.19/ Dec.18 | Jan. 19/ Jan. 20 | Feb. 20/ Feb. 19 | Mar. 20/ Mar. 19 | Apr. 20/ Apr. 19 | May. 20/ May. 19 | Jun. 20/ Jun. 19 | Jul. 20/ Jul. 19 | Aug. 20/ Aug. 19 | Sep. 20/ Sep. 19 | Oct. 20/ Oct. 19 | Nov.20/ Nov.19 | | Non-food Credit (1 to 4) | 100.0 | 100.0 | 100.0 | 100.0 | 100.0 | 100.0 | 100.0 | 100.0 | 100.0 | 100.0 | 100.0 | 100.0 | 100 | | 1 | Agriculture Activities | 11.9 | 9.9 | 10.1 | 10.4 | 8.0 | 7.0 | 6.6 | 4.8 | 10.5 | 10.7 | 13.4 | 17.4 | 18.4 | | 2 | Industry (Micro, Medium and Large) | 11.0 | 7.9 | 9.7 | 3.1 | 3.4 | 7.9 | 8.2 | 11.1 | 4.0 | 2.6 | 0.0 | -9.7 | -3.6 | | | 2.1 Micro | 0.0 | 0.1 | 0.3 | -0.2 | 1.1 | -1.3 | -2.1 | -2.4 | -1.2 | -0.8 | -0.1 | 1 | 0.3 | | | 2.2 Medium | -0.4 | 0.5 | 0.4 | 0.7 | -0.1 | -1.1 | -1.0 | -1.7 | -0.6 | 0.6 | 3.1 | 4 | 4.1 | | | 2.3 Large | 11.5 | 7.3 | 9.0 | 2.6 | 2.4 | 10.4 | 11.3 | 15.1 | 5.8 | 2.9 | -3.0 | -14 | -8.0 | | 3 | Services | 18.8 | 24.0 | 28.4 | 25.9 | 31.0 | 41.8 | 44.1 | 42.7 | 40.9 | 39.2 | 43.1 | 46.4 | 39.5 | | | 3.1 Transport Operators | 1.8 | 1.8 | 1.2 | 1.2 | 1.0 | 1.3 | 1.3 | 0.9 | 1.4 | 1.4 | 1.0 | 2 | 2.9 | | | 3.2 Computer Software | 0.0 | -0.1 | 0.0 | 0.0 | 0.3 | 0.2 | 0.2 | 0.4 | 0.5 | 0.3 | 0.2 | 0 | 0.0 | | | 3.3 Tourism, Hotels & Restaurants | 0.9 | 1.0 | 1.0 | 1.1 | 1.2 | 1.0 | 1.2 | 1.2 | 1.3 | 1.4 | 1.6 | 1 | 1.5 | | | 3.4 Shipping | 0.1 | 0.1 | -0.1 | -0.1 | -0.2 | 0.0 | -0.2 | -0.2 | -0.1 | -0.2 | -0.2 | 0 | -0.3 | | | 3.5 Professional Services | 0.4 | 0.2 | 0.5 | -0.9 | 1.0 | 0.3 | 0.4 | 0.9 | 1.8 | 1.2 | 0.7 | 2 | -8.0 | | | 3.6 Trade | 3.8 | 4.9 | 3.4 | 5.6 | 4.2 | 6.1 | 5.4 | 5.5 | 8.2 | 12.3 | 11.7 | 15 | 14.1 | | | 3.6.1 Wholesale Trade (other than food procurement) | 1.0 | 2.5 | 2.7 | 5.0 | 2.2 | 3.7 | 4.5 | 4.4 | 6.6 | 8.6 | 9.3 | 10 | 11.0 | | | 3.6.2 Retail Trade | 2.8 | 2.4 | 0.7 | 0.6 | 2.0 | 2.5 | 0.9 | 1.1 | 1.6 | 3.7 | 2.4 | 4 | 3.1 | | | 3.7 Commercial Real Estate | 5.7 | 5.2 | 4.2 | 4.9 | 4.8 | 4.8 | 4.7 | 4.2 | 4.3 | 2.8 | 2.4 | 2 | 2.4 | | | 3.8 Non-Banking Financial Companies | 28.3 | 27.5 | 25.8 | 21.1 | 28.7 | 30.5 | 31.2 | 28.6 | 27.3 | 22.6 | 17.9 | 14 | 10.9 | | | 3.9 Other Services | -22.1 | -16.5 | -7.4 | -7.0 | -9.9 | -2.4 | -0.2 | 1.2 | -3.8 | -2.6 | 7.7 | 12 | 16.0 | | 4 | Personal Loans | 58.3 | 58.2 | 51.8 | 60.6 | 57.6 | 43.2 | 41.0 | 41.5 | 44.6 | 47.5 | 43.4 | 45.9 | 45.8 | | | 4.1 Consumer Durables | 0.4 | 0.4 | 0.3 | 0.3 | 0.5 | 0.4 | 0.5 | 0.5 | 0.6 | 0.7 | 0.2 | 0 | 0.3 | | | 4.2 Housing (Including Priority Sector Housing) | 34.0 | 33.7 | 28.1 | 31.9 | 30.9 | 26.2 | 26.3 | 26.1 | 25.8 | 26.2 | 21.5 | 22 | 20.7 | | | 4.3 Advances against Fixed Deposits (Including FCNR (B), NRNR Deposits etc.) | -0.9 | -0.9 | -0.2 | 0.8 | -0.6 | 0.1 | -0.5 | -1.0 | -0.5 | 0.0 | -0.2 | 0 | 0.3 | | | 4.4 Advances to Individuals against share, bonds, etc. | -0.2 | -0.2 | -0.1 | -0.1 | -0.2 | -0.1 | -0.2 | 0.1 | 0.2 | 0.2 | 0.2 | 0 | -0.1 | | | 4.5 Credit Card Outstanding | 3.5 | 3.7 | 3.8 | 4.5 | 3.4 | 0.7 | -0.1 | 0.5 | 1.3 | 1.4 | 1.3 | 1 | 1.6 | | | 4.6 Education | -0.4 | -0.4 | -0.3 | -0.4 | -0.4 | -0.4 | -0.4 | -0.5 | -0.4 | -0.7 | -0.6 | 0 | -0.3 | | | 4.7 Vehicle Loans | 1.6 | 2.5 | 2.8 | 3.4 | 3.2 | 2.8 | 2.2 | 2.5 | 2.9 | 3.3 | 3.6 | 4 | 4.0 | | | 4.8 Other Personal Loans | 20.3 | 19.3 | 17.3 | 20.2 | 20.6 | 13.6 | 13.3 | 13.2 | 14.8 | 16.3 | 17.5 | 20 | 19.3 | | 5 (memo) | Priority Sector | 15.6 | 27.9 | 15.5 | 1.2 | 27.4 | 13.1 | 11.8 | 9.1 | 19.5 | 23.6 | 25.0 | 34.0 | 45.8 | | | 5.1 Agriculture Activities | 11.5 | 10.2 | 9.4 | 9.7 | 7.2 | 7.1 | 6.5 | 4.5 | 9.3 | 9.5 | 12.3 | 16 | 17.1 | | | 5.2 Micro Enterprises | 10.6 | 10.0 | 11.9 | 11.3 | 14.2 | 5.6 | 2.7 | 12.2 | 9.3 | 10.9 | 14.2 | 15 | 12.3 | | | 5.2(a) Manufacturing | 0.0 | 0.1 | 0.3 | -0.2 | 1.1 | -1.3 | -2.1 | -2.4 | -1.2 | -0.8 | -0.1 | 1 | 0.3 | | | 5.2(b) Services | 10.7 | 9.9 | 11.6 | 11.5 | 13.1 | 7.0 | 4.8 | 14.6 | 10.5 | 11.8 | 14.3 | 14 | 12.0 | | | 5.3 Housing | 8.6 | 8.5 | 4.7 | 4.5 | 3.0 | 4.5 | 5.3 | 4.2 | 3.9 | 5.5 | 2.0 | 1 | 1.6 | | | 5.4 Micro-Credit | 1.8 | 2.0 | 1.8 | 2.0 | 2.4 | 1.3 | 1.2 | 1.3 | 0.2 | 0.1 | 0.1 | 0 | -0.2 | | | 5.5 Education Loans | -0.6 | -0.6 | -0.5 | -0.6 | -0.4 | -0.3 | -0.4 | -0.4 | -0.4 | -0.4 | -0.4 | 0 | -0.4 | | | 5.6 State - sponsored Orgs. for SC/ST | 0.0 | 0.0 | 0.0 | 1.8 | 0.0 | 0.0 | 0.0 | 0.0 | 0.0 | 0.0 | 0.0 | 0 | 0.0 | | | 5.7 Weaker Sections | 17.2 | 19.2 | 15.3 | 14.2 | 11.9 | 10.8 | 10.4 | 6.8 | 11.2 | 11.9 | 9.5 | 5 | 13.0 | | | 5.8 Export Credit | -0.9 | -0.6 | -0.6 | -0.4 | 0.1 | 0.2 | 0.5 | 0.4 | 0.2 | 0.2 | 0.1 | 0 | -0.1 | Note: 1. Data are provisional and relate to select banks which cover about 90 per cent of total non-food credit extended by all SCBs.
2. Export credit under priority sector relates to foreign banks only.
3. Micro & small under item 2.1 includes credit to micro & small industries in manufacturing sector.
4. Micro & small enterprises under item 5.2 includes credit to micro & small enterprises in manufacturing as well as services sector.
5. Priority Sector is as per old definition and does not conform to FIDD Circular FIDD.CO.Plan.BC.54/04.09.01/2014-15 dated April 23, 2015. |
| Annex- T 3: Estimated Regression Coefficients | | Variable | Non - food credit | Industry | Services | Agriculture | | Coef. | P-value | Coef. | P-value | Coef. | P-value | Coef. | P-value | | cons | 18.82 | 0.00 | 19.29 | 0.01 | 31.91 | 0.00 | 31.89 | 0.00 | | Δcreditt-1 | -0.05 | 0.66 | 0.04 | 0.77 | -0.16 | 0.22 | -0.37 | 0.01 | | Δcreditt-2 | 0.34 | 0.01 | 0.38 | 0.00 | 0.36 | 0.00 | -0.00 | 0.97 | | Δgdpnt-1 | | | 0.30 | 0.08 | -0.24 | 0.37 | 0.03 | 0.84 | | Δgdpnt-2 | 0.07 | 0.61 | | | | | | | | callt-1 | -1.13 | 0.04 | -1.61 | 0.02 | | | -0.51 | 0.48 | | callt-2 | | | | | -2.45 | 0.03 | | | | gnpat-1 | -0.58 | 0.09 | -1.18 | 0.04 | -0.24 | 0.64 | -2.00 | 0.00 | | dummy | | | | | -30.23 | 0.00 | -20.5 | 0.00 | | R2 | 0.47 | | 0.61 | | 0.37 | | 0.40 | | | LM Test (P-value) | 0.61 | | 0.43 | | 0.77 | | 0.36 | | | ARCH Test(P-value) | 0.84 | | 0.66 | | 0.85 | | 0.29 | | | Note: Data relate to select banks, which cover about 90 per cent of total non-food credit extended by all SCBs. The estimation is based on the quarterly data for the period 2007-08: Q1 through 2019-20: Q4. |
|