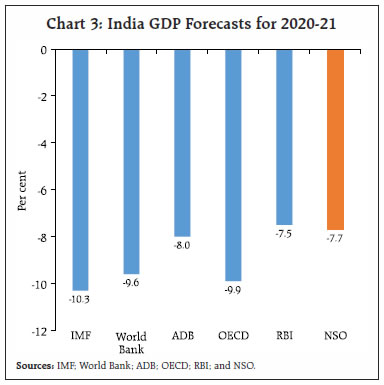
2020 turned out to be a year in which everything changed. The year 2021 has commenced with countries across the world in a massive vaccination drive. In India, recent shifts in the macroeconomic landscape have brightened the outlook, with GDP in striking distance of attaining positive territory and inflation easing closer to the target. Financial markets remain ebullient with EMEs receiving strong portfolio inflows and India on track for receiving record annual inflows of foreign direct investment. What a year 2020 turned out to be! It began like any other, just a day longer than 2019, with what looked like pneumonia reported to the World Health Organization (WHO) from a distant wet market in Wuhan, China. By the end of the year, COVID-19 had officially infected 81 million people, and possibly 500 million more were never diagnosed (The Economist, December 19, 2020). It caused 1.8 million recorded deaths, but many hundreds of thousands have gone unrecorded. The two world wars and the Spanish flu caused far more deaths, but COVID-19 has altered people’s daily lives in ways that these events did not. Millions of survivors still struggle with the scars and exhaustion left by the virus, and the world is witnessing an unparalleled scale of suffering, poverty (according to the UN, over 200 million people will be thrust into extreme poverty), inequality and danger. Children have lost education, graduates placements, labour has endured forced migration, and people of all ages have faced loneliness. Unemployment has soared and so have stock markets. Foreign investors have rushed into emerging markets – while US$ 90 billion left emerging market economies (EMEs) in March alone, portfolio flows have staged a return since then which accelerated to US$ 83.4 billion in the month of November and in December, US$ 16.6 billion has poured into debt and US$ 29.3 billion into equities (IIF, 2021) (Chart 1). Among EMEs, China and India pulled flows on account of growth prospects. 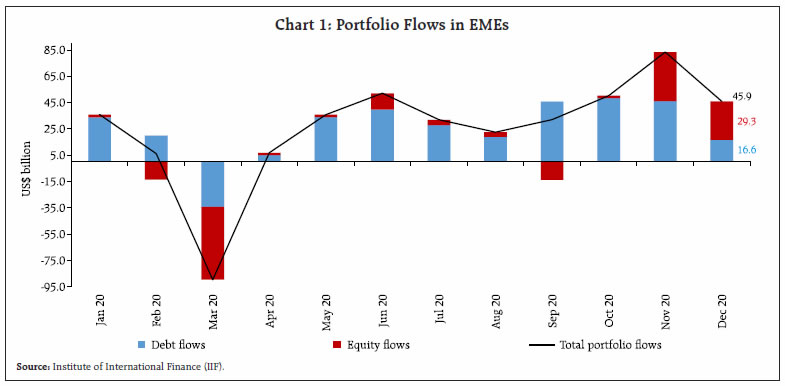 As the optimism in projections sobers, world output could be at least 7 per cent lower than without COVID-19 (The Economist, January 9, 2021) – the biggest slump since the second world war, world merchandise trade by 9.2 per cent (WTO, 2020) and world trade in services by 15 per cent (UNCTAD, 2020). History shows that social unrest surges 14 months after a pandemic and peaks at 24 months (IMF, 2020). The clear blue skies during lockdowns revealed that within the fast-moving COVID-19 crisis is a slow-moving climate crisis, impervious to populist denial, global in its disruptive capacity and far costlier. Yet, impossibly, it appears that the world is rounding the corner on this once-in-a-century year that changed everything. As 2021 arrived, more than 12 million people had received their first doses of the vaccine (Chart 2). Newspapers have reported that 8.25 billion doses of vaccines have been secured by various countries through advance contracts (COVID-19 vaccines are two-dose regimens). On January 3, 2021 India formally approved the emergency use of two vaccines and on January 16, it launched the world’s biggest vaccination drives, with plans to inoculate about 300 million people on a priority list this year. It is reported that India has secured 1.2 billion advance doses, covering 85 per cent of the population (Bloomberg, 2020). Four other features set India apart from the rest of the world, increasing the probability that our recovery may overtake most projections, as this article has consistently maintained. The 27-indicator economic activity index (EAI) (Kumar, 2020) has updated its nowcast for Q3:2020-21 and estimates the quarter’s real GDP growth at 0.1 per cent, as expected in the December 2020 issue. This is also reflected in the first advance estimates of national income for 2020-21 released by the National Statistical Office (NSO) on January 7 in which real GDP growth in 2020-21 is estimated at (-) 7.7 per cent as against (-) 10.3 per cent by the International Monetary Fund (IMF) in October 2020 and (-) 7.5 per cent by the monetary policy committee (MPC) in December 2020 (Chart 3). First, India has so far succeeded in ducking the second wave of COVID-19. Moreover, since mid-September, India has ‘bent it like Beckham’ – by the end of 2020, the number of active cases had fallen to 2,54,254 from a peak of 10,17,754 on September 17. The recovery rate in India has improved to 96.1 per cent, the second highest in the world. The mortality rate is 1.4 per cent, lower than the world death rate (2.2 per cent), and the second lowest among countries with over a million infections (Chart 4). 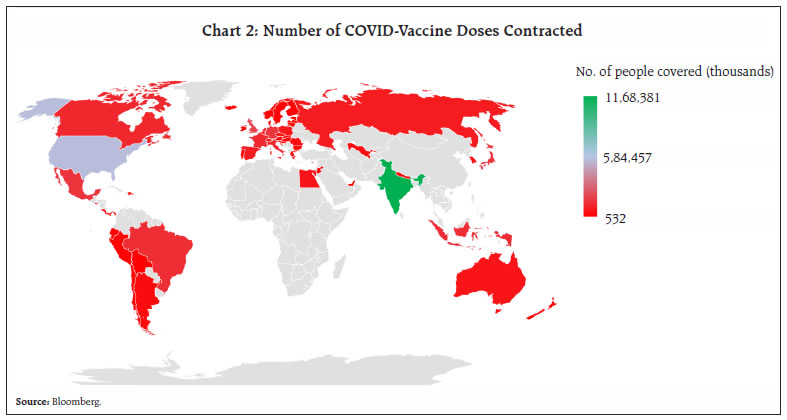
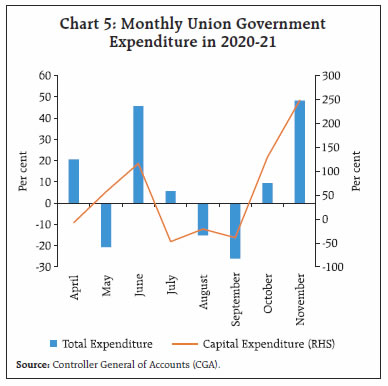
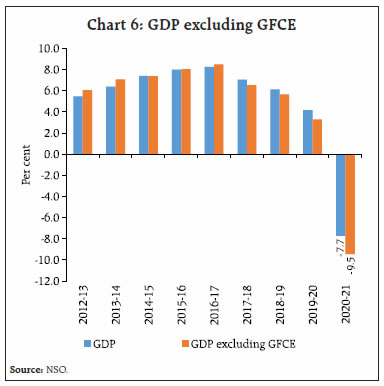
 Second, after a hiatus of four months during which total expenditure of the central government went into contraction or remained muted, it rejoined the celebration of the recovery in November 2020, surging by 48.3 per cent on a year-on-year (y-o-y) basis. Within this expenditure push, growth-nurturing capital expenditure shrugged off a three-month contraction and expanded by 248.5 per cent, close to half of which is due to increase in transfers to states for capex in line with Aatma Nirbhar 2.0 announcements (Chart 5). At the sub-national level, information for 20 states show that the growth in capital expenditure turned positive during October 2020 after contracting consecutively for 8 months. These are significant developments from the point of view of the economy gaining a stronger foothold, because government final consumption expenditure (GFCE) has provided valuable counter-cyclical support to GDP continuously from Q4:2016-17. Without this support, real GDP growth of 7.0 per cent in 2017-18 would have been only 6.5 per cent, while it would have been 5.7 per cent instead of 6.1 per cent in 2018-19 and 3.3 per cent instead of 4.2 per cent in Q1:2019-20 (Chart 6). In Q1:2020-21 when the full brunt of COVID-19 took real GDP down by an unprecedented 23.9 per cent, GFCE prevented an even more precipitous fall of 29.3 per cent. 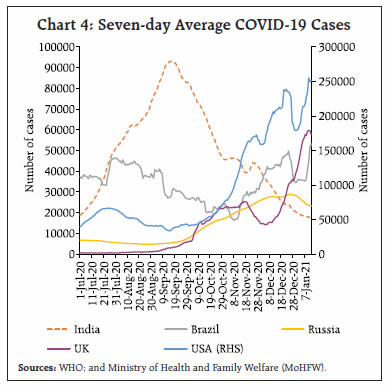
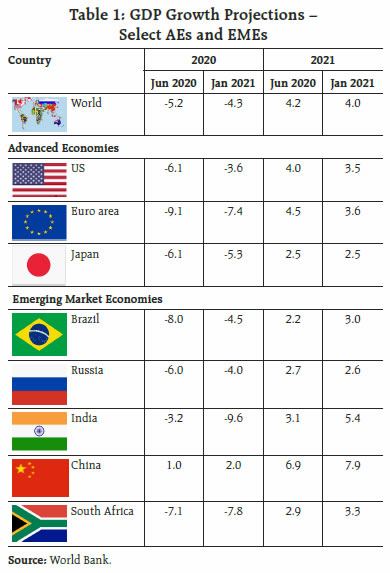
 Third, merchandise imports finally emerged out of contraction over 9 consecutive months and grew by 7.6 per cent (y-o-y) in December 2020 (Chart 7). The rebound in imports was broad-based, with as many as 20 out of 30 major commodities registering expansion. Many of these items are of the nature of intermediate goods in supply chains, which augurs well for domestic industrial activity and import-intensive exports. This suggests that moribund absorptive capacity of the economy is coming back to life, rekindled by domestic demand. Surges of capital inflows, which the Indian economy is enjoying currently as a preferred destination, may from hereon, support investment and growth and even crowd-in domestic saving instead of passively flowing back uphill through reserve accumulations. The days of the tail wagging the dog1 of India’s balance of payments may finally be drawing to a close. 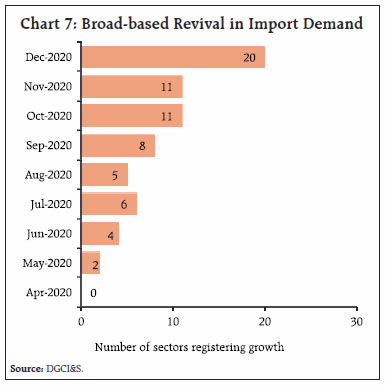 Fourth, bank credit demand has increased at a pace above 6 per cent, reversing a 5-month stretch of sub-6 per cent growth. On top of robust credit flow to agriculture, micro and small enterprises and the services sector led by transport, trade and tourism have powered the turning around of the credit cycle. Set against this backdrop, the remainder of the article is structured into five Sections. Section II captures in a nutshell the rapidly evolving developments in the global economy. The underlying impulses in the domestic economy are distilled in Section III. Section IV evaluates financial conditions, while the last Section puts out some perspectives. II. The Global Setting It was a lockdown Christmas for a swathe of advanced economies (AEs) as a new and more virulent strain of the virus and the rapid spread of the second/ third wave dampened not just the season’s cheer but also the optimism generated by the vaccine. Disruptions from the pandemic in a few EMEs have turned out to be more severe than previously anticipated, with the brunt being faced by commodity exporters. Overall, following the initial rebound since mid-2020, the global economy recovery has slowed. The improvement in manufacturing activity and trade has been marred by depressed services sectors. The fall in global investment has been pronounced. While financial conditions remain ultra-easy, financial fragilities are mounting, leading to fears that the COVID-19 crisis would eventually morph into a financial crisis (Reinhart, 2020). With January, the season of projection updates has arrived, and the World Bank has led off. In its latest Global Economic Prospects (GEP) released on January 5, 2021, the global economy is estimated to have contracted by 4.3 per cent in 2020 – AEs by 5.4 per cent; EMEs ex-China by 5.0 per cent (Table 1). In 2021, global output is forecast to expand by 4 per cent but remain 5.3 per cent below pre-pandemic projections, or by about US$ 4.7 trillion. AEs and EMEs ex-China will roughly look alike in growth profiles, eking out modest expansions of 3.3-3.4 per cent. India is expected to expand by 5.4 per cent, a pale shadow of its historical record. It is estimated that COVID-19 will cause a loss of US$ 10.3 trillion in world GDP in 2020 and 2021 (Chart 8). Among the developing economies, India will suffer the biggest loss of US$ 950 billion (The Economist, January 9, 2021). The pandemic may exacerbate risks around the accumulation of debt on the one hand and a prolonged slowdown in potential output on the other. Consequently, downside risks to projections predominate the horizon. 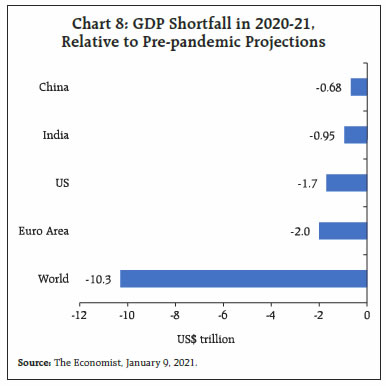
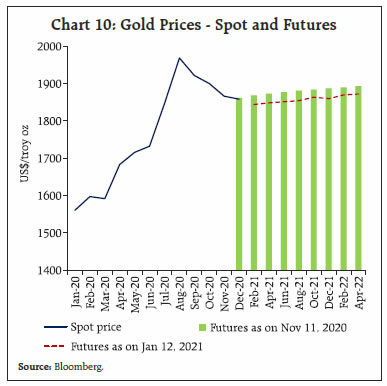
 On the price situation, economies are struggling to meet inflation targets, AEs from below and several EMEs from above (Table 2). Food prices have registered a surge, particularly in EMEs, owing to a confluence of factors working in conjunction, viz., governments shoring up their food reserves, logistical hassles, and La Nina adversely affecting crop production in Latin America2. The Food and Agriculture Organization’s food price index rose by 3.1 per cent in 2020, with the monthly index at a six-year high in December. 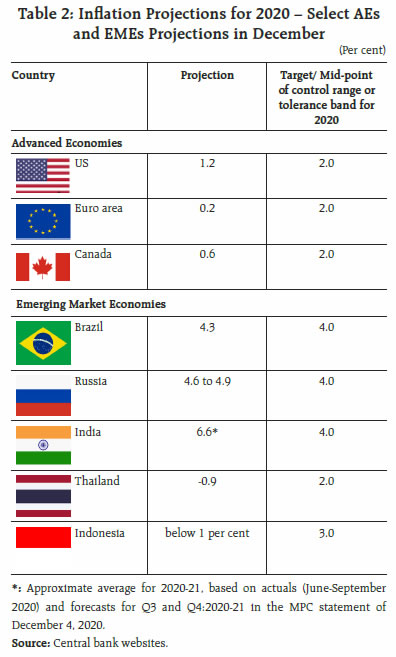 Meanwhile, crude oil prices continued to rise in December and the first half of January on the back of positive developments on the vaccine front and extension of production cuts by organization of the petroleum exporting countries (OPEC) plus. At an average of US$ 49.9 per barrel in December, Brent was 15.5 per cent dearer in December (Chart 9). The average Brent price in 2020, however, was about 34 per cent lower than in 2019. The World Bank estimates oil demand to have declined by a historic 9 per cent in 2020. Gold wrapped up a phenomenal year, which saw bullion prices scaling an all-time high in August, with gains of 25.1 per cent, following up the 18.3 per cent ascent in the previous year. Safe haven demand and unprecedented monetary accommodation made bullion a top-performing asset in 2020. Gold prices have corrected in 2021 so far with sell-offs due to waning safe haven demand as also due to the dollar gaining strength (Chart 10). Basking in gold’s glory, silver had a good year too in 2020. Base metals, which had seen a sharp dip in the initial months of the year, recovered strongly in H2:2020, and ended the year in gains. 
 The global composite purchasing managers’ index (PMI) moderated to 52.7 in December, mainly on account of the services PMI sliding to a five-month low of 51.8. The good news is that it has remained in expansion zone for the whole of H2:2020. The global manufacturing PMI in December maintained the 33-month high level of November. Industrial output has risen continuously in H2:2020 after the severe decline observed between February and June (Chart 11). Meanwhile, price momentum continues to build incipiently - input prices rose in December at their highest pace since May 2011. The volume of world merchandise trade showed sequential improvement of 11.6 per cent in Q3:2020 after a contraction of 12.7 per cent in the previous quarter, according to the World Trade Organization (WTO). There was, however, a contraction of 5.6 per cent in Q3 on a y-o-y basis (Chart 12). This effectively means that the volume of merchandise trade during the first three quarters of 2020 was 8.2 per cent lower than in the corresponding period of the previous year, though still favourable vis-à-vis the WTO’s estimate of a 9.2 per cent contraction in world trade in 2020 as a whole. The World Bank estimates that world trade volume (goods and non-factor services) declined by 9.5 per cent in 2020 and the level of trade uncertainty remains higher than trend, notwithstanding recent developments such as the African Continental Free Trade Area agreement and the Regional Comprehensive Economic Partnership. 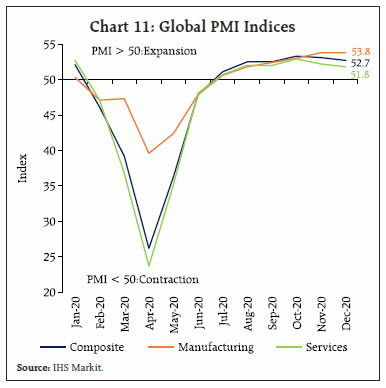
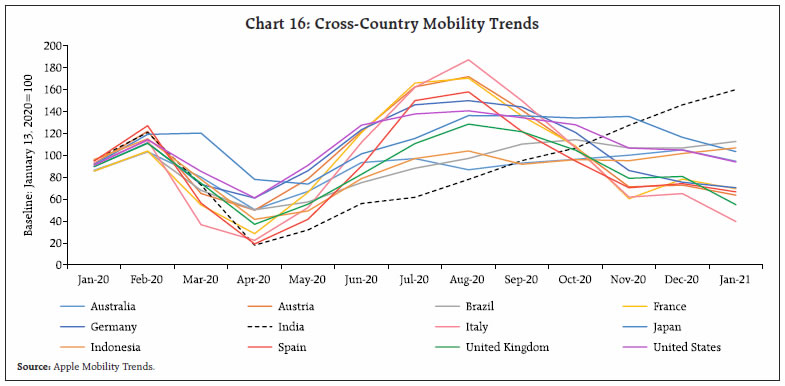
 The improving macroeconomic outlook and rapid vaccination led equity markets to build on the record gains registered in November 2020, also benefitting from the Brexit deal and the US stimulus towards end-December. Despite the rising tide of valuations, stock markets in the UK, EU, Indonesia, Thailand and Chile, ended the year in the red. On the other hand, surging gains in stock markets of EMEs pulled in strong portfolio flows. The total portfolio flows into EMEs in December were US$ 45.9 billion, and for the year as a whole, they amounted to US$ 313.6 billion (IIF, 2021). Reflation trade and risk-on sentiments caused bond yields in the AEs to move up. On the other hand, bond yields in EMEs continued to ease, reflecting the strong portfolio flows (Chart 13). The upbeat outlook engendered by the COVID-19 vaccine kept the US dollar on a downward slide in December and currencies of AEs and EMEs rallied to multi-year highs. Overall, the dollar index weakened by 2.1 per cent in December, ending the year 2020 lower by 6.7 per cent. As a corollary, the Morgan Stanley Capital International Emerging Markets (MSCI-EM) index appreciated by 1.6 per cent in December and by 3.3 per cent over the year as a whole. In 2021 so far, however, the dollar has strengthened, mostly against AE currencies such as the euro. 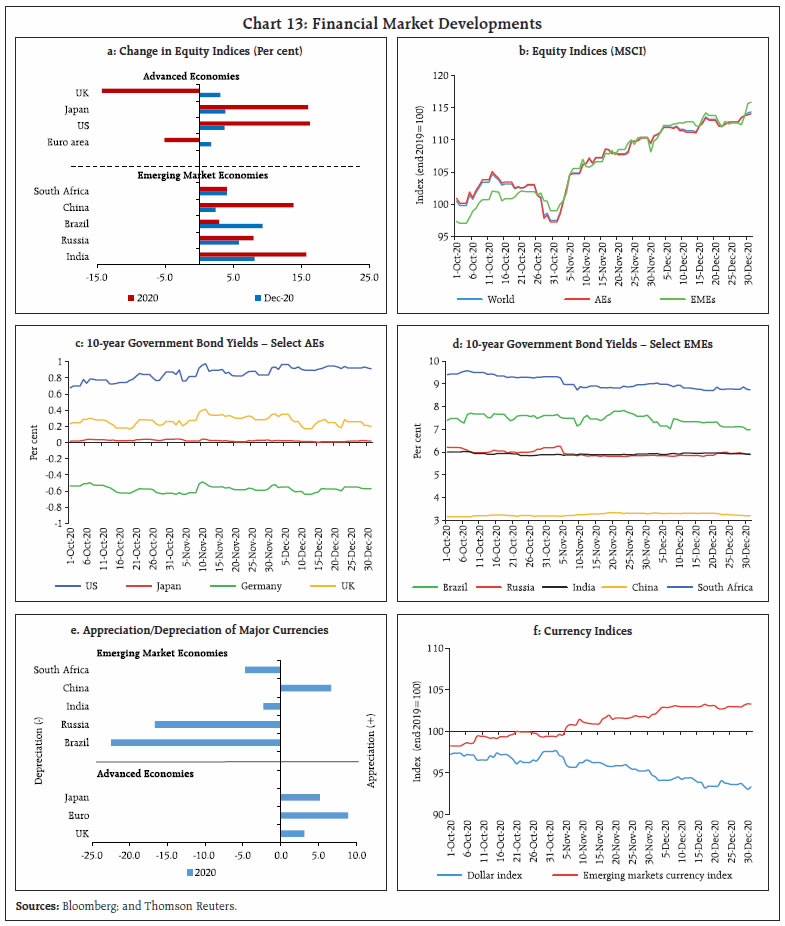 On the monetary policy front, amidst the general tendency among central banks of staying on hold on interest rates while engendering abundant liquidity conditions, there was a further expansion of monetary stimulus by the European Central Bank and the Bank of Japan in December. The Federal Reserve gave forward guidance of continuing asset purchases till it made progress on maximum employment and price stability goals. On the contrary, the central bank of Turkey effected a third policy rate hike in four months, battling high and surging inflation (Chart 14). As the global economy steps into the new year, the near-term outlook remains clouded by a considerable amount of uncertainty as AEs struggle with virulent outbreaks of infections and stricter lockdowns, and EMEs stare at poverty levels last seen in 2017. III. Domestic Developments Implicit in the January 7 GDP release is what this article has been anticipating – barring the visitation of another wave, the worst is behind us (Chart 15). Recent high frequency indicators suggest that the recovery is getting stronger in its traction and soon the winter of our discontent will be made glorious summer3. Cross-country comparison indicates that India is on the move, ahead of other economies (Chart 16). The six largest states – Maharashtra, Tamil Nadu, Uttar Pradesh, Karnataka, Gujarat and West Bengal – recorded 87 per cent of normal footfalls in public places, the best levels so far in the pandemic (Mint tracker). Domestic trading activity as reflected in issuance of E-way bills expanded at a brisk pace, even over a high base, posting a growth of 15.9 per cent y-o-y – intra-state by 17.3 per cent and inter-state by 13.8 per cent. In fact, the number of E-way bills issued during December 2020 was the highest, suggesting that the recovery is no longer aloft on the fleeting tailwinds of festival spending but is rising Phoenix-like on the wings of an intrinsic momentum (Chart 17). 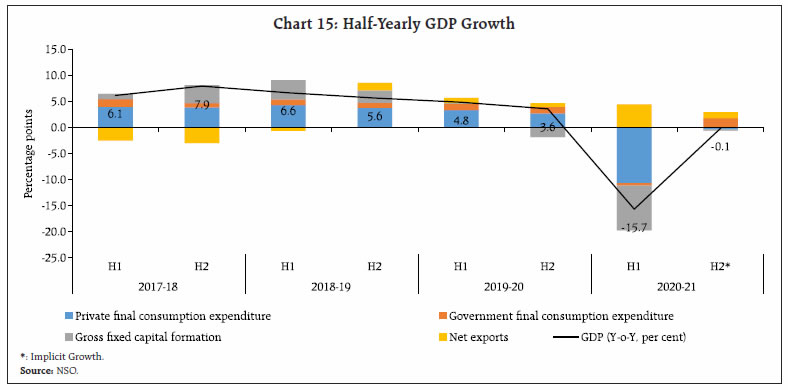
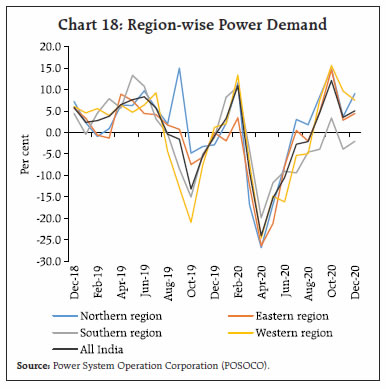
 Aggregate Demand Aggregate demand conditions have either consolidated recent gains or vaulted up on strengthening pace in December 2020. Electricity consumption expanded at 5.0 per cent y-o-y, maintaining its growth for the fourth successive month (Chart 18). Northern and central states such as Madhya Pradesh (15 per cent), Rajasthan (12 per cent), Bihar (14 per cent), Punjab (12 per cent) and Uttar Pradesh (10 per cent) experienced a surge in power demand in December due to increased heating load. Mercury levels plunged to multi-year lows as an unusually intense winter took hold with La Nina cooling the waters of the Pacific and a cold wave gripped most of upper India, interspersed with sporadic unseasonal showers in these states (Chart 19). 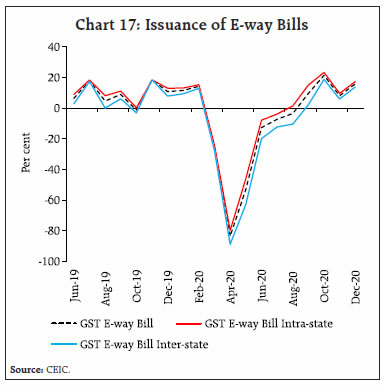
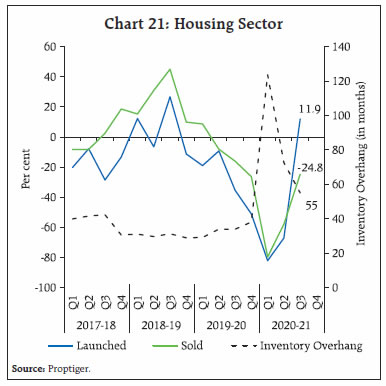
 Domestic spending is normalising rapidly, and in sync, collections under the goods and services tax (GST) surged to an all time high of ₹1.15 lakh crore in December, breaking out of the ₹1 lakh crore ‘barrier’ for the third month in succession, and higher by 11.6 per cent over a year ago (Chart 20). Business activity is regenerating in an ‘unlock’ mood, incentivised in substantial measure by a simplified return filing system. 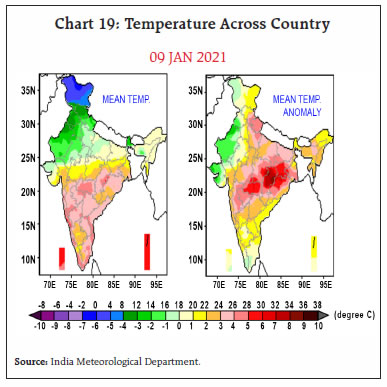 Consumer confidence is regaining its groove. The Refinitiv-Ipsos consumer sentiment index inched up by 2.1 percentage points in December. Improvement was recorded on employment conditions, personal finance, investment climate and confidence in the outlook for the economy. This is corroborated by Dun and Bradstreet’s report that consumer confidence will improve from January 2021, peak in July and continue till September ahead of the next festival season. Purchasing behaviour is expected to reveal a preference online and offline towards health and well-being products, ahead of a bigger shift to value added goods and essentials via digital and omni-channel sales. Alliances between e-commerce players and kirana stores are expected to expand to increase service delivery to meet rising demand. Upbeat consumer sentiment is also expressing itself in housing. There are signs of the housing sector turning around, with a sharp uptick in Q3:2020-21 in sales of residential units - almost double the level of the preceding quarter - supported by favourable interest rates, still restrained housing prices, steep discounts by developers to clear inventory, and reduction in stamp duty by a few states (Chart 21). The revival in consumer spending is also evident in India’s fast- moving consumer goods (FMCG) market, which expanded by 17.0 per cent4. 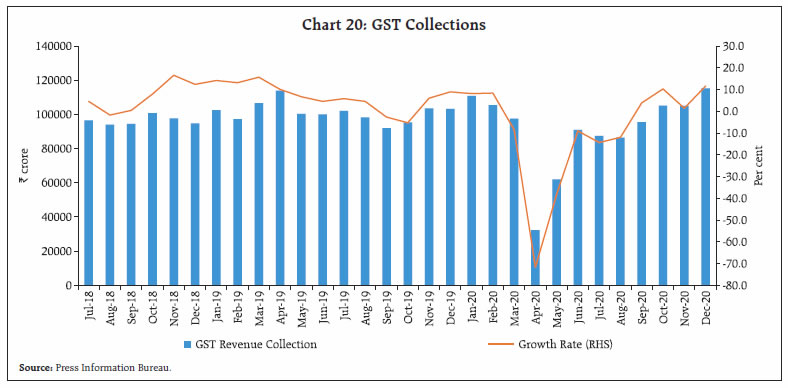
 Labour market conditions are also improving pari passu, with a gradual pick up in employment across space and time, as indicated by the household survey of the Centre for Monitoring Indian Economy (CMIE). The labour force participation rate recovered to 40.06 in December from a low of 35.57 in April 2020 (Chart 22). With gradual lifting of inter-state movement restrictions, labour force participation rates across states have picked up to around pre-pandemic levels with the exception of Delhi, Gujarat, Telangana and Tripura. Some states like Rajasthan, Assam, Madhya Pradesh and Uttar Pradesh have notched up swifter recoveries, with labour force participation rates recorded in December rising higher than those seen in the pre-lockdown period (Chart 23). Under the Mahatma Gandhi National Rural Employment Act (MGNREGA), around 26.5 million households sought employment in December – 16.5 per cent higher than in the preceding month and over 55.5 per cent a year ago. By the close of December, 130 per cent of the budgeted amount was spent.  It is likely that the employment situation would brighten even more in the coming months. According to staffing solutions provider TeamLease, hiring by information technology (IT) firms across various skill sets is likely to increase by 10-12 per cent in 2021. As mentioned earlier, a heartening development that improves the prospects of recovery is the vigorous resumption of government spending. The growth-giving role of government final consumption expenditure is invaluable at a time when all other components of GDP are in deep retrenchment under the metastasis purveyed by the pandemic. It is difficult to fully appreciate the importance of this development for the near-term outlook without a close understanding of the underlying dynamics that were etched out for the first time this year in the December 2020 issue of the Bulletin in an article titled ‘Government Finances 2020-21: A Half Yearly Review’ (RBI, 2020) which, incidentally, fulfils India’s compliance with the Special Data Dissemination Standard (SDDS) of the IMF. 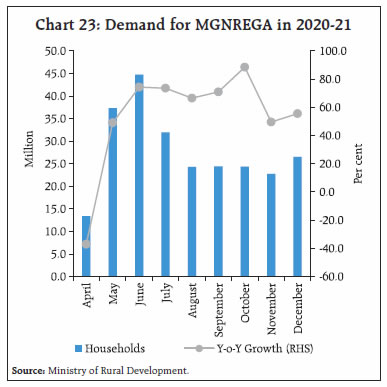 The November 2020 edition of this article vivisected and laid out the ‘system’ in the stimulus given by the centre. Earlier, the Reserve Bank’s report on State Finances (RBI, 2020) showed how the states assumed the mantle of frontline warriors in the defence against the pandemic with several setbacks but also with some shining successes that caught the attention of the world. Underneath this logged chronicle, the reality is that the pandemic has inflicted a ’scissor effect’ on government finances. On the one hand, it stretched expenditure on account of the fiscal support to the economy that was completely unanticipated at the time of drawing up budgets for 2020-21. On the other, there was contraction in revenues as activity in the economy went into catatonic withdrawal with lockdowns and other containment measures. As a result, the general government gross fiscal deficit (GFD) rose to 14.5 per cent in H1:2020-21, with Q1 recording a spike to 22.0 per cent that necessitated consolidation in Q2 in the form of rationalisation and reprioritisation of expenditure (Chart 24). Going forward, two positive features are going to shape up the fiscal landscape in H2. First, the general government GFD-GDP ratio is likely to moderate to 10.4 per cent (within a 50 per cent confidence band of 9.7-10.9 per cent). This development will be revenue-driven as the war effort of H2 bears fruit and receipts return to positive territory. Second, the quality of the fiscal deficit is also likely to be better in H2 as a substantial part of investment-oriented stimulus under Aatma Nirbhar 2.0 and 3.0 (announced in October and November 2020, respectively) is expected to fructify in this period. This is already evident in the November 2020 monthly data on capex; however, both centre and states must resist resorting to large scale expenditure cuts to allay fiscal concerns. Turning to external demand, India’s merchandise exports have reached pre-COVID-19 levels and exhibited a growth of 0.1 per cent in December 2020. Non-oil exports actually expanded by 5.6 per cent, marking the fourth consecutive month of positive growth. More noteworthy was the pickup in merchandise imports, which have rebounded by 7.6 per cent in December 2020 after a protracted nine months of contraction. The revival was led by gold, electronic goods and vegetable oils. Rising imports of pearls and precious stones, machinery, electronic goods and textiles reflect the revival of domestic activity as they are of the nature of intermediate goods in supply chains. This also augurs well for exports going forward. Even in the case of oil imports, moderation was seen in the rate of contraction, with oil imports declining by only 10.6 per cent in December as against a sharp contraction of 43.4 per cent in November. With robust growth in imports, the trade deficit scaled to a seventeen- month high at US$ 15.4 billion in December (Chart 25). 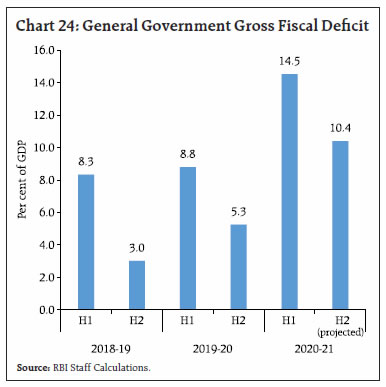 The faster revival seen in non-oil exports can be attributed to shipments of drugs and pharmaceuticals, agricultural items and iron ore, all of which have displayed resilience in the face of the pandemic and the massive contraction in world trade. As vaccination gathers pace across the globe, Indian pharma firms will exploit the edge they have in terms of the largest capacity globally in vaccine manufacturing - India is already manufacturing 60 per cent of the vaccines sold globally. Furthermore, the production linked incentive (PLI) scheme introduced for bulk drugs and medical devices has received a positive response and is expected to support pharmaceutical and medical exports going forward, while reducing India’s vulnerability to supply shocks in respect of raw materials and intermediates. 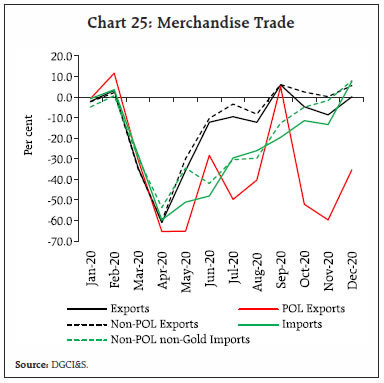 The extension of benefits under the Scheme for Remission of Duties and Taxes on Exported Products (RoDTEP) to all export goods with effect from January 1, 2021 is expected to scale up the competitiveness of India’s exports5. The risks to India’s export prospects stem from the shortage of container supplies caused by supply chain disruptions across the globe, reduced capacity of shipping lines, empty containers getting stranded at ports during lockdowns, reduction in port manpower limiting the speed of cargo handling, and consequent congestion in the ports. For Indian exports in particular, the situation was aggravated by the huge congestion at Colombo port, which acts as the transhipment hub for Indian cargo. The result has been that a sizeable chunk of cargo traffic from Colombo has been diverted to Kochi port. This has led to a surge in freight costs as also reflected in the rising Global Container Freight Index during November-December 2020 (Chart 26). India’s current account remained in surplus for the third consecutive quarter in July-September 2020 (2.4 per cent of GDP), although it moderated in tandem with the resumption of domestic demand (Chart 27). While the coexistence of surpluses in the current and capital accounts of the balance of payments strengthens the buffer provided by foreign exchange reserves, India continues to contend with sluggish absorptive capacity. The silver lining is that the current account surplus has started to shrink in Q2 and may moderate further in H2:2020-21. Aggregate Supply Aggregate supply conditions strengthened through December 2020 on the back of resilience in agriculture and revival in manufacturing activity. Services sector activity too seems to be turning around, though contact-intensive services remain subdued and below pre-COVID levels. Agriculture remains unscathed by the pandemic. Sowing of major crops has exceeded the normal acreage levels. Rabi sowing covered an area of 651.9 lakh hectare by January 15, 2021, 1.6 per cent higher than in the preceding year, and surpassing the full season normal acreage (Table 3). The reservoir levels stood at 68 per cent of full capacity as on January 14 as against the decennial average of 56 per cent; this is an important force multiplier for the rabi season (Chart 28). Wheat – the primary rabi staple – has recorded an increase in sowing acreage (2.0 per cent), mainly due to higher sowing in major producer states, notably Haryana (1.2 per cent) and Madhya Pradesh (12.7 per cent). Pulses and oilseeds have also registered an impressive turnaround in acreage. With record kharif production, procurement of kharif rice at 51.3 million tonnes was 26.2 per cent higher than a year ago, taking the cereals (rice and wheat) buffer stock to 3.7 times the norm by January 1, 2021. 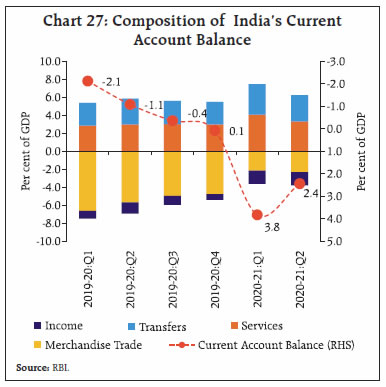
Table 3: All India Crop Situation - Rabi (2020-21)
as on January 15, 2021. | | (Area in lakh hectares) | | Crop Name | Normal area | Sowing as on date | Percentage variation | | Full season | As on date | This year
(2021) | Last year
(2020) | Over normal as on date | Over last Year | | 1. Wheat | 303.3 | 306.8 | 337.1 | 330.6 | 9.9 | 2.0 | | 2. Rice | 41.8 | 19.7 | 21.0 | 20.0 | 6.8 | 5.0 | | 3. Coarse Cereals | 57.1 | 52.9 | 49.1 | 53.5 | -7.2 | -8.2 | | a. Jowar | 33.4 | 30.3 | 26.5 | 29.4 | -12.7 | -10.0 | | b. Barley | 6.4 | 7.4 | 6.8 | 7.6 | -7.5 | -10.5 | | c. Maize | 17.4 | 14.5 | 14.8 | 15.1 | 4.1 | -4.9 | | 4. Total Pulses | 144.9 | 152.4 | 162.1 | 158.8 | 6.4 | 2.1 | | a. Gram | 92.8 | 98.9 | 109.1 | 105.5 | 10.4 | 3.5 | | b. Lentil | 14.2 | 16.3 | 16.4 | 16.0 | 1.1 | 2.5 | | c. Peas | 8.8 | 10.4 | 10.6 | 10.9 | 1.9 | -2.3 | | d. Kulthi (Horse Gram) | 2.2 | 4.5 | 3.8 | 5.1 | -15.8 | -26.0 | | e. Urad | 8.9 | 7.6 | 7.6 | 7.1 | -0.2 | 6.5 | | f. Moong | 9.9 | 5.4 | 5.2 | 5.5 | -3.5 | -4.2 | | g. Lathyrus | 4.0 | 3.5 | 3.1 | 3.1 | -11.7 | 0.0 | | I. Total Foodgrains (1+2+3+4) | 547.1 | 531.8 | 569.4 | 562.9 | 7.1 | 1.1 | | 5. Oilseeds | 73.2 | 79.2 | 82.6 | 79.0 | 4.3 | 4.6 | | a. Rapeseed & Mustard | 59.4 | 79.2 | 73.2 | 68.6 | -7.5 | 6.7 | | b. Groundnut | 7.3 | 4.6 | 4.3 | 4.5 | -6.3 | -5.1 | | c. Sunflower | 2.4 | 1.6 | 1.0 | 1.0 | -41.4 | -1.9 | | d. Sesame | 0.0 | 0.5 | 0.4 | 0.5 | -20.2 | -22.3 | | e. Safflower | 1.2 | 0.8 | 0.6 | 0.6 | -25.5 | -6.4 | | f. Linseed | 2.7 | 3.5 | 2.8 | 3.3 | -18.4 | -14.3 | | All- Crops (1+2+3+4+5) | 620.3 | 610.9 | 651.9 | 641.9 | 6.7 | 1.6 | Note: Area figures are as per eye assessment of State Agriculture Departments.
Normal Area: Average area during the period of 2014-15 to 2018-19.
Normal Area as on date: Average area during the corresponding period of 2015-16 to 2019-20.
Source: Ministry of Agriculture and Farmers’ Welfare (MoAFW). |
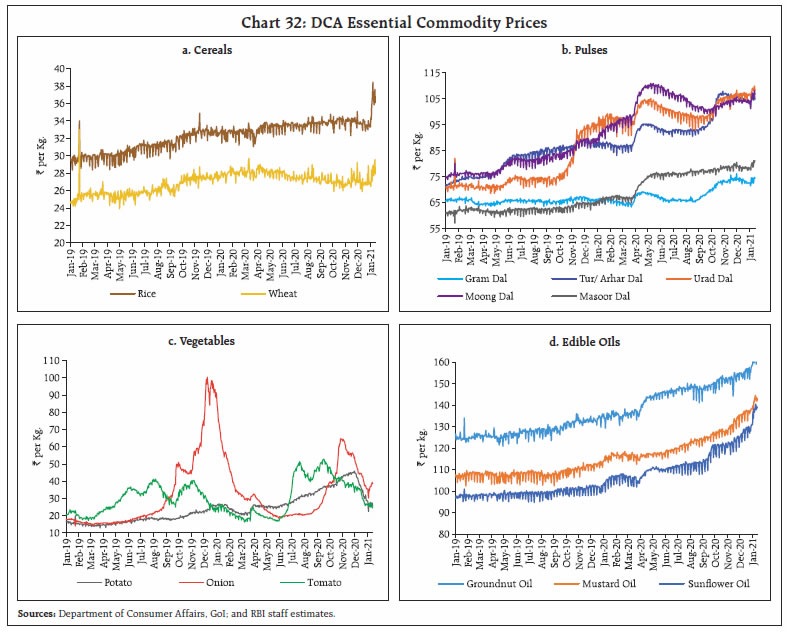
 Although industrial output remains volatile, contracting by 1.9 per cent in November 2020 after a record expansion in October by 4.2 per cent, industrial activity is finally turning around. The headline purchasing managers’ index (PMI) manufacturing expanded in December 2020 to 56.4, a tick higher than November’s reading of 56.3 (Chart 29). Both new orders and output continued to grow strongly. The future output index expanded to 60.3 on hopes of improved market conditions, though confidence was stymied by worries on inflationary pressures. With gradual revival in industrial activity, Coal India Limited (CIL) recorded a 6.3 per cent growth in coal production in Q3. With regard to sales of passenger car vehicles, most of the original equipment manufacturers (OEMs) clocked double digit growth in December, ending the year on a bright note, as they restocked their exhausted inventories. Early data from the Ministry of Road and Transport reveal that over 1.8 million vehicles were registered across India in December 2020, the highest ever since April - a growth of 10.3 per cent for the first time in the pandemic period. The quickening of activity was mainly driven in the non-transport vehicles segment. Sales of mini-trucks, pick-up vans and other light commercial vehicles are showing an uptick as more Indians turn to online shopping, increasing the need for last-mile delivery logistics. 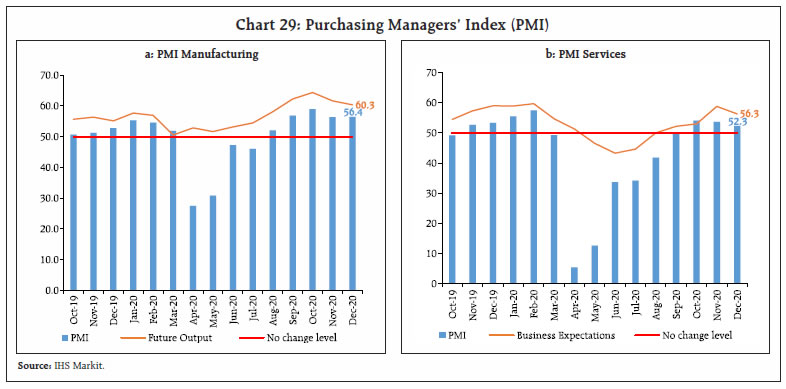 In the services sector, a silent improvement is underway. The services PMI for December at 52.3 expanded for the third consecutive month, driven by an increase in new domestic work intakes. Steel consumption – a proximate indicator for construction activity - also registered an expansion for the third consecutive month, recording 5.7 per cent y-o-y growth. Transportation services through railways continue to exhibit strong momentum, both in terms of loading and earnings. Freight traffic grew at 8.7 per cent in December, extending an acceleration phase that began in August to the fifth successive month (Chart 30). The uptick was broad-based across all categories of commodities, with the exception of coal. Exuberant expansion also continued to characterise port cargo, which registered growth for the second consecutive month in December after eight successive months of contraction. With growing preference for personal mobility to avoid contact, passenger vehicle sales registered an acceleration for the fifth consecutive month in December. Inflation CPI inflation in December 2020 eased sharply to 4.6 per cent from 6.9 per cent in the last month. This was primarily on account of a substantial correction in food inflation - by 5 percentage points - to 3.9 per cent in December from 8.9 per cent in November (Chart 31). Vegetables and cereals drove the sharp disinflation in food inflation. Prices of onions and potatoes, which had seen a substantial increase in the recent months, registered a sharp fall in December. There was also a broad-based seasonal decline in prices of other vegetables. Along with a favourable base effect, these developments pushed vegetable prices into double digit deflation in December. Early indications of price movements of key food items for January (January 1-13, 2021), based on the high frequency food price data from the Ministry of Consumer Affairs, Food and Public Distribution (Department of Consumer Affairs), point to further moderation in prices of vegetables. However, price pressures in respect of edible oils have continued in January so far (Chart 32). 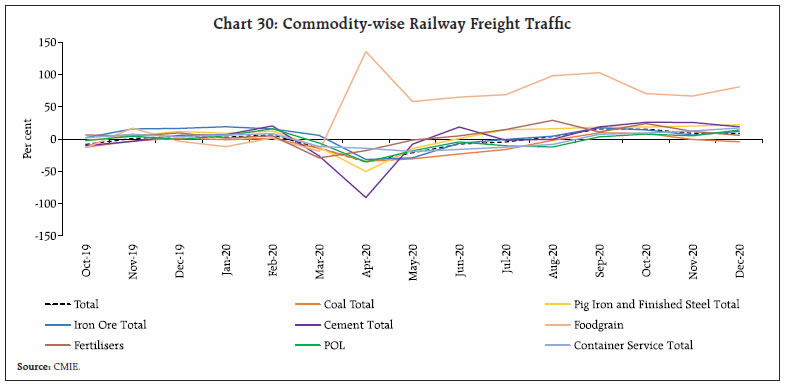 The Indian basket of crude oil prices edged up to US$ 53 per barrel in January so far (January 1-13, 2021) from US$ 50 a barrel in December. This has resulted in further increases in domestic pump prices in January so far. Along with it, the non-reversal of the steep increase in domestic excise duties and state taxes is pushing up pump prices to historically high levels. Domestic kerosene prices also rose further in January. LPG prices, after a sharp increase of around ₹100 per cylinder in December, were kept unchanged in January 2021 (Table 4). 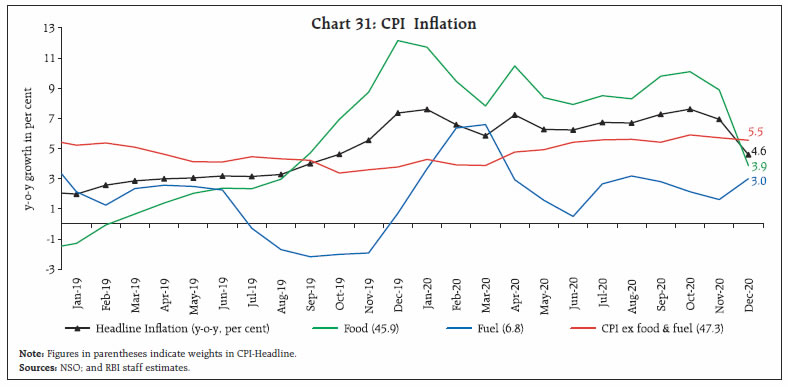
| Table 4: Petroleum Product Prices (Average of Four Major Metros) | | Item | Unit | Domestic Prices | Month-over-month
(per cent) | | Jan-20 | Dec-20 | Jan-21 | Dec-20 | Jan-21 | | Petrol | ₹/litre | 77.79 | 86.27 | 86.73^ | 2.5 | 0.5 | | Diesel | ₹/litre | 70.52 | 77.59 | 78.08^ | 3.8 | 0.6 | | Kerosene | ₹/litre | 28.80 | 23.21 | 25.83 | 4.7 | 11.3 | | LPG | ₹/cylinder | 699.88 | 704.63* | 704.63 | 16.5 | 0.0 | *: Applicable from December 15, 2020
^: For the period January 1 -13, 2021
Note: Average of prices charged by Indian Oil Corporation Limited (IOCL) in four major metros (Chennai, Delhi, Mumbai and Kolkata).
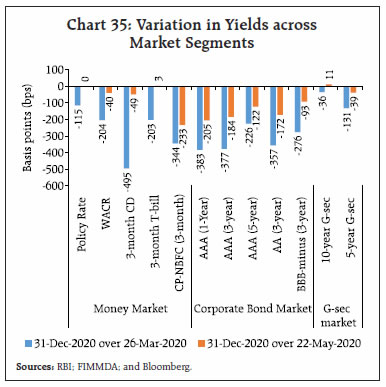
Sources: IOCL; Petroleum Planning and Analysis Cell (PPAC); and RBI staff estimates. | CPI excluding food and fuel remained elevated at 5.5 per cent in December, even while exhibiting a small moderation from the November reading of 5.7 per cent, primarily due to telephone charges, education expenses and some softening in gold prices. Prices in respect of personal care and effects and also pan, tobacco and intoxicants continued to exhibit double-digit inflation in December. In spite of some softening, transport and communications inflation remained elevated in December due to motor vehicles prices, petroleum product prices and transportation fares. CPI food inflation is seeing considerable softening primarily due to sharp corrections in vegetables prices. In near months, prices of eggs and poultry, meat and fish could also ease on account of a likely collapse in demand for poultry products due to sharp rise in the incidence of bird flu infections in January. On the other hand, price pressures in respect of CPI core components are likely to remain. PMIs for manufacturing and services sectors point to an intensification of input price pressures in December. This is coming from an increase in fuel costs, industrial metal prices, edible oil prices and increased cost of doing business in the post-lockdown situation. In a scenario where demand conditions are getting normalised and firms are regaining pricing power, this poses the risk of higher pass-through of rising inputs costs to output prices. IV. Financial Conditions The Reserve Bank has been ensuring through its market operations that congenial financial conditions prevail to nurture the recovery in the form of easy monetary and credit conditions. Through December 2020, the average daily net absorptions under the liquidity adjustment facility (LAF) surged to ₹5,90,822 crore, notwithstanding an advance tax flow out of the banking system in the second half of the month. The surplus liquidity was mopped up through overnight reverse repos under the LAF, which rose to ₹7,37,314 crore as on December 31, 2020. In order to enable banks to exploit the synergies between central bank liquidity under on tap targeted long-term repo operations (TLTRO) scheme6 and the Emergency Credit Line Guarantee Scheme 2.0 (ECLGS 2.0) of the Central Government, the Reserve Bank expanded the scope of the on tap TLTRO on December 4, 2020 to all stressed sectors identified by the Kamath Committee in addition to five sectors announced under the scheme on October 21, 2020. Banks can avail funds from the Reserve Bank under the on tap TLTRO and seek guarantee under ECLGS 2.0 to provide credit support to stressed sectors (Chart 33). During the month, an outright open market operation (OMO) in State Development Loans (SDLs) was conducted on December 23, 2020 amounting to ₹10,000 crore, taking the total number of OMOs in SDLs to three starting from October 22, 2020. Two special OMOs (operation twist) were also conducted on December 17 and 30 to rein in term premia. Money market rates edged up briefly on account of advance tax outflows, moving closer to the reverse repo rate from sub-LAF levels characterising the whole spectrum since mid of October 2020. The spread of the collateralised tri-party repo rate and market repo rate vis-à-vis the weighted average call rate (WACR) narrowed from (-) 32 basis points (bps) and (-) 29 bps in November to (-) 7 bps each in December 2020. Even rates on certificates of deposit (CDs), 91-day treasury bills and on commercial paper (CP) moved closer to overnight rates, although they continued to trade below the reverse repo rate (Chart 34). Spreads in the other segments of financial market have narrowed considerably, mirroring the salutary impact of liquidity measures, regulatory relaxations and forward guidance. Corporate bond yields softened across the rating spectrum with yield on 1-year, 3-year and 5-year AAA-rated bonds declining by 205 bps, 184 bps and 122 bps, respectively, through May 22 and December 31, 2020 (Chart 35). Even the yield on 3-year BBB- (BBB minus)-rated corporate bond – lowest rated investment grade bond – declined by 93 bps, reflecting how liquidity stress has been eased across the board, impervious to ratings. Consequently, the spread on 1-year, 3-year, 5-year AAA and 3-year BBB-rated corporate bonds declined by 180 bps, 145 bps, 96 bps and 54 bps, respectively, during the period (Chart 36). The yield on the old 10-year G-sec benchmark (5.77 GS 2030) slid on a declining trajectory to close at 5.90 per cent on December 31, 2020 while the yield on the new 10-year G-sec benchmark (5.85 GS 2030) closed even lower at around 5.87 per cent on December 31, 2020. With the gradual unlocking of the economy and normalisation of activity setting in, improving demand conditions, easy rates and ample liquidity are expected to propel the flow of resources from the financial to the real sector. 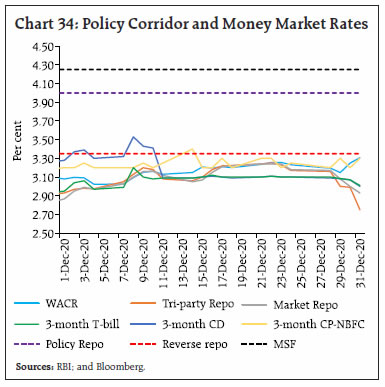
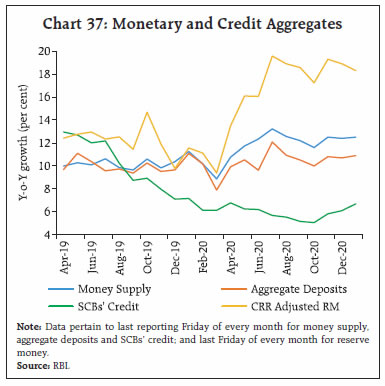
 Broader measures of liquidity mirrored these easy monetary conditions. Reserve money (RM) adjusted for the first-round impact of changes in the cash reserve ratio (CRR) increased by 18.3 per cent y-o-y as on January 8, 2021 (11.3 per cent a year ago), powered by the ongoing surge in currency in circulation (CiC) on the components side and net foreign assets (NFA) on the sources side (Chart 37). Money supply recorded a y-o-y growth of 12.5 per cent as on January 1, 2021 (10.1 per cent a year ago), backed up by aggregate deposits growing by 10.9 per cent (9.8 per cent a year ago). After a hiatus of five months, growth in scheduled commercial banks’ (SCBs) credit to commercial sector broke out of sub-6 per cent levels and picked up to 6.7 per cent as on January 1, 2021 (7.5 per cent a year ago), responding to green shoots of recovery. SCBs’ investments in commercial paper, bonds, debentures and shares of corporate bodies on incremental terms stood at ₹434 crore during the year 2020-21 so far (up to January 1) as against a decline of ₹10,524 crore a year ago. On a cumulative basis, banks have extended credit of ₹2,93,007 crore to the commercial sector through April to January 1, 2021 – an increase of 31.7 per cent over a year ago. The share of bank credit in the overall flow of funds increased from 29.8 per cent to 34.1 per cent during the period. Credit growth to agriculture and services sectors accelerated in November 2020, while credit to industry continued to contract (Chart 38). Personal loan growth slowed across the board with the exception of personal vehicle loans. Within the services sector, loans to transport, trade and tourism rose at a faster pace. While there was decline in overall credit growth to industry, credit to medium industry posted a robust increase and that to micro and small enterprises edged out of contraction, supported by measures designed by the Government and the Reserve Bank for these sectors. 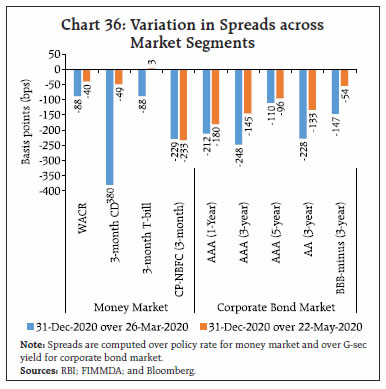
 Surplus liquidity conditions permeated into the credit market, easing interest rates all around. The median term deposit rate (MTDR) declined by 146 bps through March to December 2020, with a perceptible decline occurring in shorter tenor deposits of maturity of up to one year (163 bps). The early adjustment in deposit rates, which is otherwise lagged, bodes well for transmission to lending rates, going forward. During the same period, the 1-year median MCLR softened cumulatively by 95 bps (Table 5). The asymmetry in transmission between deposit and lending rates needs to be seen in the context of persisting structural rigidities, with banks increasingly relying on retail deposits in preference to wholesale or market based funding. 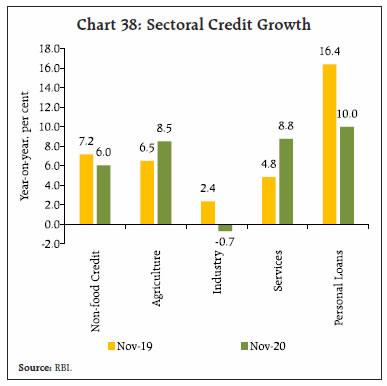
| Table 5: Transmission from the Repo Rate to Banks’ Deposit and Lending Rates | | (Basis points) | | Period | Repo Rate | Term Deposit Rates | Lending Rates | | Median Term Deposit Rate | WADTDR | 1 - Yr. Median MCLR | WALR - Outstanding Rupee Loans | WALR - Fresh Rupee Loans | | Feb 19 - Sep 19 | -110 | -9 | -7 | -30 | 2 | -40 | | Oct 19 – Dec 20* | -140 | -177 | -120 | -115 | -85 | -125 | | Mar 20 - Dec 20* | -115 | -146 | -81 | -95 | -67 | -94 | | Feb 19 – Dec 20* | -250 | -210 | -127 | -145 | -83 | -165 | *: Latest data on WALRs and WADTDR pertain to November 2020.
WALR: Weighted Average Lending Rate. WADTDR: Weighted Average Domestic Term Deposit Rate;
MCLR: Marginal Cost of Funds-based Lending Rate.
Source: RBI. | With the gradual roll-back of the lockdown by easing restrictions and resumption of normal activities, trading hours for markets regulated by the Reserve Bank, which were earlier truncated effective April 7, 2020 were restored in a phased manner since November 9, 2020. Subsequently, it was announced on January 8, 2021 that normal liquidity management operations would be restored in a phased manner, beginning with a variable rate reverse repo auction conducted on January 15, 2021 under the revised liquidity management framework. At the same time, the fixed rate reverse repo remained fully operational with average daily absorption of liquidity of the order of ₹4.4 lakh crore between January 15 and the time of release of this article. While calibrating the gradual restoration of normal operations, the Reserve Bank has committed to ensure the availability of ample liquidity in the system to support congenial financial conditions and nurture the recovery. The equity market hit new highs in its rally in December, lifted by increasing evidence that the recovery is gaining traction and supported by positive global cues in the form of the passage of the US stimulus package and the Brexit trade deal. Market exuberance led to Indian equities outpacing most global peers, with the BSE Sensex touching 47,751 on December 31, 2020 - an increase of 83.8 per cent from its low of March 23, 2020 (25,981) (Chart 39 and 40).
During December 2020, the listing of two initial public offerings (IPOs), aggregating ₹1,351 crore, took the total resource mobilisation through main board IPOs to ₹15,971 crore during 2020-21 (up to December 2020), marking a sharp rebound from ₹10,487 crore in the corresponding period of the previous year (Chart 41). Beginning with the first IPO issued in July 2020, healthcare and finance sector companies have garnered the maximum amount of resources among all initial offerings. Increased retail participation and high system-wide liquidity helped IPOs deliver stellar returns to investors, with 10 out of 13 IPOs generating positive listing day gains and all IPOs generating positive returns on an offer to date basis (Chart 42). Furthermore, most of these IPOs rallied beyond the listing day.
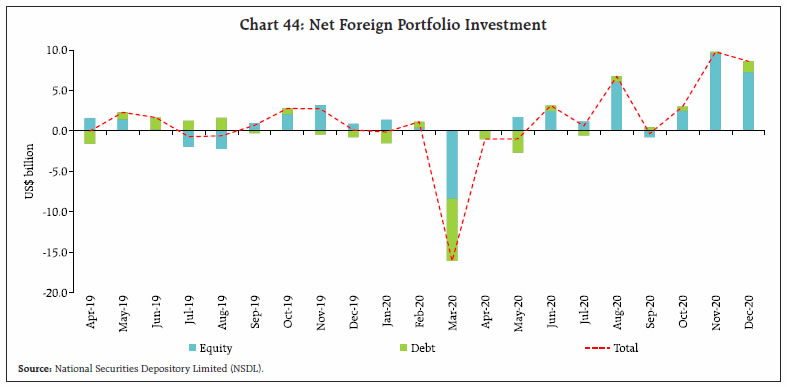
The listing day returns generated by IPOs for investors ranged between (-) 14.0 per cent and 130.7 per cent. In sectoral terms, food processing, information technology (IT) and chemicals sector generated the highest returns for investors (Table 6). Net foreign direct investment (FDI) flows surged through August-November 2020, driven by fresh equity investments. Consequently, net FDI increased to US$ 34.1 billion in April-November 2020 from US$ 26.7 billion a year ago (Chart 43). Net foreign portfolio investment (FPI) inflows remained robust in December 2020, following an all-time intra-month high in November 2020. This may be attributed to the continued global monetary and fiscal stimulus, weakening of the US dollar and a robust revival in appetite for emerging market economies including India. In December 2020, net FPI inflows of US$ 8.6 billion were largely driven by equity purchases of US$ 7.3 billion by foreign portfolio investors. In the debt segment, there were FPI inflows of US$ 1.3 billion, the highest monthly accretion so far in the current financial year (Chart 44). Net investment under voluntary retention route (VRR) were to the tune of US$ 0.2 billion. 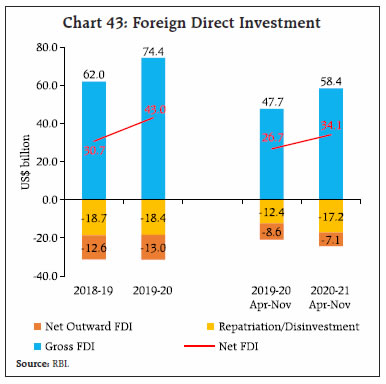
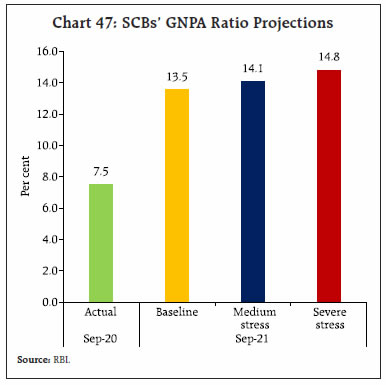
 In the foreign exchange market, the Indian rupee (INR), buoyed by robust capital inflows on vaccine news, appreciated by 0.9 per cent against the US dollar in December 2020 over the previous month. By end-December 2020, the INR appreciated by 3.2 per cent over its level at end-March 2020, and closed at ₹73.05 against the US dollar, a level last seen in the beginning of September 2020. In terms of the 36-currency real effective exchange rate (REER), the INR appreciated by 2.2 per cent in December 2020 over March 2020 (Chart 45). 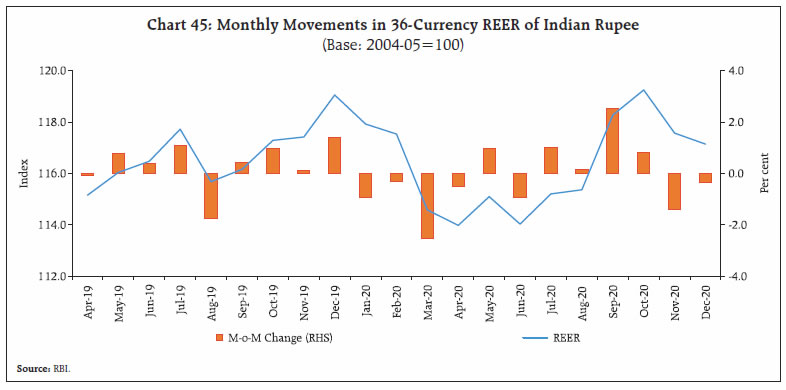 India’s external debt statistics as at end-September 2020 were released by the Ministry of Finance, Government of India, on December 31, 2020. India’s external debt remained contained at US$ 556.2 billion. Lower external commercial borrowings, portfolio debt investment and short-term trade credit caused the moderation in external debt. As at end-December 2020, reserves touched an all-time high of US$ 585.8 billion, equivalent to 18.4 months of imports or 105.3 per cent of outstanding external debt as at end-September 2020 (Chart 46). The regulatory measures to deal with the COVID-19 pandemic entail forbearance across asset classes while maintaining credit supply and systemic resilience. Gross non-performing assets (GNPA) ratio of all SCBs has declined in successive quarters from 9.2 per cent in December 2019 to 7.5 per cent in September 2020, which was aided significantly by the regulatory dispensations. Macro stress tests carried out in the latest Financial Stability Report (FSR) of January 2021 indicate that the GNPA ratio of SCBs may increase to 13.5 per cent by September 2021 under the baseline scenario, which may escalate to 14.8 per cent under a severe stress scenario (Chart 47). 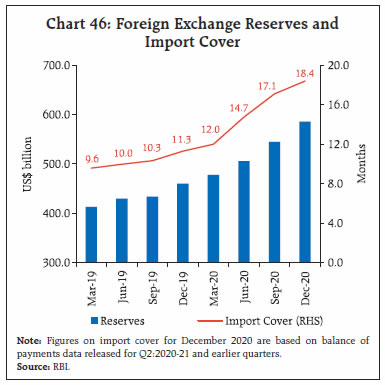
 At the aggregate level, SCBs have sufficient capital cushions7 even in the severe stress scenario (Chart 48). At the individual level, however, the capital buffers of some banks may deplete below the regulatory minimum. Hence, going forward, mitigating actions such as phase-wise capital augmentation or other strategic actions would become relevant for these banks, from a micro prudential perspective. Network analysis reveals that total bilateral exposures among entities in the financial system increased marginally during the quarter-ended September 2020; on the other hand, shrinking inter-bank market and capitalisation of banks reduced contagion risk to the banking system as compared with the March 2020 position. Payment System In the payments space, digital transactions continued to surge in December 2020, with both retail and wholesale transactions expanding in alignment with the broad basing of the economic recovery. As the real-time gross settlement (RTGS) system, characterising the wholesale segment, was made available round the clock with effect from December 14, 2020, its volume growth (y-o-y) turned around sharply and rose by 20.0 per cent in December 2020 from 2.9 per cent a month ago. Transaction values through RTGS, which had started declining since October 2019 and had plummeted through the pandemic, posted a growth of 3.3 per cent in December 2020. In the retail segment, national electronic funds transfer (NEFT) transactions grew by 31.6 per cent in volume in December 2020 as compared with 24.6 per cent recorded a month ago. In value terms, NEFT transactions rose by 31.7 and 27.9 per cent, respectively. Unified payment interface (UPI) transaction volume remained above the historic 2.2 billion mark attained last month, while transaction values increased by 105.5 per cent over December 2019 (Table 7). Transactions through immediate payment service (IMPS), national electronic toll collection (NETC) and Bharat bill payment system (BBPS) surged, hitting double digit levels in both volume and value growth. Cash withdrawals also point towards the economy poised on the cusp of a recovery. | Table 7: Payment Transactions in 2020-21 | | (in ₹ crore) | | | RTGS | NEFT | UPI | IMPS | | Apr-20 | 64,43,653 | 13,06,406 | 1,51,141 | 1,21,141 | | May-20 | 70,41,869 | 14,81,750 | 2,18,392 | 1,69,402 | | Jun-20 | 86,51,978 | 19,06,586 | 2,61,835 | 2,06,951 | | Jul-20 | 83,35,279 | 19,63,113 | 2,90,538 | 2,25,775 | | Aug-20 | 72,92,380 | 19,30,552 | 2,98,308 | 2,35,137 | | Sep-20 | 94,89,066 | 21,65,515 | 3,29,032 | 2,48,662 | | Oct-20 | 84,96,046 | 22,35,389 | 3,86,107 | 2,74,645 | | Nov-20 | 79,87,655 | 22,18,252 | 3,90,999 | 2,76,459 | | Dec-20 | 1,06,59,120 | 25,58,304 | 4,16,176 | 2,92,325 | | Source: RBI. | A distinct pattern of preference shifting towards digital payments is becoming evident this year, with increasing e-commerce penetration, the growing footprint of BigTech in the payment space and competitive pressures on banks to upgrade their payment eco-systems. Incentives such as cashbacks, discounts on e-commerce portals, easy EMI and buy now, pay later schemes have built a widening customer base. They have also promoted increasing use of digital payments and are driving up transaction volumes in retail payment systems, especially on the UPI. As competition in the payments industry is set to intensify, with newer entrants offering greater incentives for people to pay digitally, India may emerge from the pandemic more digital than ever before. This can bolster consumer spending and increase the degree of formalisation of economy. The Reserve Bank now announced opening of the second cohort under its Regulatory Sandbox (RS) with ‘Cross Border Payments,’ as its theme. India is the largest recipient of inbound remittances across the globe, accounting for 15 per cent of global flows. In the year 2019, India received US$ 83 billion and in the first half year of 2020, US$ 27.4 billion has been received. The cohort is expected to spur innovations capable of recasting the cross-border payments landscape by leveraging new technologies to meet the needs of a low cost, secure, convenient and transparent remittance system. Net worth requirements for participating entities have been reduced from ₹25 lakh to ₹10 lakh to encourage innovation and to broad base the eligibility criteria, Partnership firms and limited liability partnerships (LLPs) are now allowed to participate in the RS. V. Conclusion What will 2021 look like? The shape of the recovery will be v-shaped after all and the ‘v’ stands for vaccine. On January 16, India launched the biggest vaccination drive in the world, backed by its comparative advantage of having the largest vaccine manufacturing capacity in the world and a rich experience of mass inoculation drives against polio and measles. If successful, it will tilt the balance of risks upwards. E-commerce and digital technologies will likely be the bright spots in India’s recovery in a world in which there will be rebounds for sure, but pre-pandemic levels of output and employment are a long way off. Japanification stares at much of the advanced world, while for emerging economies, potential output will be a lot flatter. Recent shifts in the macroeconomic landscape have brightened the outlook, with GDP in striking distance of attaining positive territory and inflation easing closer to the target. If these movements sustain, policy space could open up to further support the recovery. Merchandise trade has rebounded in early January, attesting the slow healing of domestic demand and the unlocking of export energies. Current account surpluses are ebbing as domestic activity regains vigour. Foreign investment flows are already scenting the imminent upturn. The recent new highs scaled by equity markets are driven by optimism around early Q3 corporate earnings results, with IT majors including Tata Consultancy Services, Infosys and Wipro recording strong growth. In H1:2021-22, GDP growth will benefit from statistical support and is likely to be mostly consumption-driven. With rabi sowing surpassing the normal acreage way before the end of the season, bumper agriculture production is expected in 2021. India being the global capital for vaccine manufacturing, pharmaceuticals exports are expected to receive a big impetus with the start of vaccination drives globally. Agricultural exports remain resilient and under the recent production linked (PLI) scheme, food processing industry has been accorded priority. Harnessing the synergies by transforming low-value semi-processed agri products through food processing would not only improve productivity but also boost India’s competitiveness. Developments in 2020 have ushered in a new digital transformation on the back of strengthening consumption demand and growing corporate sector business transactions. According to the World Economic Forum’s report - Indian Cities in the Post Pandemic - released on January 7, 2021, the pandemic presents a historic opportunity to build back better and create a new urban paradigm – one that enables Indian cities to be healthier, more inclusive, and more resilient. An urban reform agenda can be set up across seven thematic pillars: planning; housing; transport; environment; public health; gender; and vulnerable populations. The need to kickstart investment is acquiring urgency to secure a durable turnaround and a sustainable growth trajectory. India must look for ways in which cash sitting idly in balance sheets of corporations and banks and reverse repo balances with the Reserve Bank finds their way into credit to productive sectors and into real spending on investment activity before it imposes a persistent deflationary weight on real activity. Stress in the financial sector’s balance sheet could intensify as the camouflage of moratorium, asset classification standstill and restructuring fades, but banks have entered the health crisis with stronger capital buffers than the global financial crisis. Slippage ratios have been falling and loan recoveries are improving even as provisioning coverage ratios have risen above 70 per cent. Capital infusion and innovative ways of dealing with loan delinquencies will occupy policy attention in order to ensure that finance greases the wheels of growth on a durable basis before the demographic dividend slips away. It will take years for the economy to mend and heal, but innovative approaches can convert the pandemic into opportunities. Will the Union Budget 2021-22 be the game-changer? References Agarwal, R., Padhi, I., Goyal, S., Behera, S.R. and Misra, S. ‘Government Finances 2020-21: A Half-Yearly Review’, RBI Monthly Bulletin, December 2020. Covid-10 trn. (January 9-15, 2021). The Economist. Financial Stability Report. (Issue No. 22, 2021). RBI. Global Economic Prospects. (January 2021). World Bank. IIF Capital Flows Tracker – December 2020. (January 2021). Back from the Brink. Kumar, P. ‘An Economic Activity Index for India’, RBI Monthly Bulletin, November 2020. Reinhart, C., ‘The coming COVID-19 Credit Crunch’, World Bank Blogs, December 2020. Sedik, T.S. and Xu, R., ‘A Vicious Cycle: How Pandemics Lead to Despair and Economic Unrest?’, IMF Working Paper, October 2020. Shahidi T., Dantewadia P., (2021, January 05), ‘State Recovery Tracker: UP, Rajasthan, other large states led economic recovery in December’. Livemint. State Finances: A Study of Budgets of 2020-21. (2020). RBI.
|