India has undertaken a number of import-related measures primarily in response to, inter alia, unfair trade practices adopted by trade partners. In this study, two hypotheses are tested. First, whether import measures lead to the desired impact on import volumes. Second, how prices behave after the import measures are applied. Using commodity level panel data on 119 import items for the period 2013 to 2019, the study applies the difference-in-differences method to obtain an appropriate counterfactual and estimate the causal effect of import measures. It is found that import measures do have a significant impact on the volume of import items but not on their inflation. I. Introduction In the aftermath of global financial crisis, the recourse to trade measures, on safeguarding national interest such as country’s key industries, commodities, and employment, rose reflecting inclination towards protectionism. These policy measures are evident across countries in terms of tariff increases, import quotas, product standards, anti-dumping duties and countervailing-duty investigations. The debate on protectionism is not new to the economic literature. As early as in 1848 semantic research by Karl Marx and Engels note that protectionist policies are a specter haunting the global economy, but they also did not favour policy towards free trade. However, several scholars have supported free trade between countries and considered this as the best means of ushering in proper allocation with least distortion of resources (Adam Smith, Jeremy Bentham, Ricardo to name a few). With globalisation the integration of countries is seen not only in terms of unrestricted trade in goods but also unobstructed labour movement and technology transfer. In recent times however, there has been growing urge among policymakers towards inward-looking policies. Researchers have raised concerns over broad-based protectionism across different countries that is expected to aggravate the retaliatory measures which in turn increases the cost associated with resulting trade imperfections. As stated earlier, both advanced and emerging market economies have extensively adopted trade protectionist measures in various forms in the post-global financial crisis period. According to the Global Trade Alert, nearly 15 per cent of the total trade protectionist measures implemented at the global level directly or indirectly impact India’s merchandise trade. According to a report by the Global Trade Alert (2019), the value of imports of those products facing tariff hikes was approximately US$18.5 billion in the case of India. All kinds of protectionist measures (both tariff and non-tariff) for both exports and imports (goods) are on the rise since 2009 (Chart 1). The protectionist measures affecting India are 5 times higher than the measures implemented by it. India’s recourse to import restrictive measures for goods trade appears to have tailed off in 2016 and 2017 but again rose in 2018 before declining subsequently (Table 1). In the case of India, import measures have been undertaken either with the objective to promote government’s flagship ‘Make in India’ program or address the issue of inverted duty structure prevalent in certain sectors (such as electronics). Other measures were in response to the dumping practices adopted by trade partners. Against this background, the study examines key questions as to how import volume and domestic prices of these products react to import restrictive measures. It is quite possible that import restrictions – if domestic demand is not met by domestic supply – by way of reduced imports can cause a rise in domestic prices of those commodities. Therefore, the testable hypotheses are, viz., (a) whether these import-related measures adversely affect imports and (b) whether these measures lead to higher inflation by reducing imports. 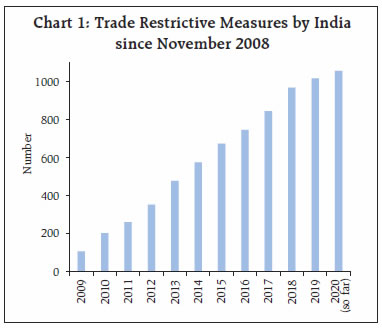
| Table 1: Year-wise Trade Restrictive Measures (Number) | | Year | Impacting India | Implemented by India | | 2009 | 429 | 89 | | 2010 | 391 | 96 | | 2011 | 399 | 59 | | 2012 | 451 | 91 | | 2013 | 454 | 125 | | 2014 | 523 | 97 | | 2015 | 639 | 100 | | 2016 | 524 | 71 | | 2017 | 559 | 99 | | 2018 | 645 | 124 | | 2019 | 308 | 48 | | 2020 (so far) | 125 | 40 | Note: 1055 is a cumulative number of all protectionist measures taken since November 2008 reported by Global Trade Alert (GTA) database as on July 24, 2020. As defined by GTA, this data includes all types of measures including trade defence (e.g., anti-dumping duties), tariff measure, export incentives (interest subventions, subsidies, etc.), localisation requirement, trade finance, bailout/state aid measure and others.
Source: Compiled from the Global Trade Alert. | Accordingly, the study is organised into four sections. Section II provides a snapshot of the relevant literature. Section III discusses the data used for empirical analysis. Empirical findings are covered in Section IV and finally Section V sets out concluding observations. II. Literature Review In the economic literature, there is a considerable discussion on the globalisation and degree of trade openness of economies. Proponents of free trade have supported the argument of a well-functioning competitive market, which will not only allocate the resources in the best possible way but also create productivity gains. It is argued that market distortions in the form of duties and restrictions on trade deflect the producers from the optimal solution by creating inefficiencies for the entire system including consumers. Whereas on the other hand, proponents of trade protectionism argue that the very foundation of trade restricting policies rests on national security perspectives. The history of trade protectionism dates back to as early as 1567 in the form of mercantilism. France was the first country to impose trade measures to protect Lyon silk from international competition. During most of the 16th century and until the end of the 18th century, several countries focused on attaining a favourable balance of trade by adopting the principle of mercantilism. Most of the European countries during this period used protectionist policies in diverse forms of tariffs, quotas on imports with the aim to safeguard the domestic industry. This era came to an end when Britain, the then largest trading economy, started opening the economy to promote growth. The world economy moved towards liberalised trade policies; however, the trading principles were based on bilateral trade agreements, which did not focus on free-trade treaties. While highlighting the causal sequence of tariff changes effected under the US tariff reduction program in 1955-56, a seminal study by Kreinin (1961) finds that lower tariffs reduced prices of imported goods and increased import volumes. Another popular free-trade oriented commercial agreement was between Britain and France in 1960, i.e., Cobden-Chevalier treaty.1 This treaty was called “free trade epidemic” as it prompted a series of bilateral trade negotiations in the European Continent, which was following protectionist policies for centuries (Lazer, 1999 and World Trade Organization, (WTO)).2 These comprehensive new networks of agreements, which involved reciprocal policies created a strong vision for the multilateral trading system in the form of General Agreement on Tariffs and Trade (GATT). After 8 rounds of multilateral trade negotiations, it was decided to create a separate trade promoting body in the form of WTO in 1995 with expanded scope of the multilateral trade system by covering services and intellectual property rights as well. Since the setting up of the WTO, global trade as a share of world GDP has increased from 43.4 per cent in 1995 to 60.4 in 2019.3 The world economy witnessed a sharp slowdown during the financial crisis and several advanced economies adopted restrictive trade measures with the view of protecting the domestic firms (Rodrik, 2009; Bown, 2011). The US-China tariff war is one of the recent examples of rising protectionism. In the literature, there are broadly two perspectives that researchers have developed on import penetration and its impact on the domestic economy. One set of arguments is that greater import penetration constrains growth as with lower import prices, the demand for domestic commodities falls and in turn, leads to output contraction and industrial shrinkage. The other view considers that import penetration creates a pro-competitive effect with greater foreign competition, forcing the domestic firms to invest and improve their productivity and hence results in enhancing growth. Conventional trade models provide a useful framework for analysing the impact of tariffs on trade with broad consensus that tariffs make foreign goods expensive and suppress the demand for imports. Most of these studies are based on country-level data rather than commodity level data. Only a few studies explicitly dealt with the impact of tariffs on import volumes and inflation at commodity level. Some of the earlier studies provided evidence on the output inflation trade-off because of trade openness. There was an evidence of significant negative relationship between inflation and trade openness (Romer, 1993). Another study, using panel data from 1973 to 1998, finds that trade openness in the short run does not play a crucial role in restricting the inflation of countries (Alfaro, 2005). In the case of developing countries, the relationship between country’s openness and the price level is negative whereas for advanced economies like the US and Belgium, the relationship turns out to be positive (Kim and Beladi, 2005). A recent study using panel VAR, which estimated the impact of protectionism on macroeconomic fluctuations observes that protectionism is not an effective tool for macroeconomic stimulus. The study finds that estimates on protectionism acts as a supply shock and affects inflation (Barattieri et al., 2018). Another study further strengthens these findings by concluding that trade policy changes in the form of a sharp reduction in import tariffs on an average creates a positive impact on economic growth, although the effect varies across different economies (Irwin, 2019). Scholars have argued how the recent rise in the trade protectionism by the major economies has impacted the global economy. A few studies have been attempted to examine the recent tariff hikes by the US and China. Some of these studies provide an exhaustive discussion on how tariffs affect demand and prices in the context of the US-China trade war. One such study concluded that the tariff imposition by the US affected the prices of both intermediate and final goods on which the duties were levied in comparison to the unaffected sectors, and huge changes were witnessed in supply-chain networks of the US economy (Amiti et al., 2019). Further the tariff imposition resulted in a complete pass-through to the US domestic prices, which means that the tariff incidence fell on domestic consumers and importers, with nearly no impact on the prices received by foreign exporters. In the case of the US, higher prices on tariffed items resulted in lower imports from China (Nicita, 2019). While analysing the impact of protectionism by the US and China in the form of tariff hikes, a recent study finds that the rise in prices resulted in a decline of the US trade flows amounting to a loss of US$51 billion (Fajgelbaum et al., 2020). The present study is related to theoretical and empirical literature, which analyses the impact of import measures on macro-economic indicators such as prices and imports. This study uses high-frequency monthly trade and macroeconomic data to identify the short-term effects of the trade measures. The study thus contributes to the growing literature dealing with the impact of trade measures. III. Data Description The study covers select commodities on which import measures were undertaken during the period from January 2015 till December 2018. These measures were either in the form of higher basic customs duty/anti-dumping duty (BCD/ADD) or any other form of non-tariff restriction. Data on import measures are compiled from the notifications issued by the Directorate General of Foreign Trade (DGFT) and Central Board of Indirect Taxes and Customs (CBIC) and the Union Budget of the Government of India (list at Annexure). Out of the items subject to the import measures during the sample period, comparable data on inflation and domestic production were available only for 50 commodities, which can be used for empirical analysis (treatment group). Apart from commodities which attracted import measures during the sample period, the study also examines 69 commodities, which are randomly selected import items from within the group (control group). These items in the broader group are related either horizontally or vertically to the commodities on which import measures were levied. Therefore, a total sample of 119 import items is undertaken. The main consideration of the study was to have adequate representation of imports of both categories (i.e., with and without import measures). The study collects data on prices, imports and production for these 119 commodities from January 2013 to December 2019. To calculate inflation, the study uses the monthly data on consumer price indices/wholesale price indices as released of the Ministry of Statistics and Programme Implementation (MOSPI) and the Office of Economic Adviser of the Ministry of Commerce and Industry (MOC&I). The data on imports of the selected commodities have been extracted either at six or eight-digit level from the Directorate General of Commercial Intelligence and Statistics (DGCI&S) of MOC&I. Domestic production data are mainly based on the index of industrial production (IIP) from MOSPI. For the production of agriculture commodities, data on Rabi/Kharif as provided by the Ministry of Agriculture and for almonds and walnut the data provided by National Horticulture Board (NHB) are appropriately used for working out the average growth in production during the pre and post imposition period. The study undertakes a one to one mapping of imports of commodities, on which tariff/non-tariff measures were imposed, along with respective information on commodity prices and production at the most granular level. IV. Stylised Facts and Empirical Analysis The conventional trade framework for evaluating the impact of trade measures on prices and welfare is based on partial equilibrium models with the assumption of a perfectly competitive market. The theory predicts that the imposition of import restrictive measures in the form of tariff, quota, voluntary restrictions, etc increases the cost of imported commodity and hence reduces its domestic demand. The magnitude of demand reduction, however, depends upon the slope of demand and supply curves. To get a sense on how the restrictive measures have impacted imports, as an initial step, we examine what has happened to the import volume of these commodities during the time horizon considered in the study. The data reported by DGCI&S provides the value of import and quantity imported at the six and eight-digit level of Harmonized Tariff Schedule (HTS). These data are provided for monthly breakups for imports of approximately 12,000 narrowly defined categories. | Table 2: Summary Statistics: Import Volume Variation | | Imports | Total Sample Size | Change in import volume after imposition of trade measures | | Decline | Increase | | With import measures: Treatment group | 50 | 37 | 13 | | Without import measures (related items): Control group | 69 | 33 | 36 | | Total | 119 | 70 | 49 | | Source: Authors' calculations based on DGCIS data | Table 2 provides the sample composition and bifurcation of the commodities based on import volume growth for both treatment and control group commodities. Out of 50 commodities on which import restrictive measures had been imposed, some commodities registered a significant decline in the import volume growth post-implementation of the measures. Several important patterns emerge from the preliminary analysis. For instance, more than 70 per cent of the commodities on which import measures were imposed registered a decline in the import volume on an average during the post implementation period. By contrast, for some commodities, the import volume increased even after the imposition of such measures. Chart 2 provides information on how the import-volume growth has behaved both in the case of treatment and control group categories during the restriction period. Commodities such as hot-rolled stainless steel, fibreglass, ethyl alcohol are among items, which recorded higher volume growth even after the import measure. The stylised facts seem to provide some trend in import volume growth of specific commodities in the pre and post-implementation of import measures, which is consistent with a belief that these restrictive measures lead to a decline in the imports because of increase in the cost of importing the commodity or higher availability of domestic supply. Table 3 repeats the same methodology for examining the preliminary observation related to domestic prices of these imported commodities. The table suggests that more than half of the commodities in treatment group did not experience a rise in prices on an average during the post implementation period. However, it may be noted that commodities such as palm oil, soyabean oil, cold rolled and hot rolled coils, cold-rolled stainless steel products witnessed sharp rise in the inflation rate post implementation of measures (Chart 3). Prima facie, it seems that there is no pattern in the inflation response after the import measure is undertaken. However, it is being empirically examined in the following discussion. 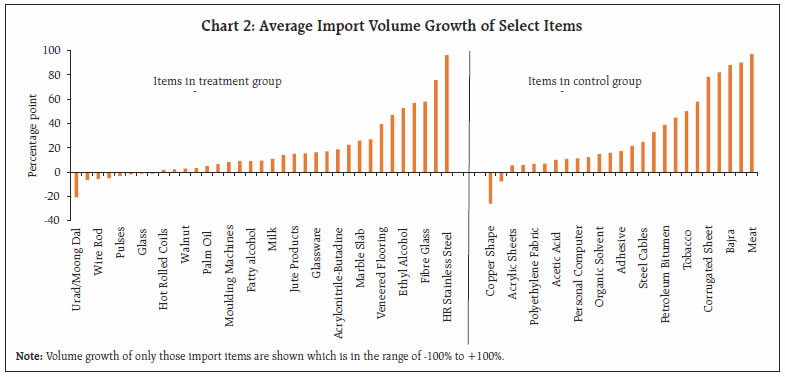
| Table 3: Summary Statistics: Price Variation | | Commodities | Total Sample Size | Change in inflation after imposition of trade measures | | Decline | Increase | | With import measures: Treatment group | 50 | 27 | 23 | | Without import measures (related items): Control group | 69 | 39 | 30 | | Total | 119 | 66 | 53 | | Source: Authors' calculations based on DGCIS data. | After providing some stylised facts on the import volume and inflation movement, the study specifies a model to examine the impact of import restrictive measures on two outcome indicators, viz., price and import volume growth. In order to understand the impact, we used the difference-in-differences (DID) on a dated panel framework, which is one of the popular designs for examining the causal effects of policy changes. The hypotheses tested for this study relate to whether the imposition of import measures led to lower imports and particularly how the domestic prices have progressed. This empirical specification attempts to differentiate the linkages between commodities on which measures are imposed and commodities on which such measures are not imposed. Thus, in our case, there are two sub-groups of items, i.e., import items with an import measure (treatment group) and import items without any import measure (control group), which is represented by product dummy. Similarly, there are two time periods for each imported item, i.e., pre- and post-imposition of restrictions and represented by time dummy. One of the advantages of using DID with panel data is that item fixed effect and time fixed effect can also be controlled for besides other observable control variables.4 The empirical specification is as follows: Here, IIMPV is the dependent variable representing the import volume of a commodity.5 While IIP, represent domestic production of the commodity, GRIIP implies the IIP of the commodity group to which the import item belongs.6 Group IIP is used as a proxy for demand for respective commodities within the group and the underlying assumption is that higher production growth of a particular group is reflective of buoyant demand for all items within the group. This, in turn, may impact the imports of commodities within that group. Also i and t represents the product and time, respectively. Here the impact of import measures is captured through the interactive term. Also in order to understand the impact on inflation, the study tests the hypothesis based on the specified equation as under: 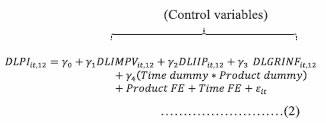 In equation 2, DLPI is the dependent variable representing the change in log price index of an item in period t compared to 12 months prior (year on year change). Similarly, DLIMPV, DLIIP, DLGRINF are year on year change in import volume, domestic production, group inflation, respectively. Group inflation represents inflation of the broader group of items, which are either vertically or horizontally related to the items covered in the sample. Here the objective is to control for inflation of items belonging to the same group, which may be reflecting the influence of other common factors (i.e., other than the supply shortages, if any, caused by lower imports due to import measures). In these two equations, β3 and γ4 are coefficients of our main interest as their statistical significance will imply the efficacy of import measures in impacting the import volume growth and inflation. The results based on equation 1 reflect that the coefficient of IIP is significantly negative indicating an inverse causal effect of domestic production on import volume. An increase in production in the previous month by 1 per cent is associated with a decline in commodity imports on an average by 0.004 per cent. The interaction term of dummies is negative and statistically significant at 5 per cent level implying that the imposition of import measures does lead to a fall in import volumes in the post-implementation period (Table 4). The interaction term implies that import volume decreases by 1.3 per cent on an average after the import restrictive measure is imposed in comparison to control commodity group. With respect to the other control variable, i.e., group IIP, the result suggests that a buoyant demand conditions in the concerned commodity group in turn positively impact the demand for imports. | Table 4: Difference-in-Differences Estimates based on Panel Data [Dependent Variable: LIMPV] | | | Coeff. | S.E | Z | p-value | | C | 0.11 | 0.01 | 10.18 | 0.00 | | LIIP(-1) | -0.004 | 0.002 | -2.21 | 0.03 | | LGRIIP(-1) | 0.01 | 0.00 | 1.48 | 0.14 | | Interaction term | -0.01 | 0.01 | -2.26 | 0.02 | | Controlled for: | | | | | | Item Fixed Effect | Yes | | | | | Period Fixed Effect | Yes | | | | | R2 | 0.75 | | | | | Note: Standard errors (in parentheses) are corrected for clustering of the observations using white-period weights. | In the inflation equation, the coefficient of the interaction term (i.e., γ4) is positive suggesting that inflation tends to be higher with the imposition of import restrictive measures though it is statistically insignificant. Further, the change in domestic production seems to negatively impact the level of inflation of the commodities covered in the sample. Table 5 provides estimates that a 1 per cent increase in production is associated with a 0.008 per cent decline in inflation. Also, the change in imports volume positively influences the domestic inflation of a given commodity, which is not as per our a priori expectations. Such relation may generally be expected at macro level as high imports lead to depreciation of domestic currency which, in turn, may impact inflation through exchange rate pass-through. However, at the commodity level, the sign of the coefficient may be determined by trend in international prices of the imported items. It is also observed that the change in group inflation explains a significant change in inflation of imported items. This suggests that the same factors, which influence inflation of other group items (either horizontally or vertically related) are important for items with import measures. Table 5: Difference-in-Differences Estimates based on Panel Data
[Dependent Variable: DLOGPI, i.e., Inflation] | | | Coeff. | S.E | Z | p-value | | C | 0.007 | 0.002 | 3.69 | 0.00 | | DLIMPV | 0.004 | 0.001 | 3.74 | 0.00 | | DLIIP | -0.008 | 0.004 | -2.21 | 0.03 | | DLGRINF | 0.886 | 0.018 | 49.85 | 0.00 | | Interaction term | 0.008 | 0.006 | 1.25 | 0.21 | | Controlled for: | | | | | | Item Fixed Effect | Yes | | | | | Period Fixed Effect | Yes | | | | | R2 | 0.29 | | | | | Note: Standard errors (in parentheses) are corrected for clustering of the observations using white-period weights. | V. Conclusion Motivated by the findings of the trade framework in the literature on understanding the impact of import measures on macroeconomic indicators, this study examines the case for India. The study tests two hypotheses. First, whether the import volume of items facing import measures is adversely impacted. Second, whether the domestic inflation rate of these items accelerates after the adoption of import measures. Hypotheses are tested using DID method on panel data for 119 commodities. The results suggest that these import measures do impact import volumes in the post-implementation period. Although the impact on inflation is in line with theory, the coefficient is not statistically significant. The insignificant impact on inflation may be possibly reflecting that the volume of import of items being considered for import measure is not sizeable enough relative to the domestic supply to influence the prices, though this conjecture is difficult to ascertain empirically due to the paucity of volume data on domestic supply. To sum up, it can be inferred that import measures do impact the import volume growth of these items but not their inflation. However, the estimates need to be seen with the caveat that several import items could not be covered in the sample due to unavailability of comparable data on other variables. Also, the calculations are based on a partial equilibrium framework whereby it is assumed implicitly that import measures do not impact sectors that do not use imports directly affected by the measure. Nevertheless, the study offers important insights on causal effects of import restrictive measures on import volumes and inflation which are in line with the extant literature on international trade and protectionism. References Alfaro, L. (2005), “Inflation, openness, and exchange-rate regimes: the quest for short-term commitment”. Journal of Development Economics, 77(1), 229-249. Amiti, M., Redding, S. J., and Weinstein, D. E. (2019), “The Impact of the 2018 Tariffs on Prices and Welfare”. Journal of Economic Perspectives, 33(4), 187-210. Barattieri, A., Cacciatore, M., and Ghironi, F. (2018), “Protectionism and the business cycle”. National Bureau of Economic Research, Working Paper 24353. Bown, C. P. (2010), “Global antidumping database”. World Bank. Bown, C. P. (2011), “Taking Stock of Antidumping, Safeguards and Countervailing Duties, 1990-2009”. The World Economy 34: 1955-1998. Bown, C. P., and Crowley, M. A. (2012), “Import protection, business cycles, and exchange rates: Evidence from the Great Recession”. World Bank. De Loecker, J., J. Eeckhout, and G. Unger (2018), “The Rise of Market Power and the Macroeconomic Implications”. National Bureau of Economic Research, Working Paper 23687. Fajgelbaum, P. D., Goldberg, P. K., Kennedy, P. J., and Khandelwal, A. K. (2020), “The return to protectionism”. The Quarterly Journal of Economics, 135(1), 1-55. Goldberg, P. K., Khandelwal, A. K., Pavcnik, N., and Topalova, P. (2010). “Imported intermediate inputs and domestic product growth: Evidence from India”. The Quarterly journal of economics, 125(4), 1727-1767. Irwin, D. A. (2019), “Does Trade Reform Promote Economic Growth? A Review of Recent Evidence”. National Bureau of Economic Research, Working Paper 25927. Lazer, D. A. (1999), “The free trade epidemic of the 1860s and other outbreaks of economic discrimination”, World Politics, Vol. 51, 447–83. Li, M. (2020). The US-China trade war: Tariff data and general equilibrium analysis. Journal of Asian Economics, 101216. Marx, K., & Engels, F. (1848), “The Communist Manifesto”. Selected Works by Karl Marx and Frederick Engels. New York: International Publishers, 1363. Jeanne, Olivier (2020), “To What Extent Are Tariffs Offset by Exchange Rates?”, PIIE Working Paper No.20- 1, January. Kim, M., Beladi, H. (2005), “Is Free Trade Deflationary”. Economics Letters, 89: 343-349. Kreinin, Mordechai E. (1961), “Effect of Tariff Changes on the Prices and Volume of Imports” The American Economic Review, Vol. 51, No. 3, 310-324 Nicita, Alessandro (2019), “Trade and trade diversion effects of United States tariffs on China”, UNCTAD Research Paper No. 37, UNCTAD/SER.RP/2019/9. Rodrik, D. (2009), “The myth of rising protectionism”. Project Syndicate Romer, D. (1993), “Openness and inflation: theory and evidence”. The Quarterly Journal of Economics, 108(4), 869-903. Selina Jackson(2015), “Growth and development: Why openness to trade is necessary but not sufficient”, https://www.brookings.edu/blog/future-development/2015/11/23/growth-and-development-why-openness-to-trade-is-necessary-but-not-sufficient/ Stiglitz, Joseph. (2016), “A Nobel Laureate Explains How Trump Could Nuke the Economy”, Vanity Fair, December 27. World Trade Organisation Report (2011), “The WTO and preferential trade agreements: From co-existence to coherence”.
Appendix | List of items with import measures covered under the sample | | Sl. No. | Commodities | Date | Type of import measures | | 1 | Sheet Glass | 13-03-2015 | Anti-Dumping Duty | | 2 | Hot Rolled Flat Products Of Stainless Steel | 05-06-2015 | Anti-Dumping Duty | | 3 | Milk | 24-06-2015 | Imports Restriction | | 4 | Milk Products | 24-06-2015 | Imports Restriction | | 5 | Fibre Glass | 09-07-2015 | Anti-Dumping Duty | | 6 | Wheat | 07-08-2015 | Imports Restriction | | 7 | Caustic Soda | 18-08-2015 | Anti-dumping duty | | 8 | Phosphoric Acid | 24-08-2015 | Anti-Dumping Duty | | 9 | Acrylonitrile Butadiene Rubber | 04-09-2015 | Anti-Dumping Duty | | 10 | Plastic Processing Or Injection Moulding Machines | 04-12-2015 | Anti-Dumping Duty | | 11 | Phthalic Anhydride | 04-12-2015 | Anti-Dumping Duty | | 12 | Cold Rolled Flat Products Of Stainless Steel | 11-12-2015 | Anti-Dumping Duty | | 13 | Viscose Staple Fibre | 08-08-2016 | Anti-dumping duty | | 14 | Hot Rolled (Hr) Coils & Sheets | 08-08-2016 | Anti-dumping duty | | 15 | Marble Slab, Travertine | 17-09-2016 | Imports Restriction | | 16 | Wire Rod Of Alloy Or Non Alloy Steel | 02-11-2016 | Anti-dumping duty | | 17 | Jute Products (Yarn And Hessian) | 05-01-2017 | Anti-dumping duty | | 18 | Cold Rolled Flat Products Of Alloy Or Non Alloy Steel | 07-02-2017 | Anti-dumping duty | | 19 | Viscose Filament Yarn | 03-05-2017 | Anti-dumping duty | | 20 | Soda Ash | 30-06-2017 | Anti-dumping duty | | 21 | Sugar | 10-07-2017 | Import duty | | 22 | Pegion Peas | 05-08-2017 | Imports Restriction | | 23 | Palm Oil (Crude And Refined) | 11-08-2017 | Basic custom duty | | 24 | Urad/Moong Dal | 21-08-2017 | Imports Restriction | | 25 | Soya bean | 17-11-2017 | Basic custom duty | | 26 | Crude Soya Bean Oil | 17-11-2017 | Basic custom duty | | 27 | Specified Electronic Goods (Tvs) | 14-12-2017 | Basic custom duty | | 28 | Chickpeas And Masoor | 21-12-2017 | Basic custom duty | | 29 | Urea | 24-01-2018 | Imports Restriction | | 30 | Veneered Engineered Wooden Flooring | 27-03-2018 | Anti-Dumping Duty | | 31 | Glassware | 18-04-2018 | Anti-Dumping Duty | | 32 | Peroxosulphates | 14-05-2018 | Anti-Dumping Duty | | 33 | Walnut | 23-05-2018 | Imports Restriction | | 34 | Saturated Fatty Alcohol | 25-05-2018 | Anti-Dumping Duty | | 35 | Hydrogen Peroxide | 01-06-2018 | Imports Restriction | | 36 | Almonds | 01-06-2018 | Imports Restriction | | 37 | Pulses | 20-06-2018 | Tariff | | 38 | High Tentative Polyester Yarn | 09-07-2018 | Anti-Dumping Duty | | 39 | Grinding Media Balls | 13-07-2018 | Anti-Dumping Duty | | 40 | Solar Cell | 30-07-2018 | Safety Duty | | 41 | Ethyl Alcohol | 21-08-2018 | Imports Restriction | | 42 | Petroleum Oil | 21-08-2018 | Imports Restriction | | 43 | Glass | 06-09-2018 | Anti-Dumping Duty | | 44 | Flat Base Steel | 05-10-2018 | Anti-Dumping Duty | | 45 | Nylon Multi Filament Yarn | 05-10-2018 | Anti-Dumping Duty | | 46 | Ductile Iron Pipe | 09-10-2018 | Anti-Dumping Duty | | 47 | Straight Length Bars And Rods | 18-10-2018 | Anti-Dumping Duty | | 48 | Flax Yarn | 18-10-2018 | Anti-Dumping Duty | | 49 | Acid | 15-11-2018 | Anti-Dumping Duty | | 50 | Uncoated Copier | 04-12-2018 | Anti-Dumping Duty |
|