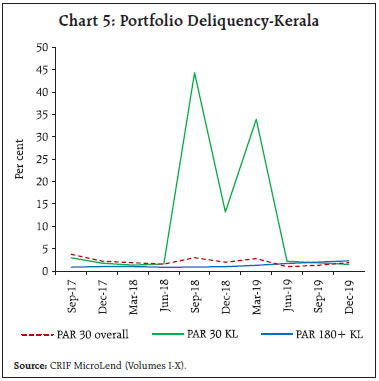
The microfinance sector in India has been undergoing a transformation. COVID-19 presents new challenges and significant financial risks. It also presents an opportunity to build long term resilience. Introduction Microfinance in India plays an important role in delivering credit to people at the bottom of the economic pyramid. Owing to its grass-roots level connect, microfinance is able to support income generating activities and impact livelihoods in both rural and urban geographies. Furthermore, microfinance acts as a potent tool for empowering women who constitute the largest part of its borrower base. The microfinance sector faced downturn in the second half of 2010-11 owing to reported malpractices by some Microfinance Institutions (MFIs) in Andhra Pradesh (A.P) and the consequent legislative response by the state government1. On the back of these developments, the sector had to deal with rising delinquency ratios and downgrades by rating agencies. Recovery rates of 99 per cent reportedly fell to a meagre 10 per cent, leading to huge NPAs, which caused significant stress on the functioning of MFIs (Sinha, 2012). Again in 2016, cash-intensive MFIs experienced a rise in credit delinquencies, followed by localised disruptions on account of state elections and announcements of farm loan waivers in 2017. In 2018, the failure of Infrastructure Leasing & Financial Services (IL&FS), which was associated with heightening of risk perception and the consequent tightening of liquidity conditions, affected the funding profile of Non-banking Financial Company Microfinance Institutions (NBFC-MFIs). Environmental events such as floods in Kerala and socio-political events in Assam also caused localised distress. With the onset of COVID-19, the microfinance sector is again facing a test of its resilience. The article starts by describing the microfinance sector, its size and outreach in Section II. The loan portfolio of MFIs is analysed in the context of tail risk events in Section III. Section IV delves into the impact of socio-political and environmental events of a more localised nature on the loan portfolio of MFIs. The ramifications of the IL&FS event and consequent changes in the funding profile of NBFC-MFIs are examined in Section V. Challenges due to COVID-19 are discussed in Section VI while Section VII concludes the article. II. The Microfinance Sector MFIs encompass a host of financial institutions engaged in advancing loans to low-income groups. The essential features of microfinance loans are that they are of small amounts, with short tenures, extended without collateral and the frequency of loan repayments is greater than that for traditional commercial loans. These loans are generally taken for income-generating activities, although they are also provided for consumption, housing and other purposes (RBI, 2011). The overall Gross Loan Portfolio (GLP) of MFIs, i.e., outstanding amount of loans extended to microfinance borrowers, grew from ₹1.79 lakh crore as on March 31, 2019 to ₹ 2.32 lakh crore as on March 31, 2020 (Chart 1). NBFC-MFIs and Scheduled Commercial Banks (SCBs) hold a major chunk of the microfinance portfolio, with a combined share of 72 per cent as on March 31, 2020. The remainder is held by Small Finance Banks (SFBs), NBFCs and others (including not-for-profit MFIs). While NBFC-MFIs held the pole position in terms of GLP as on March 31, 2019, they ceded market share to SCBs during 2019-20, which is largely attributed to the merger of a large NBFC-MFI with a SCB2. Apart from the MFI led model, National Bank for Agriculture and Rural Development (NABARD) has pioneered the Self Help Group-Bank Linkage Programme (SHG-BLP), which also contributes to the overall microfinance universe. As on March 31, 20203 there were 56.77 lakh SHGs, with loans outstanding of ₹1.08 lakh crore under SHG-BLP. 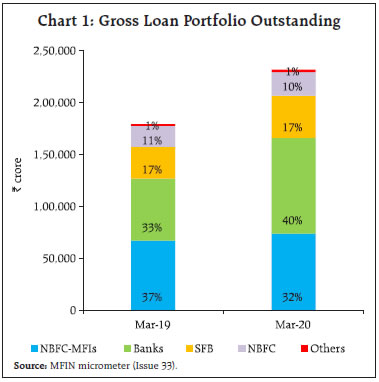 In terms of geographical spread, East, North-East and South India account for 67 per cent of MFIs’ loan portfolio while the remaining 33 per cent is spread across West, North and Central India (Chart 2). Among different states, Tamil Nadu holds the largest share of microfinance loan portfolio followed by West Bengal and Bihar. III. Portfolio Delinquency: The Demonetisation Experience MFIs largely serve in rural and semi-urban areas. The penetration of digital infrastructure in such areas is low and internet connectivity is poor. This lack of access is accentuated by low literacy levels among microfinance borrowers, who are generally daily wage earners and tend to transact in cash. Therefore, MFI operations have traditionally been cash-intensive. Consequently, demonetisation in November 2016 imposed a cash crunch on MFI sector. Portfolio at Risk (PAR) has been used to measure credit delinquencies with three separate buckets, i.e., PAR 1-30 (1-30 days overdue), PAR 31-180 (31-180 days overdue) and PAR180+ (more than 180 days overdue). Point-in-time values of PAR buckets are depicted at quarterly rests, starting from end-September 2016 to end-December 2019 (Chart 3). Demonetisation produced a sudden spike in PAR 1-30 levels, which rose to around 10 per cent at end-December 2016, almost 7 times the corresponding value at the end of the previous quarter, on account of the impact on loan collections. As cash situation eased and collections improved during subsequent months, there was a sharp recovery in PAR 1-30 values, which settled at 3.7 per cent at end-June 2017 and 1.6 per cent at end-June 2018, respectively. The early delinquencies observed in the PAR 1-30 bucket at end-December 2016 migrated to PAR 31-180 and PAR180+ buckets with 1 period and 3 period lags, respectively. Accordingly, PAR 31-180 and PAR180+ values peaked at end-March 2017 and end-September 2017, respectively. However, there was a marked variation in the behavior of early delinquency buckets of PAR 1-30 and PAR 31-180 when compared with the PAR180+ bucket. While early delinquencies were buoyant and recovered sharply, touching pre-demonetisation levels, the PAR180+ bucket remained relatively sticky. After peaking at a level of 6.7 per cent at end-September 2017, PAR180+ dropped gradually, although, it remained elevated in relation to pre-demonetisation levels. The PAR 180+ value of 4.4 per cent at end-June-2019 was majorly contributed by loans disbursed prior to demonetisation. Comparatively, PAR 180+ for post-demonetisation event disbursements stood at 1.4 per cent at end-June 2019. 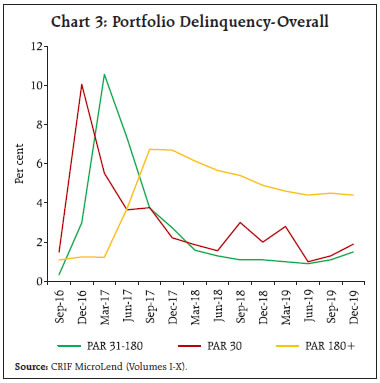 Subsequently, 50 million new Pradhan Mantri Jan Dhan Yojana (PMJDY) accounts were opened by October 2017 and digitisation of retail payments accelerated (Singh et al., 2017). In the fourth quarter of 2016-17, 39 per cent4 of total disbursements by NBFC-MFIs were through cashless mode, which improved to 92 per cent5 during the fourth quarter of 2019-20 signaling greater adoption of digital means of payment by MFIs. More recently, MFIs have adopted technological innovations like digital on-boarding of clients and app-based credit bureau checks, loan sanctions and appraisals. On the other hand, cashless repayments have still not picked up and constitute only about a third of total loan collections6. IV. Portfolio Delinquency and Localised Disruptions The impact of socio-political events in Uttar Pradesh (U.P) and Maharashtra (M.H) was visible in the behavior of the PAR180+ bucket (Chart 4). While PAR180+ delinquency of the overall MFI portfolio (pan-India) peaked at levels of 6.7 per cent at end-September 2017, the corresponding values of PAR180+ for the U.P. and M.H. MFI portfolios stood at much elevated levels of 11.5 and 19.1 per cent, respectively. Over the subsequent quarters, the delinquency levels in these states decreased but remained elevated in comparison with overall MFI delinquency levels. The overall MFI portfolio write-offs rose consistently over succeeding quarters (Chart 4). In 2018, natural calamities occurred in different parts of India. In August 2018, there was widespread flooding in Kerala. This was followed by Cyclone Titli and Cyclone Fani in Orissa and Cyclone Gaja in Tamil Nadu. PAR 1-30 for MFI portfolio in Kerala rose sharply to 44 per cent at end-September 2018 (Chart 5). The corresponding value of PAR 1-30 for the overall MFI (pan-India) portfolio was 3 per cent. This steep rise in early credit delinquencies in the Kerala MFI portfolio was due to flooding, which disrupted MFI operations in several parts of the state. However, the impact on early credit delinquencies was transient and PAR 1-30 of the MFIs’ Kerala portfolio recovered sharply and dropped to a level of 2.2 per cent at end-June 2019 due to improved collections. There was a lagged spillover of early delinquencies to PAR180+, which increased from 1 per cent at end-December 2018 to 2.3 per cent at end-December 2019. 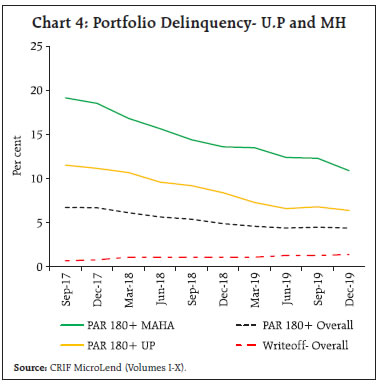
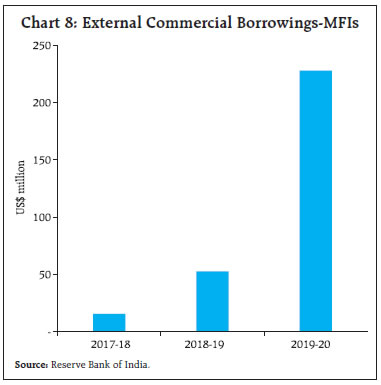
 More recently, credit delinquencies have risen in MFIs’ portfolio in Assam (Chart 6). The rise in PAR1-30 was first observed at end-September 2019 when it rose to 2.3 per cent. The rise in delinquencies in Assam was initially attributed to the economic slowdown in tea plantation districts and the corresponding impact on the repayment capacity of microfinance borrowers. Thereafter, anti-CAA (Citizenship Amendment Act) disruptions at the end of the year led to a spike in delinquencies. Accordingly, at end-December 2019, the credit stress intensified in Assam and PAR1-30 of the Assam portfolio rose sharply to around 16 per cent. In comparison, the corresponding value of PAR1-30 for overall MFI portfolio (pan-India) was 1.9 per cent at end-December 2019. V. IL&FS Event NBFC-MFIs constitute a major share of the overall microfinance universe with their gross loan portfolio amounting to ₹74,371 crore as on March 31, 20207. The failure of IL&FS in 2018 and successive developments led to worsening of risk perception and accentuated liquidity stress in the sector. Better performing companies continued to raise funds while those with Asset–liability Mismatch (ALM) and/or asset quality concerns were subjected to higher borrowing costs (RBI, 2019). Traditionally, the asset base of NBFC-MFIs consists of small ticket loans with a short tenure and high repayment frequency while the liability side comprises mostly long-term borrowings. Therefore, NBFC-MFIs were better placed than other NBFCs having ALM concerns. Further, bank credit to NBFC-MFIs extended for on-lending to specified sectors is eligible for categorisation as priority sector lending. Hence, banks are generally incentivised to lend to NBFC-MFIs. Nonetheless, the funding profile of NBFC-MFIs did undergo gradual change in the last three financial years starting 2017-18. It is observed that the liquidity crunch disproportionately affected small and medium sized NBFC-MFIs as opposed to large NBFC-MFIs9. As on March 31, 2020 the total outstanding borrowings of NBFC-MFIs stood at ₹ 53,656 crore. Term loans constituted major share (74.1 per cent) of the debt outstanding. Further, the breakup of sources of term loans for different groups of NBFC-MFIs reveals that for large NBFC-MFIs, banks are the dominant source for long term loans while small and medium NBFC-MFIs source the bulk of term loans from other NBFCs (Chart 7). 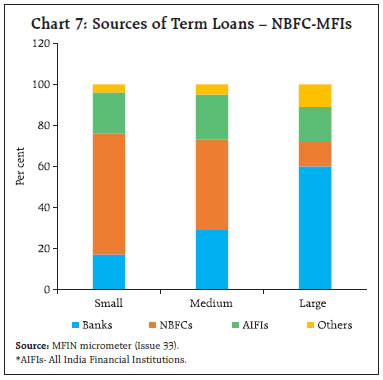 The funding patterns of NBFC-MFI groups (Table 1) reveal that most of the incremental debt funding, starting 2017-18, was garnered by large NBFC-MFIs while small and medium NBFC-MFIs struggled to get funds. This was largely attributed to the higher dependence of small and medium NBFC-MFIs on other NBFCs for their funding requirements. Another interesting development in the funding pattern of NBFC-MFIs was the increased reliance on securitisation as a tool for raising funds which, in turn, also helped in freeing up capital and sustaining high levels of portfolio growth. Securitisation volumes of large NBFC-MFIs during 2019-20 soared to almost 9 times the volumes observed during 2017-18 and accounted for around 46 per cent of total funds raised by them during 2019-20. However, again the volumes of securitisation were low in case of small and medium NBFC-MFIs. The strained financing conditions of NBFC-MFIs also spawned financial ingenuity, which led to securitisation through structures involving pooling of assets by multiple originator NBFC-MFIs9. Also, a noteworthy addition in the funding profile of MFIs (including NBFC-MFIs and not for profit MFIs) was of External Commercial Borrowings (ECBs) as MFIs tried to diversify their sources of funds. ECBs recorded average growth of 284 per cent, rising from around US$ 16 million in 2017-18 to around US$ 228 million in 2019-2010 (Chart 8). However, ECBs still account for a small share of overall borrowings of NBFC-MFIs. | Table 1: Debt Funds Raised and Securitisation Volumes during the Financial Year8 | | (₹ crore) | | | 2017-18 | 2018-19 | 2019-20 | | NBFC-MFI (Grouping by Gross Loan Portfolio (GLP)) | Debt funds | Securitisation | Debt funds | Securitisation | Debt funds | Securitisation | | Small (GLP<₹100 crore) | 461 (2.7) | 24 (0.6) | 313 (1) | 44(0.4) | 357 (0.8) | 20 (0.1) | Medium (₹100 crore | 2380 (13.8) | 182 (4.6) | 2720 (8.6) | 313(2.6) | 2991 (7.1) | 649 (1.9) | | | Large (GLP>₹500 crore) | 14389 (83.5) | 3718 (93.8) | 28656 (90.4) | 11665 (97) | 38803 (92.1) | 32808 (98) | | Total | 17230 | 3924 | 31689 | 12022 | 42151 | 33477 | Note: Figures in parenthesis represent percentage share in total volumes.
Source: MFIN micrometer (Issue 33). |
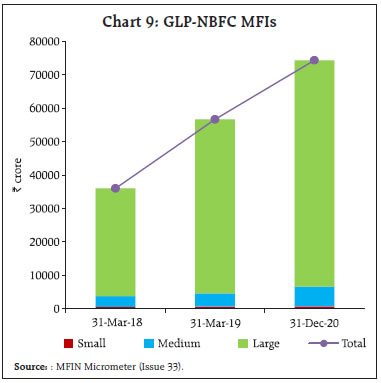 The lack of incremental funding impacted portfolio growth of small and medium NBFC-MFIs (Chart 9). While the GLP of large NBFC-MFIs grew at an average rate of 46 per cent, the portfolio of medium NBFC-MFIs grew at an average rate of 35 per cent during the period. Small NBFC-MFIs experienced the slowest portfolio growth at an average rate of 17 per cent. The lack of growth in on-balance sheet portfolio of small and medium NBFC-MFIs was partly compensated by their increased dependence on fee-based income by acting as Business Correspondents (BC). The BC portfolio of NBFC-MFIs grew from ₹2163 crore as on March 31, 2018 to ₹3918 crore as on March 31, 2020. VI. COVID-19 Challenges The inherent specialised nature of NBFC-MFIs’ loan portfolio, which is largely unsecured, makes them particularly vulnerable to systemic risks posed by COVID-19. In comparison, other microfinance players have relatively more diversified portfolios and have access to low cost deposits, market financing and lender of last resort (LOLR) facility of the Reserve Bank. The hit to the labor market has been particularly acute for low-skilled workers who do not have the option of working from home. Income losses also appear to have been uneven across genders, with women among lower-income groups bearing a larger brunt of the impact (IMF, 2020). Small traders, hawkers and daily wage labourers who constitute a large chunk of microfinance borrowers were the worst hit by the lockdown in April 2020. This category of employment accounted for about 32 per cent of the total employment but it suffered 75 per cent of the hit in April 202011. However, with gradual lifting of lockdowns the employment situation improved in the succeeding months, with overall unemployment rate recovering from 26.19 per cent on April 19, 2020 to 8.13 per cent on August 30, 202012. Credit costs for MFIs are expected to rise. Further, credit discipline may get impacted by disruption to MFI operations. Although MFIs have moved towards cashless disbursements over the years, loan collections are still cash intensive and are, therefore, prone to disruptions in collection infrastructure. Also, in view of difficulty in making loan repayments, a significant proportion of microfinance borrowers have availed loan moratorium. Against this backdrop, recent evidence points to a precipitous fall in collection efficiency13 of microfinance securitisation pools. The collection efficiency first fell to 83 per cent in March 2020 and then moved sharply to a low of 3 per cent in April 2020 before recovering to 21 per cent in May 2020 and 58 per cent in June 2020 (Chart 10). As compared to microfinance pools, other securitisation pools (HL- housing loans, LAP- loans against property, Non-MFI- commercial vehicle loans, gold loans, personal loans etc.) fared better where the drop in collection efficiency was less pronounced. 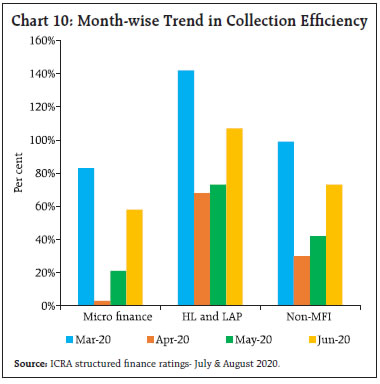 COVID-19 is also expected to pose liquidity risks to NBFC-MFIs (Chart 11). As per the maturity pattern of assets and liabilities of NBFC-MFIs as on March 31, 202014, individual as well as cumulative time buckets exhibit positive gaps (Inflows15> Outflows16). This is owed to the fact that traditionally, liabilities of NBFC-MFIs comprise mainly long-term borrowings while assets comprise short-tenure loans having high repayment frequency. However, the structural liquidity profile may be affected due to problems in loan collections and rise in credit delinquencies due to COVID-19. Further, the moratorium availed by borrowers would affect inflows till the end of moratorium. Two different stress scenarios are depicted, with Scenario-1 assuming 40 per cent drop in loan collections and Scenario-2 assuming 80 per cent drop in loan collections (outflows are assumed to be constant in both scenarios). It is observed that in Scenario-1, cumulative gaps get narrowed but still remain positive across time periods. In Scenario-2, cumulative gaps upto 6-months and upto 1-year turn negative, indicating need for additional funding at an aggregate level. Nonetheless, funding requirements for individual NBFC-MFIs would vary as per their respective standalone liquidity profiles. 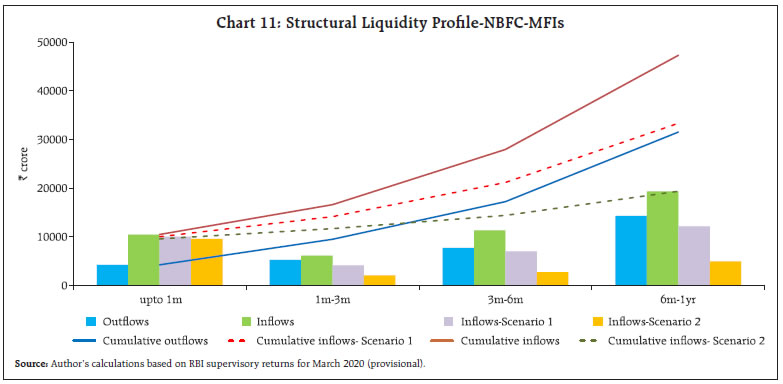 Managing dynamic liquidity would also prove challenging for NBFC-MFIs as they may find it tough to raise incremental funds for making fresh disbursements and meeting operational expenses. Securitisation volumes are also expected to remain muted in the near term given decreasing risk appetite of investors. The impact on liquidity would be relatively higher for smaller NBFC-MFIs who largely depend on borrowings from other NBFCs. Further, they may find it tough to access market borrowings due to lower credit ratings. The loan portfolio of NBFC-MFIs is concentrated in rural areas (Chart-12). Further, majority of NBFC-MFI loans are given for agriculture and allied activities (55.8 per cent), followed by non-agriculture activities (trade, service, manufacturing and production etc.) at 41.4 per cent and household finance (education, medical, others) at 2.8 per cent (Chart 13). In this direction, recently announced government schemes are expected to benefit rural households.
On the back of liquidity measures undertaken by the Reserve Bank and improved market financing conditions, non-convertible debentures (NCD) issuances of NBFC-MFIs17 witnessed a significant spike touching record highs in the month of June 2020 (Chart-14). VII. Conclusion COVID-19 event is perhaps the biggest tail risk event in a long time. Owing to the disruptions in supply chain and business operations, the likelihood of loss of livelihoods and consequent drop in household incomes is high. NBFC-MFIs, being specialised institutions extending collateral free loans to low-income groups, are particularly exposed to credit risks in this scenario. Further, repayment rates have dropped significantly, posing liquidity risks. Smaller NBFCs-MFIs are particularly vulnerable to credit rating downgrades, which may hamper their ability to raise fresh capital and access liquidity. At the cusp of the transition to the new decade, the microfinance sector is perhaps experiencing a déjà vu moment. COVID-19 is expected to afflict the microfinance sector with financial risks in the near term. However, it may also incentivise digitisation. Efforts to migrate loan collections to digital platforms may greatly improve operational efficiency and help in minimising event-based disruptions. Further, data analytics may be leveraged for predicting portfolio behavior, building risk models and designing customer centric products. At this juncture, when the risk of spread of misinformation is high, it is important that credit discipline be maintained. Increasing engagement with borrowers through virtual/telephonic means and sensitising staff on fair practices code would go a long way in restoring confidence in borrowers and rebooting the credit cycle. Further, responsible lending practices need to be adopted to ensure that loan amounts are commensurate with borrower’s ability to repay and that there are no instances of multiple/over-lending. As past events have demonstrated, portfolio diversification across geographies is essential due to recurring localised disruptions, which impact MFI operations. Further, NBFC-MFIs, especially smaller ones, need to diversify their sources of funds for sustaining healthy portfolio growth. Going forward, building capital buffers and managing liquidity would be crucial for MFIs in fortifying their balance sheets against COVID-19 led disruptions. In this milieu, it is imperative that the microfinance sector utilise past lessons and work towards transforming the pandemic into new possibilities. References IMF (2020), “A Crisis Like No Other, An Uncertain Recovery”, World Economic Outlook Update, June 2020. Fernandes, K. (2020), “Microfinance recovery analysis: Using time series of Northern Arc portfolio data”, World Bank blogs. RBI (2019), Financial Stability Report, June 2019. Singh, B., Behera, H.,Raut, D. & Roy, I. (2017), “Impact of Demonetisation on the Financial Sector”, Reserve Bank of India Bulletin, Vol. LXXI No. 11 Sinha, A. (2012), “Strengthening Governance in Microfinance Institutions (MFIs) - Some Random Thoughts”, Keynote address delivered by Sh. Anand Sinha, former Deputy Governor, Reserve Bank of India at FICCI’s Workshop on ‘Strengthening Microfinance Institutions (MFIs): Good Governance and Strategic People Practices’, April 23, 2012. RBI (2011), Report of the Sub-Committee of the Central Board of Directors of Reserve Bank of India to Study Issues and Concerns in the MFI Sector (Chairman: Shri YH Malegam).
|