Provisional accounts (PA) data of central government finances for 2019-20 released by the Office of Controller General of Accounts (CGA) on May 29, 2020 points to deterioration in the fiscal balances primarily led by shortfall in revenues consequent upon growth slowdown and structural measures being taken to address it during the year. Any curtailment in expenditure, on the other hand, has been avoided in view of the economic slowdown that deepened from the second half of 2018-19. Given that the budget estimates of 2020-21 were projected on the basis of 2019-20 revised estimates (RE), a shortfall in tax revenue collections in 2019-20 (PA) vis-à-vis 2019-20 (RE) may distort the fiscal arithmetic for 2020-21. Introduction Against the backdrop of the COVID-19 pandemic, this article presents a synoptic overview of the provisional accounts (PA) of the Government of India (GoI) in 2019-20. The revised estimates (RE) for 2019-20 released with the Union Budget for 2020-21 on February 1, 2020, had revealed a deterioration in the GoI finances relative to budget estimates (BE), warranting the use of Fiscal Responsibility and Budget Management (FRBM) escape clause. The provisional accounts show a further deterioration in the fiscal balances, primarily due to shortfall in revenues. Against this background, the rest of the article is divided into eight Sections, including this introductory Section. In the immediately following Section, the gross fiscal deficit and its underlying fiscal arithmetic has been discussed. Sections III and IV examine receipts and spending, respectively. Section V deals with the financing pattern of gross fiscal deficit (GFD). Section VI addresses outstanding liabilities of the GoI. Section VII presents an analysis of resource transfers from GoI to states. Section VIII sets out concluding observations. Data are presented in Annex 1. II. The Fiscal Arithmetic underlying Provisional Accounts The provisional accounts for a fiscal year are available with a lag of about two months, while final accounts arrive with an additional lag of about eight months1. Provisional Accounts tend to be close to actual data than BE and RE (Chart 1). The provisional accounts place the GoI’s gross fiscal deficit at 4.6 per cent of GDP for 2019-20, overshooting by 0.8 per cent of GDP over the RE (3.8 per cent of GDP) and by about 1.3 per cent of GDP over the BE (3.3 per cent of GDP). The overshoot of 0.5 per cent of GDP between BE and RE itself warranted invoking the provisions under section 4(3) of the revised FRBM Act2. The deterioration in the GFD in 2019-20 was primarily caused by a decline of 1.1 per cent of GDP in net tax revenues from the BE (Table 1). Performance since FRBM In a long-term perspective, the period since the enactment of the FRBM Act in 2003 can be divided into phases (Chart 2). The immediate post-FRBM period witnessed significant consolidation, with the GFD declining from above 4 percent in 2003-04 to 2.7 percent in 2007-08, supported by high GDP growth and the associated higher tax buoyancy. The five-year period since 2008-09 was associated with a large scale fiscal stimulus to counteract the effects of the global financial crisis (GFC). The period 2013-14 till about 2016-17 saw fiscal rectitude with a decline in the overall GFD-GDP ratio by about 1 percentage point (4.4 percent in 2013-14 to 3.5 per cent in 2016-17) albeit, via cuts in expenditures. The period since 2017-18 is marked by a pause in fiscal consolidation, with a sizeable overshoot in 2019-20 (Chart 2). India has entered the COVID-19 pandemic in 2020-21 with constrained fiscal space, unlike during the immediate pre-GFC period3. 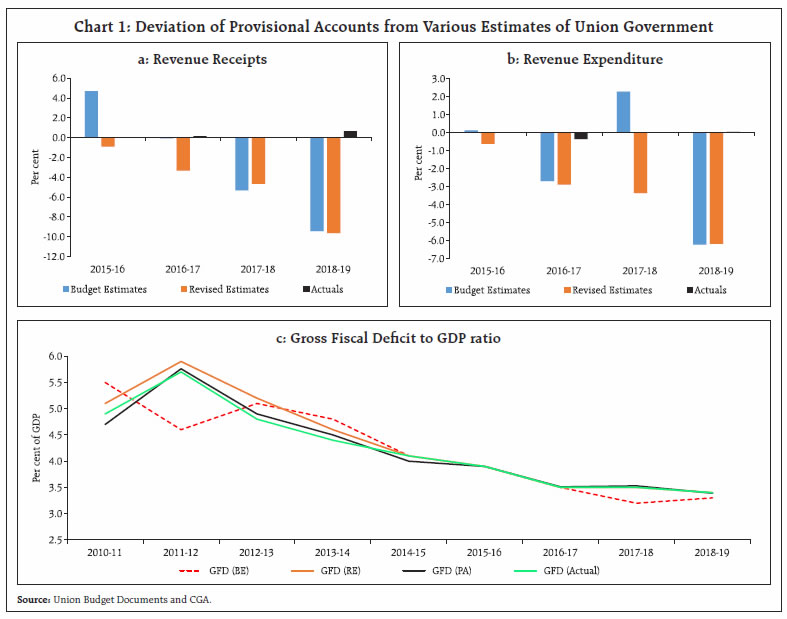
| Table 1: Key Fiscal Indicators (Per cent of GDP) | | | 2018-19 | 2019-20 | 2020-21 | | Actuals | BE | RE | PA | BE | | 1 | 2 | 3 | 4 | 5 | 6 | | 1. Fiscal Deficit | 3.4 | 3.3 | 3.8 | 4.6 | 3.5 | | 2. Revenue Deficit | 2.4 | 2.3 | 2.4 | 3.3 | 2.7 | | 3. Primary Deficit | 0.4 | 0.2 | 0.7 | 1.6 | 0.4 | | 4. Net Tax Revenue | 6.9 | 7.8 | 7.4 | 6.7 | 7.3 | | 5. Non-Tax Revenue | 1.2 | 1.5 | 1.7 | 1.6 | 1.7 | | 6. Revenue Expenditure | 10.6 | 11.6 | 11.5 | 11.6 | 11.7 | | 7. Capital Expenditure | 1.6 | 1.6 | 1.7 | 1.7 | 1.8 | | Memo Item: | | Nominal GDP growth (in per cent) | 11.0 | 12.0 | 7.8 | 7.2 | 10.0 | | Source: Union Budget Documents, CGA and NSO. |
The Underlying Dynamics While some part of the fiscal deterioration in 2019-20 was anticipated because of the structural reforms undertaken in corporate taxes and goods and services tax (GST), the unanticipated component came from the sharp deceleration in nominal GDP growth (from 12.0 per cent in BE to 7.8 per cent in RE and 7.2 per cent in PA). A slowdown in GDP growth impacts the GFD-GDP ratio in two ways: (i) automatic stabilisers come into play as tax revenues fall naturally, as GDP slows4, thereby pushing up the numerator; and (ii) the denominator is lower than budgeted due to less than projected nominal growth in GDP. Together these two comprise the cyclical component, i.e., the impact of business cycles on the fiscal balance. Adjusting the actual fiscal balance for this cyclical impact gives the structural component of the fiscal balance that essentially reflects discretionary changes on account of policy actions. During 2019-20, BE to PA, cyclical and structural factors have equally shared in the fiscal slippage (Chart 3). Adjusting for the cyclical effects, the GFD works out to 4.0 per cent of GDP5, lower by 61 basis points than the provisional estimates, of which 13 basis points is due to the direct impact of lower GDP growth on the denominator. It may be noted that the major part of the structural slippage (about 50 bps out of 65 bps) was on account of the corporate tax rate and minimum alternate tax (MAT) rate cut along with incentive for new manufacturing companies that had necessitated the use of escape clause6. 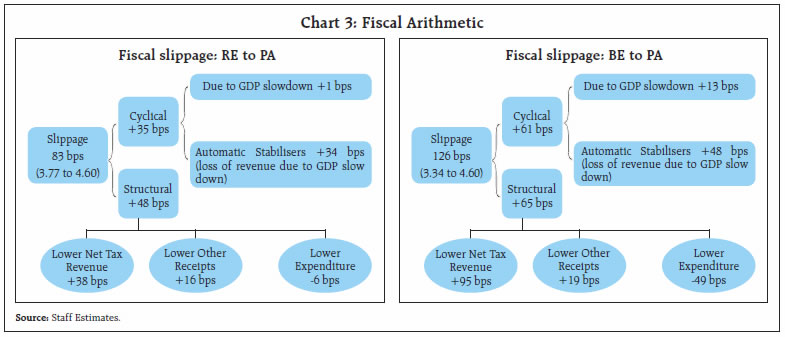
| Table 2: Decomposition of GFD | | (Per cent) | | | 2017-18 | 2018-19 | 2019-20 | 2020-21 | | BE | Actual | BE | Actual | BE | RE | PA | BE | | 1 | 2 | 3 | 4 | 5 | 6 | 7 | 8 | 9 | | 1. Revenue Deficit | 58.8 | 75.1 | 66.6 | 70.0 | 68.9 | 65.1 | 71.3 | 76.5 | | 2. Capital Outlay | 49.4 | 41.5 | 44.6 | 43.0 | 44.2 | 41.9 | 33.1 | 47.8 | | 3. Net Lending | 5.1 | 0.4 | 1.5 | 1.6 | 1.8 | 1.4 | 0.9 | 2.1 | | 4. Disinvestment (minus) | 13.3 | 16.9 | 12.8 | 14.6 | 14.9 | 8.5 | 5.4 | 26.4 | | Source: Union Budget Documents and CGA. | Decomposition of GFD The revenue deficit pre-empted more than 70 per cent of the GFD in 2019-20, a phenomenon that has started since 2017-18. Unlike in 2017-18 and 2018-19, however, funding support from disinvestments fell in 2019-20 PA, lowering capital outlay share (Table 2). The fiscal stress has to be seen in context of the support that it has provided to GDP in these years. While the National Statistical Office’s (NSO) latest GDP print released on May 29, 2020 shows a real growth rate of 4.2 per cent in 2019-20; it would have been only 3.3 per cent, excluding government spending (Chart 4). III. Receipts In 2019-20 (PA), total receipts stood at 8.6 per cent of GDP, as against the BE of 9.9 per cent and RE of 9.5 per cent, respectively. This shortfall was due to net tax revenues which stood at 6.7 per cent of GDP and disinvestment receipts which stood at 0.2 per cent of GDP, as against the BE of 7.8 per cent and 0.5 per cent, respectively. Non-tax revenues held up well and even exceeded the BE modestly. Tax Revenues In 2019-20, growth rate of 18.3 per cent was budgeted for gross tax revenue as against the average of 14.4 per cent achieved during 2010-11 to 2018-19. In the revised estimates, it was reduced to 4.0 per cent but the realised growth rate as per 2019-20 PA was (-) 3.4 per cent, as reflected in the declining buoyancy (Chart 5). As discussed earlier, the unprecedented shortfall in tax collection during 2019-20 may be attributed to three broad reasons: (1) cyclical slowdown in growth during the year, (2) structural measures in terms of mid-year rationalisation of corporation tax rate coupled with cut in MAT rate and incentive for new manufacturing domestic companies; and (3) some other measures viz., exemption from income-tax to individuals earning income up to ₹5 lakh along with increase in standard deduction, as announced in the Budget earlier and extension of deadlines ending on March 31, 2020 (including Vivaad se Vishwaas scheme) and eased conditions for delayed tax payments as announced towards end of the fiscal (PIB, 2020). 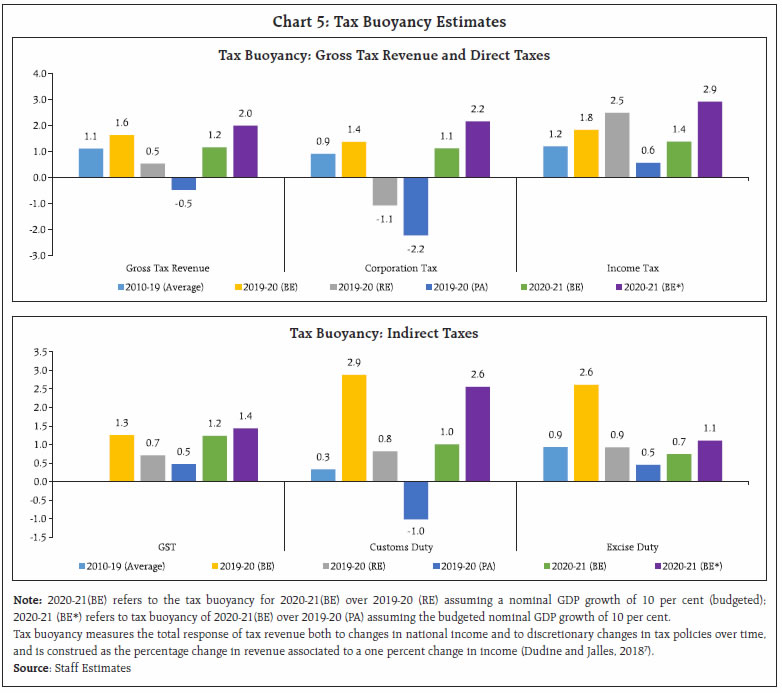
| Table 3: Tax Revenue of Central Government | | | ₹ thousand crore | Per cent to GDP | Growth Rate (per cent) | | 2018-19 | 2019-20 (BE) | 2019-20 (RE) | 2019-20 (PA) | 2020-21 (BE) | 2019-20 (BE) | 2019-20 (RE) | 2019-20 (PA) | 2019-20 (BE) | 2019-20 (RE) | 2019-20 (PA) | | 1 | 2 | 3 | 4 | 5 | 6 | 7 | 8 | 9 | 10 | 11 | 12 | | 1. Direct tax | 1,137 | 1,335 | 1,170 | 1050 | 1,319 | 6.3 | 5.7 | 5.2 | 17.5 | 2.9 | -7.7 | | of which: | | | | | | | | | | | | | i. Income tax | 461 | 556 | 547 | 480 | 625 | 2.6 | 2.7 | 2.4 | 20.5 | 18.5 | 4.1 | | ii. Corporation tax | 664 | 766 | 611 | 557 | 681 | 3.6 | 3.0 | 2.7 | 15.4 | -8.0 | -16.1 | | 2. Indirect tax | 944 | 1,126 | 993 | 960 | 1,104 | 5.3 | 4.9 | 4.7 | 19.3 | 5.3 | 1.7 | | of which: | | | | | | | | | | | | | i. GST | 582 | 663 | 612 | 599 | 691 | 3.1 | 2.9 | 3.0 | 14.1 | 5.3 | 3.0 | | ii. Customs | 118 | 156 | 125 | 109 | 138 | 0.7 | 0.6 | 0.5 | 32.3 | 6.1 | -7.3 | | iii. Excise | 232 | 300 | 248 | 240 | 267 | 1.4 | 1.2 | 1.2 | 29.3 | 6.9 | 3.3 | | 3. Gross Tax Revenue (1+2) | 2,080 | 2,461 | 2,163 | 2,010 | 2,423 | 11.7 | 10.6 | 9.9 | 18.3 | 4.0 | -3.4 | Note: For 2019-20 (PA) ‘other taxes’, as reported by CGA, have been classified into direct and indirect taxes proportionately.
Source: Union Budget Documents and CGA. | Direct Taxes For direct taxes, as against the budgeted buoyancy of 1.6, the realised buoyancy in 2019-20 (PA) turned out to be significantly lower at (-) 1.1, with realised collections in corporation taxes showing a decline of 16 per cent in PA (Table 3). This sharp decline may be attributed to, among others, rationalisation of corporation tax rate which brought down the effective rate of tax for domestic companies to 25.17 per cent. Income tax, on the other hand, fared relatively better, with a positive realised buoyancy. Indirect Taxes The indirect taxes registered a buoyancy of 0.2 vis-à-vis the budgeted buoyancy of 1.7. A majority of this decline was led by shortfall in GST, followed by union excise duties and custom duties. Non-Tax Revenues Non-tax revenue provided some cushion to government finances in 2019-20. On the back of higher surplus transfers from the Reserve Bank, non-tax revenue in 2019-20 (PA) registered a growth of 38.4 per cent over the previous year, surpassing the budget estimates for 2019-20 (Chart 6). Non-debt Capital Receipts Disinvestment receipts in 2019-20 were budgeted at ₹1.05 lakh crore. As per 2019-20 (PA), however, less than half of this amount could be realised (Chart 7).
IV. Expenditure Pattern Though, total expenditure as per PA has registered a y-o-y growth of 16 per cent, falling short of BE by 3.6 per cent, any major curtailment in expenditure from RE to PA has been avoided given the pressures emanating from growth slowdown (Table 4). Interest payments, though higher than in the previous fiscal by nearly 5 per cent, were less than the BE and the RE. Expenditure on major subsidies has grown y-o-y by 13.4 per cent, despite being curbed vis-a-vis the budget estimates. It was, however, almost maintained at the levels of RE with some curtailment in petroleum subsidy vis-a-vis RE. Petroleum subsidies have grown the most, by more than 30 per cent since the previous fiscal. Food subsidy, on the other hand, which has the highest allocation among all subsidies, was curtailed by over 40 per cent (PA) with respect to the budgeted amount, but was maintained at its RE. | Table 4: Expenditure of Central Government | | Item | ₹ thousand crores | Growth Rate of PA (Per cent) | | 2018-19 (Actual) | 2019-20 (BE) | 2019-20 (RE) | 2019-20 (PA) | 2020-21 (BE) | Over 2018-19 | Over BE | Over RE | | 1 | 2 | 3 | 4 | 5 | 6 | 7 | 8 | 9 | | 1. Total Expenditure | 2,315 | 2,786 | 2,699 | 2,686 | 3,042 | 16.0 | -3.6 | -0.5 | | 2. Revenue Expenditure | 2,007 | 2,448 | 2,350 | 2,350 | 2,630 | 17.0 | -4.0 | 0.0 | | (of which) | | | | | | | | | | (i) Interest Payments | 583 | 660 | 625 | 611 | 708 | 4.9 | -7.5 | -2.3 | | (ii) Major Subsidies | 197 | 302 | 227 | 223 | 228 | 13.4 | -26.0 | -1.8 | | Food | 101 | 184 | 109 | 109 | 116 | 7.3 | -41.0 | 0.0 | | Fertiliser | 71 | 80 | 80 | 81 | 71 | 14.9 | 1.4 | 1.4 | | Petroleum | 25 | 37 | 39 | 33 | 41 | 34.5 | -10.9 | -13.4 | | 3. Capital Expenditure | 308 | 339 | 349 | 337 | 412 | 9.4 | -0.5 | -3.5 | | Source: Union Budget Documents and CGA. |
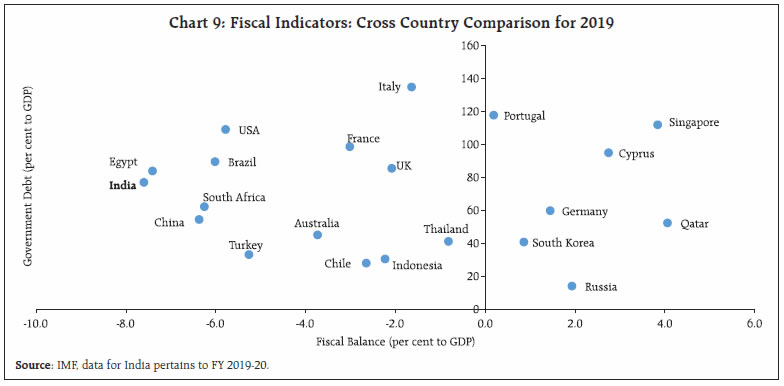
| Table 5: Ministry-wise Expenditure of Central Government | | Item | ₹ thousand crores | Growth Rate of PA (Per cent) | | 2018-19 (Actual) | 2019-20 (BE) | 2019-20 (RE) | 2019-20 (PA) | Over 2018-19 | Over BE | Over RE | | 1 | 2 | 3 | 4 | 5 | 6 | 7 | 8 | | 1. Defence | 403 | 431 | 449 | 453 | 12.2 | 5.0 | 0.8 | | 2. Road Transport and Highways | 77 | 83 | 83 | 78 | 1.2 | -5.7 | -5.7 | | 3. Railways | 55 | 68 | 70 | 70 | 27.4 | 2.8 | 0.0 | | 4. Petroleum and Natural Gas | 32 | 43 | 43 | 43 | 32.3 | -0.2 | -0.2 | | 5. Housing and Urban Affairs | 41 | 48 | 42 | 42 | 3.6 | -12.4 | -0.5 | | Source: Union Budget Documents and CGA. | Among ministries with high budgetary outlays, expenditure by the Ministry of Defence increased by about 12 per cent, higher than the budgeted amount and the RE (Table 5). Similarly, spending by the Ministry of Road Transport and Highways and the Ministry of Railways has been higher than the previous year by around 1 per cent and 27 per cent, respectively. Ministries of Defence, Road Transport and Highways and Railways form the major share of the capital expenditure, viz., about 70 per cent of total budgetary capital outlay. Among these, Road Transport and Highways, along with Railways comprise about 40 per cent of the total capital expenditure. Though Defence and Railways recorded a y-o-y growth, the spending as per PA was higher than RE for Defence, but lower for railways (Table 6). Contrarily, the capital spending by Road Transport and Highways has been compressed since the previous year and PA has been lower than both RE and BE. | Table 6: Ministry-wise Capital Expenditure of Central Government | | Item | ₹ thousand crores | Growth Rate of PA (Per cent) | | 2018-19 (Actual) | 2019-20 (BE) | 2019-20 (RE) | 2019-20 (PA) | Over 2018-19 | Over BE | Over RE | | 1 | 2 | 3 | 4 | 5 | 6 | 7 | 8 | | 1. Defence | 100 | 108 | 115 | 116 | 16.3 | 7.2 | 0.6 | | 2. Railways | 53 | 66 | 68 | 68 | 28.4 | 3.0 | 0.0 | | 3. Road Transport and Highways | 68 | 72 | 72 | 67 | -0.6 | -6.6 | -6.8 | | 4. Housing and Urban Affairs | 16 | 20 | 19 | 19 | 22.4 | -1.2 | 0.6 | | 5. Power | 2 | 2 | 2 | 2 | -21.0 | -32.7 | -11.4 | | Source: Union Budget Documents and CGA. | V. GFD Financing Gross market borrowing through dated securities remained intact at ₹7.1 lakh crore in 2019-20, as budgeted. While share of financing via net market borrowing for 2019-20 has remained around 60 per cent, the share of financing through the National Small Savings Fund (NSSF) has seen a rise to about 26 per cent (Table 7). VI. Outstanding liabilities Total outstanding liabilities of the Union government inflated sharply in 2019-20 (PA) from its level in 2018-19 (Chart 8). The government in its Medium Term Fiscal Policy Statement, released along with the Union Budget 2020-21, had projected that the outstanding liabilities will contract to 45.5 per cent by 2022-23. This, however, looks unlikely given the escalation witnessed in 2019-20 (PA) from the BE/RE and the likely hike expected for 2020-21 in view of COVID-19 related stimulus measures, thus, necessitating a redrawing of the fiscal roadmap. The debt servicing capacity represented by ratio of interest payments to revenue receipts, albeit lower than 2018-19, deteriorated from 2019-20 BE and RE. | Table 7: GFD Financing | | (Amount in ₹ thousand crore) | | Item | 2018-19 (Actual) | 2019-20 (BE) | 2019-20 (RE) | 2019-20 (PA) | 2020-21 (BE) | | 1 | 2 | 3 | 4 | 5 | 6 | | Gross Fiscal Deficit | 649 | 704 | 767 | 936 | 796 | | | (100) | (100) | (100) | (100) | (100) | | Financed by | | | | | | | Net Market Borrowings | 430 | 498 | 499 | 556* | 570 [990]** | | | (66.3) | (70.7) | (65.1) | (59.4) | (71.6) | | NSSF | 125 | 130 | 240 | 240 | 240 | | | (19.3) | (18.5) | (31.3) | (25.7) | (30.2) | | External Assistance | 6 | -3 | 5 | 12 | 5 | | | (0.9) | (-0.4) | (0.7) | (1.2) | (0.6) | | State Provident Fund | 16 | 18 | 18 | 12 | 18 | | | (2.5) | (2.6) | (2.3) | (1.2) | (2.3) | | Reserve Fund | -18 | -1 | 0 | 3 | 3 | | | (-2.8) | (-0.1) | (0.0) | (0.3) | (0.4) | | Draw Down of Cash Balances | -1 | 51 | 0 | 76 | -53 | | | (-0.2) | (7.2) | (0.0) | (8.1) | (-6.7) | | Others | 91 | 11 | 5 | 37 | 13 | | | (14.0) | (1.6) | (0.7) | (4.0) | (1.6) | | Memo Item | | | | | | | Gross Borrowings through dated securities | 571 | 710 | 710 | 710 | 780 [1200]** | Notes: Net market borrowings include borrowings through dated securities along with 91-day, 182-day, 364-day and all other treasury bills.
*: Market borrowing for 2019-20 (PA) is inclusive of CMBs
**: Additional market borrowings of ₹4.2 lakh crore has been announced by GoI after budget.
Others include deposits and advances, buyback of securities, switching off of securities, Cash Management Bills, Ways and Means Advances, saving bonds, relief bonds, etc.
Figures in parenthesis represent percentages to GFD.
Source: Union Budget Documents and CGA. | With the revised deficit and debt figures, it may be pertinent to observe that unlike the GFC, India has entered the COVID-19 pandemic at a relatively weaker starting position vis-à-vis some of its peers (Chart 9). VII. Tax Devolution from Centre to States While tax revenue showed a significant shortfall in 2019-20 (PA) in comparison to 2019-20 (RE), the tax devolution from Centre to states has not declined commensurately. Tax devolution declined in PA by ₹5,369 crores (0.03 per cent of GDP) from RE and by ₹1.6 lakh crores (0.8 per cent of GDP) from BE (Table 8)8. Considering that devolution to states is undertaken on the basis of RE, the excess transfer of resources from Centre to states (about ₹49,000 crores) would have to be adjusted in the tax devolution to states in 2020-21 which is likely to affect it negatively along with lower devolution due to likely slow-down in 2020-21. Besides, it may be a challenge for Centre in a slowdown year to garner resources for compensation cess to states. Furthermore, it is pertinent to note that the tax devolution budgeted by the Centre does not exactly match with the data reported by states in their budget accounting. States, generally, tend to budget higher than the Centre9. 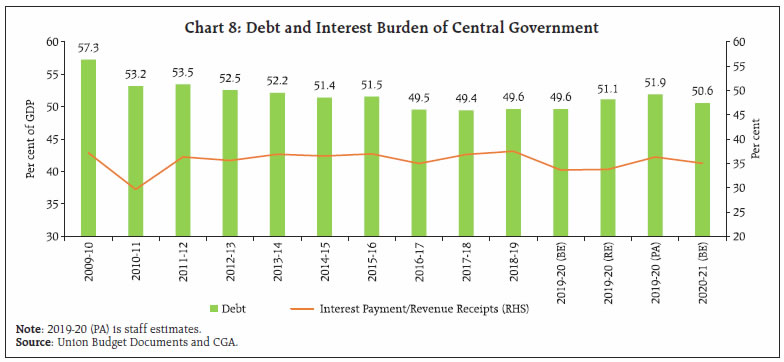
| Table 8: Centre’s Devolution of Taxes to States | | (₹ lakh crore) | | | 2019-20 BE | 2019-20 RE | 2019-20 PA | 2020-21 BE | | 1 | 2 | 3 | 4 | 5 | | Centre’s Gross Tax Revenue | 24.61 | 21.63 | 20.10 | 24.23 | | Tax Devolution to States@ | 8.09* | 6.56 | 6.51 | 7.84 | | Less Excess Tax Devolution in the previous year | | | | 0.49 | | Actual Tax Devolution after adjustment | | | | 7.35 | Notes: @ - Tax Devolution to States is taken as 34.5 per cent of gross tax revenue (the average ratio for 2017-19).
* - States budgeted 8.52 lakh crore in 2019-20 BE as against 8.09 budgeted by Centre.
Source: Union Budget Documents, CGA, State Budget Documents and Staff Estimates | VIII. Conclusion The deterioration in provisional accounts for 2019-20 can be attributed to tax revenue shortfall, both cyclical and structural. Any significant curtailment in expenditure has been avoided in view of the economic slowdown that became accentuated from the second half of 2018-19. Given that the budget estimates of 2020-21 were projected on the basis of 2019-20 RE, a shortfall in tax revenue collections in 2019-20 (PA) vis-à-vis 2019-20 (RE) may distort the fiscal arithmetic for 2020-21. This could be further impacted adversely by COVID-19 related macroeconomic effects in 2020-21, especially Q1. Against this backdrop, fiscal effort in 2020-21 has to be calibrated and judicious, while simultaneously charting out a glide path back to fiscal rectitude once the rough waters calm.
| Annex 1: Key Fiscal Indicators | | | ₹ thousand crore | Per cent to GDP | Growth Rate | | 2018-19 | 2019-20 (BE) | 2019-20 (RE) | 2019-20 (PA) | 2020-21 (BE) | 2019-20 (PA) | 2020-21 (BE) | 2019-20 (PA) | 2020-21 (BE) | | 1 | 3 | 4 | 5 | 6 | 7 | 8 | 9 | 10 | 11 | | 1. Direct Tax | 1,137 | 1,335 | 1,170 | 1,050 | 1,319 | 5.2 | 5.9 | -7.7 | 25.7 | | (i) Corporation | 664 | 766 | 611 | 557 | 681 | 2.7 | 3.0 | -16.1 | 22.3 | | (ii) Income | 461 | 556 | 547 | 480 | 625 | 2.4 | 2.8 | 4.1 | 30.1 | | 2. Indirect Tax | 944 | 1,126 | 993 | 960 | 1,104 | 4.7 | 4.9 | 1.7 | 15.0 | | (i) GST | 582 | 663 | 612 | 599 | 691 | 2.9 | 3.1 | 3.0 | 15.3 | | (ii) Customs | 118 | 156 | 125 | 109 | 138 | 0.5 | 0.6 | -7.3 | 26.4 | | (iii) Excise | 232 | 300 | 248 | 240 | 267 | 1.2 | 1.2 | 3.3 | 11.4 | | 3. Gross tax revenue (1+2) | 2,080 | 2,461 | 2,163 | 2,010 | 2,423 | 9.9 | 10.8 | -3.4 | 20.6 | | 4. Assignment to States & NCCD transfers | 763 | 812 | 659 | 654 | 787 | 3.2 | 3.5 | -14.3 | 20.4 | | 5. Net tax revenue (3-4) | 1,317 | 1,650 | 1,505 | 1,356 | 1,636 | 6.7 | 7.3 | 2.9 | 20.7 | | 6. Non-tax revenue | 236 | 313 | 346 | 326 | 385 | 1.6 | 1.7 | 38.4 | 18.0 | | (i) Dividends and Profits | 113 | 164 | 200 | 186 | 155 | 0.9 | 0.7 | 64.1 | -16.5 | | (ii) Interest Receipts | 12 | 14 | 11 | 12 | 11 | 0.1 | 0.0 | -4.3 | -5.0 | | 7. Revenue Receipts (5+6) | 1,553 | 1,963 | 1,850 | 1,682 | 2,021 | 8.3 | 9.0 | 8.3 | 20.1 | | 8. Non debt capital receipts | 113 | 120 | 82 | 69 | 225 | 0.3 | 1.0 | -39.2 | 227.8 | | (i) Disinvestment receipts | 95 | 105 | 65 | 50 | 210 | 0.2 | 0.9 | -46.9 | 317.5 | | (ii) Recovery of Loans | 18 | 15 | 17 | 18 | 15 | 0.1 | 0.1 | 1.5 | -18.3 | | 9. Total Receipts (ex. borrowings) (7+8) | 1,666 | 2,083 | 1,932 | 1,751 | 2,246 | 8.6 | 10.0 | 5.1 | 28.3 | | 10. Revenue Expenditure | 2,007 | 2,448 | 2,350 | 2,350 | 2,630 | 11.6 | 11.7 | 17.0 | 11.9 | | (i) Interest payments | 583 | 660 | 625 | 611 | 708 | 3.0 | 3.1 | 4.9 | 15.9 | | (ii) Major Subsidies | 197 | 302 | 227 | 223 | 228 | 1.1 | 1.0 | 13.4 | 2.1 | | Food | 101 | 184 | 109 | 109 | 116 | 0.5 | 0.5 | 7.3 | 6.3 | | Fertilizer | 71 | 80 | 80 | 81 | 71 | 0.4 | 0.3 | 14.9 | -12.1 | | Petroleum | 25 | 37 | 39 | 33 | 41 | 0.2 | 0.2 | 34.5 | 22.5 | | 11. Capital expenditure (i + ii) | 308 | 339 | 349 | 337 | 412 | 1.7 | 1.8 | 9.4 | 22.4 | | (i) Capital Outlay | 279 | 311 | 322 | 310 | 380 | 1.5 | 1.7 | 10.8 | 22.8 | | (ii) Loans & Advances | 28 | 28 | 27 | 27 | 32 | 0.1 | 0.1 | -3.8 | 17.0 | | 12. Total Expenditure (10+11) | 2,315 | 2,786 | 2,699 | 2,686 | 3,042 | 13.2 | 13.5 | 16.0 | 13.2 | | 13. Fiscal deficit (12-9) | 649 | 704 | 767 | 936 | 796 | 4.6 | 3.5 | 44.1 | -14.9 | Note: For 2019-20 (PA), ‘other taxes’, as reported by CGA, have been classified into direct and indirect taxes proportionately.
Source: Union Budget Documents and CGA. |
|