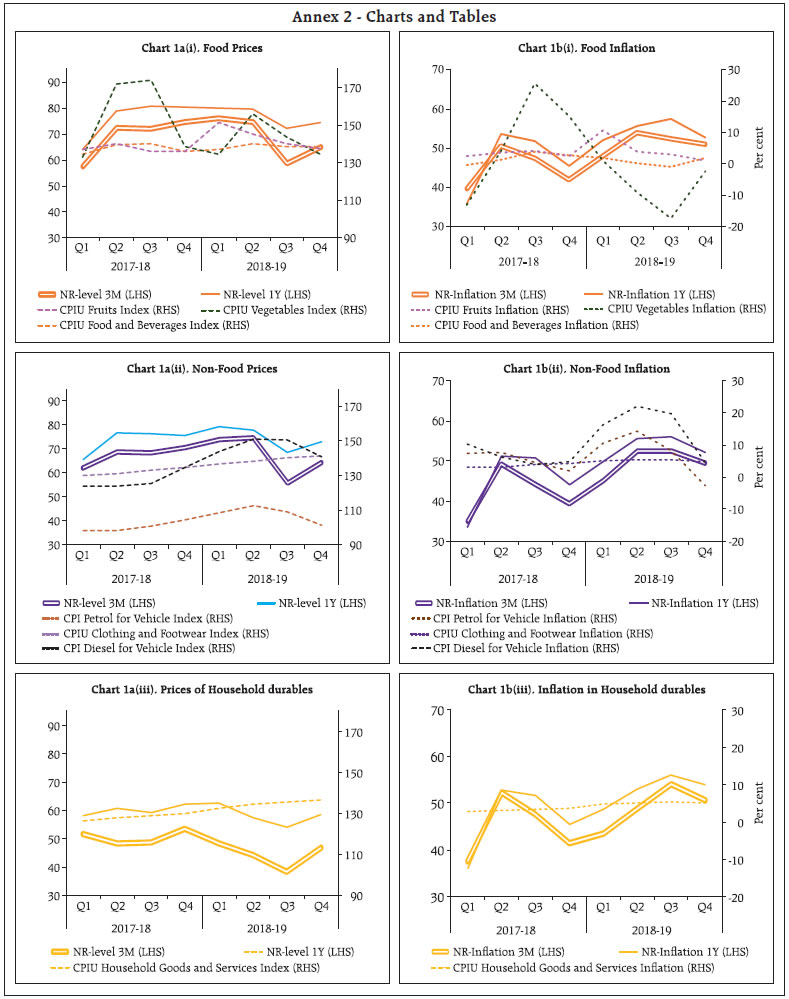
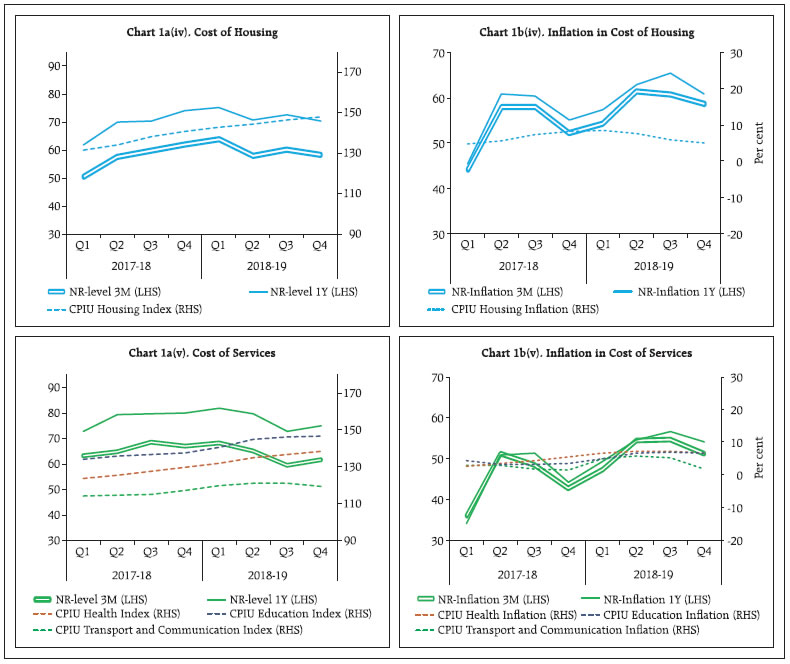
This article studies the characteristics of households’ inflation expectations in India vis-à-vis realised inflation at the aggregate level. It also examines the regional and occupational variations in inflation expectations observed during 2018-19. Majority of the survey centres and occupation categories recorded some hardening of inflation expectations in 2018-19. Analysis for a longer period suggests increasing alignment of respondents’ inflation expectations with the inflation target. Empirical findings suggest that past forecast errors in households’ inflation expectations are helpful in improving inflation forecasts. Introduction Households are economic agents who plan their activities such as savings, expenditure and investment based on several factors, including inflation expectations (IE). Wage negotiations are often benchmarked to changes in households’ inflation outlook (Axelrod et. al., 2018 and Bullard, 2016). The Reserve Bank has been conducting its Inflation Expectations Survey of Households (IESH) in major urban centres since September 2005 (Annex 1). Using the Wholesale Price Index (WPI) inflation and the Consumer Price Index of Industrial Workers (CPI-IW) inflation, Sharma and Bicchal (2018) had observed that inflation expectations in India are not rational. Subsequently, Shaw (2019) transformed the households’ inflation expectations into rational expectations and assessed their forecasting ability vis-à-vis inflation expectations of the professional forecasters. This article studies three aspects of households’ inflation expectations. First, it examines the characteristics of households’ inflation expectations vis-à-vis the Consumer Price Index – Urban (CPI-U) inflation at the aggregate level during 2018-19. Second, it extends the analysis to investigate regional and occupational variations. Finally, using a longer time series data, the article aims to assess the magnitude of forecast error, using time-varying gaps between inflation expectations and the actual inflation. The remainder of the article is organised as follows. Section 2 presents the movements in households’ inflation expectations observed during the four quarters of 2018-19. It also presents an overview of the variations in inflation expectations across major cities and population groups. Section 3 studies changes in inflation expectations of households relative to the inflation target. In Section 4, the properties of inflation expectations have been studied using past deviations of households’ anticipated inflation from realised inflation values. The concluding Section 5 summarises the findings of the study. 2. Households’ Inflation Outlook – Broad Trends Households’ expectations on the general price level varied widely over the quarters during 2018-19. Net response1 on general price level2 showed moderation in price expectations noticeably in Q3:2018-19, before inching up in the next quarter (Chart Ia). In general, net responses remained in the positive terrain during the period and this was corroborated by the gradual increase in the corresponding urban index (CPI-U). Price expectations for various product groups were in line with those of the general prices, except housing prices (Annex 2, Charts 1a(i) to 1a(v)). 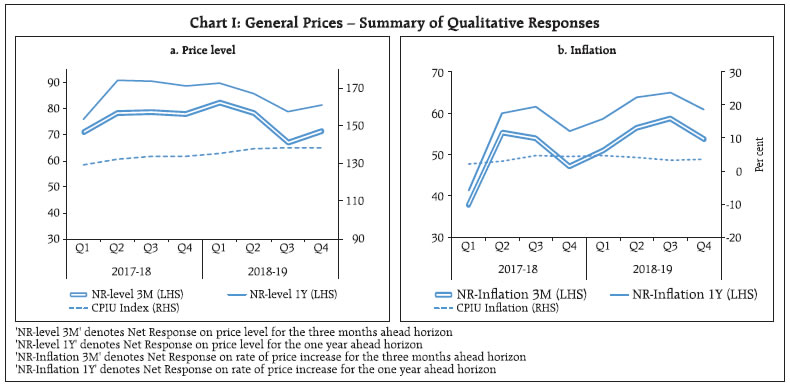 Moving to sentiments on inflation, three months ahead inflation expectations based on net response3 on rate of price increase4 picked up gradually during 2018-19, reaching a maximum in Q3:2018-19, concomitant with the sharp increase in petrol and diesel price inflation during the first half of the year (Chart Ib and Annex 2, Charts 1b(i) to 1b(v)). While the expectations of food inflation for the three months ahead horizon moved up in the first half of 2018-19 reflecting increase in inflation in some items within the food group such as fruits and eggs, sentiments remained at elevated level during the second half of the year in spite of the deflation experienced in vegetables. For the one year ahead horizon, households, in the survey round, Q4:2018-19, expected moderation in food inflation. The expectations on the cost of services remained high on the back of elevated health and education inflation despite moderation in inflation in the transport and communication sub-groups during the last quarter of 2018-19. Despite muted food inflation, households’ median inflation expectations rose sharply during the first half of 2018-19 (Chart IIb) on the back of higher fuel inflation due to rise in prices of liquefied petroleum gas (LPG), petroleum products and transport services. The median inflation expectations ranged between 7.8-9.4 per cent for the three months ahead period and between 8.1-10.1 per cent for the one year ahead period. On a net basis, however, the expectations dropped sharply by 110 basis points and 200 basis points, for three months ahead and a year ahead horizons respectively in Q4:2018-19 over Q1:2018-19 (Charts IIa and IIb). Despite a sharp increase in vegetable inflation in Q4:2018-19, it could not impact the inflation expectations adversely as it was still in deflation. 2a. Regional Variation in Inflation Expectations The regional variation in the change in qualitative responses on inflation expectations from 2017-18 to 2018-19 has been studied in this section. The centres have been classified into optimistic and non-optimistic categories based on the observed decrease/ increase in net response (4 quarters’ average) over this period. The classification presumes that an increase in net response as compared to the previous year denotes higher perceived inflation pressure in 2018-19 than that in 2017-18. 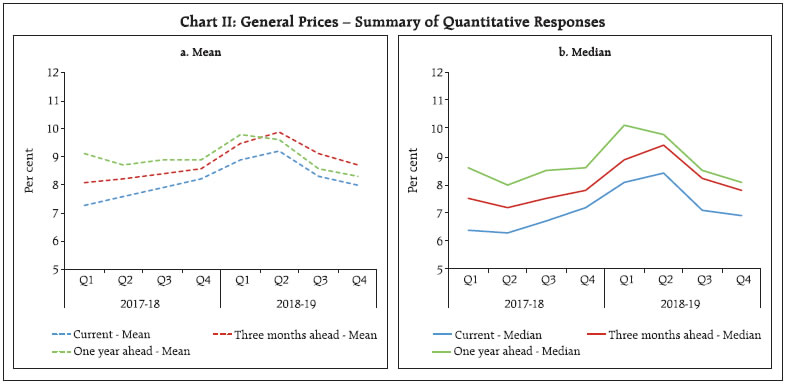   The centres classified as per the above manner are presented in Chart IIIa for the three months ahead expectations and in Chart IIIb for the one year ahead expectations. Out of the 18 survey centres, 11 centres were found to be non-optimistic for the three months ahead horizon and 13 centres for the one year ahead horizon. CPI-U inflation in most of the non-optimistic centres has increased through 2017-18 to 2018-19. Respondents in Thiruvananthapuram were the most non-optimistic for both the expectation horizons and they attributed their sentiments to the flood in the state. 2b. Occupation-wise Variation in Inflation Expectations The same classification approach was also applied to various occupational categories (plotted in Chart IVa for the three months ahead horizon and Chart IVb for the one year ahead horizon). Occupational categories that appear above the diagonal line reflect non-optimistic sentiments in 2018-19. Inflation expectations for both the expectation horizons hardened in 2018-19 in comparison to 2017-18 for all occupation categories. Financial sector employees turned out to be the most non-optimistic respondents during 2018-19. Net response for most of the occupational categories was the highest during the second and third quarters of 2017-18 as well as 2018-19 (Annex 2, Tables A and B). 3. Inflation Expectations Relative to the Inflation Target The Reserve Bank formally adopted the flexible inflation targeting (FIT) framework in June 2016 (RBI, 2016). On an average, the proportion of respondents expecting three months ahead inflation in the range of 2 per cent to 6 per cent (i.e., the band of the 4 per cent inflation target) moved up from 16 per cent in the pre–FIT5 period to 27 per cent in the post–FIT period. While there was a major increase in the share of respondents expecting inflation within the target range in Bengaluru, the minimum improvement was observed in Ahmedabad (Chart Va). In the post–FIT period, the highest share of respondents in Bengaluru reported three months ahead inflation within 2 per cent to 6 per cent. The degree of consensus among the respondents in polling inflation expectations within 2 per cent to 6 per cent range over the rounds has been analysed using coefficient of variation of the proportion of respondents expecting inflation at 2 per cent to 6 per cent over the post–FIT rounds. Smaller the size of the bubble, higher is the consensus in that centre. Among the centres showing greater convergence of expectations to the inflation target, respondents of Mumbai showed highest consensus in the post-FIT survey rounds and respondents of Bhubaneswar showed the minimum consensus. 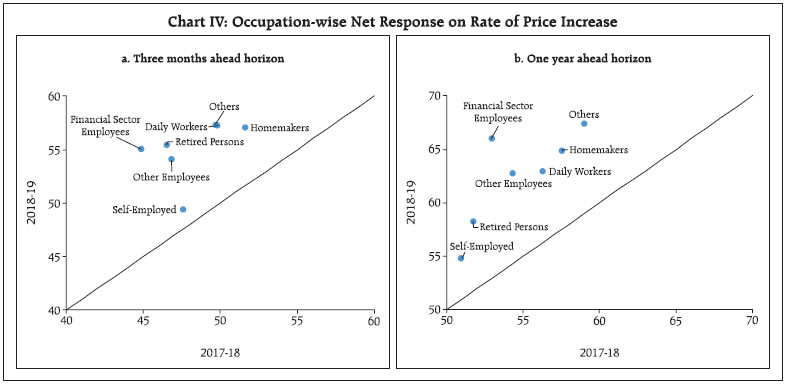 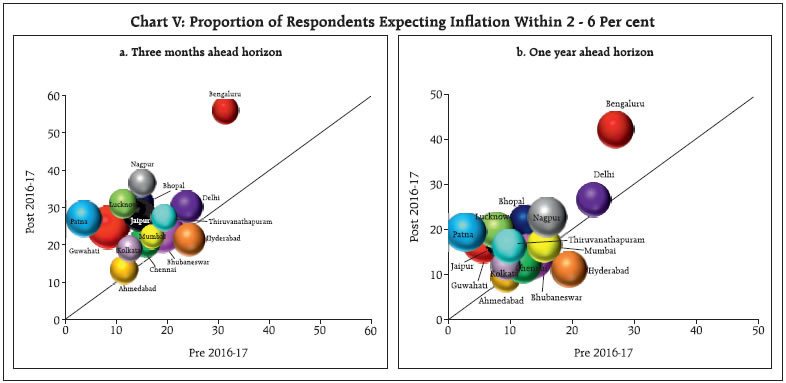 The above analysis when repeated for the one year ahead horizon showed improved alignment to the inflation target among the respondents in all centres, barring Hyderabad. Patna showed the maximum improvement from pre–FIT to post–FIT. On the other hand, Kolkata recorded the maximum consensus in polling inflation expectations in the band of 2-6 per cent while Bhubaneswar recorded the minimum convergence. (Chart Vb). 4. Nature of Forecast Errors in Households’ Inflation Expectations Ever since the inception of the survey, households’ inflation expectations are found to have an upward bias, when compared with the actual inflation, by about 300 basis points on an average for the three months ahead horizon and 400 basis points for the one year ahead horizon. Inflation expectations in India are not efficient, as the respondents do not make use of all the information contained in the past forecast errors in forming their inflation expectations (Sharma and Bicchal, 2018). It is of interest to explore, therefore, as to whether correction of inflation expectations using the past forecast errors can reduce errors in inflation forecast for the future period. To analyse this, three months ahead median inflation expectations were considered from Q2:2008-09 to Q4:2018-19 and CPI Urban6 inflation for the realised period from Q3:2008-09 till Q1:2019-20. On regressing the deviation of the inflation expectations from the actual inflation on its lags, it was found that only the first lag of the deviation contributes significantly to the current deviation. If the median inflation expectation was higher than the realised inflation by 10 percentage points in the previous quarter, then the median inflation expectation is likely to be 8 percentage points higher than the realised inflation in the current quarter (Table 1). The highly negative and significant intercept largely reflects the above mentioned bias (i.e. the realised inflation on an average remains lower than the median inflation expectations). 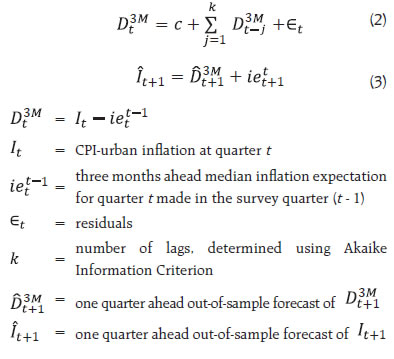 Out of sample one-quarter ahead inflation forecasts for Q2:2017-18 to Q1:2019-20 using equations (2) and (3) show that the forecasts deviated on an average by 96 basis points from the inflation numbers (Chart VIa). The CPI Urban inflation series generally remained inside the 50 per cent confidence interval and the overall trend in actual inflation was captured well in the predictions, except for a few blips. Also, the gap between the inflation forecasts and actual inflation was much less than the gap between the inflation expectations and actual inflation. Thus, in general, the inflation forecast error in the households’ inflation expectations can be reduced using the past forecast errors. | Table 1: Results of Regression of Dt3M on its Lags | | Variable | c | 1st lag | 2nd lag | 3rd lag | 4th lag | | It – iett-1 | -1.220* | 0.692* | -0.078 | 0.320 | -0.252 | * significant at 5 per cent
Adjusted R-squared = 0.600, Probability (F-statistic) = 0.000, Durbin - Watson Statistic = 2.150, residuals are white noise. | The above exercise using one year ahead inflation expectations showed that a 10 percentage points’ deviation of the inflation expectations from the realised inflation could result in the median inflation expectation to remain higher than the realised inflation by 9 percentage points in the next quarter (Annex 2, Table C). Out of sample forecasts during the study period deviated on an average by 106 basis points (Chart VIb). Also, the realised inflation remained in the 50 per cent confidence interval during the study period, barring the third quarter of 2017-18. 5. Conclusion Households’ sentiments on one quarter ahead general inflation picked up during the first half of the year 2018-19 on the back of higher petrol and diesel prices. Deflation in the vegetables led to moderation in food inflation expectations in the medium term. Compared to 2017-18, majority of the survey centres and occupation categories recorded some hardening of inflation expectations. Analysis for a longer period suggests increasing alignment of respondents’ inflation expectations towards the inflation target. Hence, sustained low inflation helps in containing inflation expectations. Households’ inflation expectations generally had an upward bias, which was higher for longer horizon. Empirical findings suggest that past forecast errors contain useful information to improve subsequent forecasting efficiency of inflation. References Axelrod, S., Lebow, D., and Peneva, E. (2018), ‘Perceptions and expectations of inflation by U.S. households’, Finance and Economics Discussion Series 2018-073, Washington: Board of Governors of the Federal Reserve System. Bullard, J. (2016), ‘Inflation expectations are important to central bankers, too’, President’s Message, Federal Reserve Bank of St. Louis. RBI (2016). Reserve Bank of India Annual Report 2015-16. Sharma, N. K., and Bicchal, M. (2018), ‘The properties of inflation expectations: Evidence for India’, EconomiA 19(1): 74–89. Shaw, P. (2019), ‘Using Rational Expectations to Predict Inflation’, Reserve Bank of India Occasional Papers 40 - No. 1: 2019.
Annex 1 Inflation Expectations Survey of Households - Sample Coverage and Survey Schedule The quarterly rounds of the survey were conducted in 18 cities covering various occupation categories of respondents, viz., financial sector employees, other employees, self-employed, homemakers, retired persons, daily workers and others. Up till the June 2018 round, a sample size of 5,500 households was targeted to be surveyed in each round, with 500 households from each of the four metropolitan cities, viz., Delhi, Kolkata, Mumbai and Chennai, and 250 households from each of the fourteen major cities, viz., Ahmedabad, Bengaluru, Bhopal, Bhubaneswar, Chandigarh, Guwahati, Hyderabad, Jaipur, Lucknow, Nagpur, Patna, Raipur, Ranchi, and Thiruvananthapuram. To improve the sampling procedure for getting population estimates, a two-stage probability sampling scheme has been implemented in place of quota sampling from the September 2018 round of the survey. The city-wise sample size has been revised in proportion to number of households of each city as per Census 2011, keeping the overall sample size 6,000. The survey schedule of IESH is organised into four blocks. Block 1 collects information on respondent’s profile like name, gender, age, category of respondent, etc. Blocks 2 and 3 capture qualitative responses on price expectations for general and various product groups, for three months and one year ahead, respectively, wherein, the respondent’s price expectations are captured using five options, viz., (i) price increase more than current rate, (ii) price increase similar to current rate, (iii) price increase less than current rate, (iv) no change in prices, and (v) decline in prices. Block 4 collects quantitative response on current and expected inflation rates for three months ahead and one year ahead periods, wherein, the inflation rate ranges from ‘less than 1 per cent’ to ‘16 per cent and above’, with intermediate class intervals of size 100 basis points. The unit-level data, the data release and the questionnaire are available in the Bank’s website.
| Table A: Net Response on Rate of Price Increase for three months ahead expectations | | Occupation Category | Q1:2017-18 | Q2:2017-18 | Q3:2017-18 | Q4:2017-18 | Q1:2018-19 | Q2:2018-19 | Q3:2018-19 | Q4:2018-19 | | Financial Sector Employees | 40.4 | 50.4 | 44.0 | 44.6 | 55.7 | 59.0 | 57.6 | 47.9 | | Other Employees | 37.9 | 52.0 | 52.0 | 45.3 | 48.9 | 56.2 | 58.9 | 52.5 | | Self-Employed | 40.6 | 53.5 | 49.3 | 46.9 | 46.1 | 45.3 | 56.6 | 49.6 | | Homemakers | 37.6 | 59.9 | 59.5 | 49.3 | 52.9 | 59.7 | 59.1 | 56.5 | | Retired Persons | 35.9 | 56.5 | 49.8 | 43.8 | 53.3 | 55.6 | 53.6 | 59.5 | | Daily Workers | 32.9 | 54.6 | 60.0 | 51.6 | 53.3 | 57.4 | 62.7 | 55.6 | | Other category | 36.1 | 56.5 | 61.0 | 45.2 | 48.0 | 63.8 | 62.6 | 55.0 |
| Table B: Net Response on Rate of Price Increase for one year ahead expectations | | Occupation Category | Q1:2017-18 | Q2:2017-18 | Q3:2017-18 | Q4:2017-18 | Q1:2018-19 | Q2:2018-19 | Q3:2018-19 | Q4:2018-19 | | Financial Sector Employees | 38.9 | 57.7 | 59.4 | 55.5 | 57.3 | 74.1 | 69.4 | 63.2 | | Other Employees | 45.5 | 55.9 | 59.0 | 56.8 | 59.1 | 64.7 | 66.7 | 60.5 | | Self-Employed | 43.4 | 53.6 | 54.3 | 52.2 | 55.6 | 52.4 | 59.4 | 51.8 | | Homemakers | 40.0 | 65.9 | 66.6 | 57.5 | 59.2 | 68.7 | 66.0 | 65.5 | | Retired Persons | 39.1 | 59.2 | 58.3 | 50.3 | 58.5 | 52.1 | 56.6 | 65.9 | | Daily Workers | 38.6 | 61.6 | 64.6 | 60.3 | 63.4 | 61.5 | 65.1 | 61.8 | | Other category | 42.5 | 66.8 | 72.0 | 54.6 | 61.0 | 70.7 | 75.5 | 62.7 |
| Table C: Results of Regression of Dt1Y on its Lags | | Variable | c | 1st lag | 2nd lag | 3rd lag | 4th lag | | It – iett-4 | -2.359* | 0.671* | -0.088 | 0.049 | -0.022 | * significant at 5 per cent
Adjusted R-squared = 0.497, Probability (F-statistic) = 0.000, Durbin-Watson Statistic = 1.947, residuals are white noise. |
|