Sales of private (non-financial) corporate business sector contracted in 2015-16 after three consecutive years of steep moderation in sales growth (Y-o-Y) both at the aggregate level and the manufacturing sector, due to lacklustre demand. However, excluding ‘Petroleum Products’ and ‘Iron & Steel’ companies, aggregate sales growth (Y-o-Y) of the remaining companies was positive, but lower, compared with 2014-15. Sales of ‘Petroleum Products’ industry contracted sharply in the last two years, triggered by a fall in global oil prices, but its operating profit and nominal Gross Value Added (GVA)1 growth (Y-o-Y) improved significantly in 2015-16 compared with the previous year. Operating profit growth of the manufacturing sector, as a whole, also improved mainly on account of fall in raw material expenses. But performance of ‘Iron & Steel’ companies in 2015-16 has emerged as a major cause for concern due to plummeting sales combined with sharp contraction in nominal GVA and operating profits compared with 2014-15. Risk profile of ‘Iron & Steel’ industry has worsened in recent years with significant rise in the borrowings of the vulnerable set of companies. The risk profile of the remaining set of vulnerable manufacturing companies improved substantially. On the positive side, in 2015-16, the ratio of cost of raw materials (CRM) to sales was the lowest in the last fifteen years. On the other hand, staff cost to sales ratio was the highest in the same period, with a sharp rise for the IT sector. Among the manufacturing industries, ‘Motor Vehicles & Other Transport Equipments’ and ‘Pharmaceuticals & Medicines’ have been performing better in the recent years. IT sector recovered in 2015-16 and non-IT services sector continued on its path of recovery in the last two years. Based on the quarterly results, a revival in the demand situation in terms of sales growth was witnessed in Q4:2015-16, after four consecutive quarters of contraction. Operating profit growth was also the highest in the last eight quarters. Improvement in the demand situation in the coming quarters would be the key for private corporate sector’s profitability as benefits from lower raw material expenses may get eroded going forward. This article analyses the performance of private (non-financial) corporate business sector during 2015-16, based on the earnings results of 2,932 listed non-government non-financial companies. Along with 2015-16 performance, a longer time-horizon is considered to analyse the trends in major performance parameters. Besides analysing the aggregate performance, the article also provides a brief analysis by size and major industry groups. The analysis is primarily based on various ratios and year on year (Y-o-Y) growth rates for the common set of companies derived from the profit & loss statements and balance sheets of companies. Select cash flow statements, as available, have also been taken into account. The detailed data corresponding to the profit & loss statements of 2015-16 for the listed non-government non-financial companies are available at the Bank’s website https://rbi.org.in/scripts/Pr_DataRelease.aspx?SectionID=360&DateFilter=Year. Explanatory notes and glossary of terms are provided as part of the aforementioned data release. 1. Aggregate sales contracted but operating profit growth improved 1.1. Performance of private corporate sector during 2015-16 was heavily impacted by the fall in global commodity prices, resulting in Y-o-Y contraction in sales by 1.6 per cent for the first time in the last fifteen years. This contraction in sales in 2015-16 was observed on the back of sharp deceleration in sales growth (Y-o-Y) in the previous three years. However, higher Y-o-Y contraction in total expenditure (4.4 per cent) as compared with the value of production (2.4 per cent), resulted in operating profit margin of 15.2 per cent in 2015-16, the highest since 2011-12 (Chart 1). Raw material and power & fuel expenses contracted sharply in 2015-16 contributing towards a fall in the total expenditure (Table 1). In contrast, staff cost growth (Y-o-Y) increased to 13.1 per cent in 2015- 16 after moderating in the previous two years. 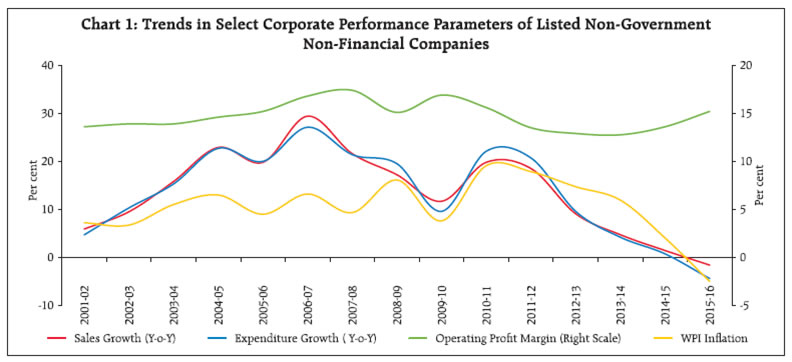
| Table 1 : Performance of Listed Non-Government Non-Financial Companies | | Period | All Companies | Excluding ‘Petroleum Products’ and ‘Iron & Steel’ | | 2014-15 | 2015-16 | 2014-15 | 2015-16 | | No. of companies | 2,925 | 2,932 | 2,751 | 2,750 | | Items | Y-o-Y Growth in Per cent | Amount
(₹ billion) | Y-o-Y Growth in Per cent | Y-o-Y Growth in Per cent | Amount
(₹ billion) | Y-o-Y Growth in Per cent | | 1 | 2 | 3 | 4 | 5 | 6 | | Sales | 1.4 | 29,898 | -1.6 | 4.8 | 25,409 | 2.9 | | Value of Production | 1.3 | 29,814 | -2.4 | 4.6 | 25,413 | 2.3 | | Gross Value Added (GVA) | 8.0 | 8,368 | 9.7 | 8.8 | 7,440 | 11.2 | | Expenditure | 0.7 | 25,269 | -4.4 | 4.3 | 21,494 | 0.5 | | Cost of Raw Materials | -3.4 | 11,726 | -12.4 | 3.9 | 9,149 | -4.6 | | Staff Cost | 10.5 | 2,905 | 13.1 | 10.2 | 2,743 | 13.5 | | Power and Fuel | 5.1 | 1,051 | -7.1 | 5.2 | 926 | -8.4 | | Operating Profits | 5.3 | 4,545 | 10.2 | 6.2 | 3,919 | 13.2 | | Other Income | 14.0 | 918 | -2.4 | 16.7 | 778 | -4.0 | | EBITDA | 6.8 | 5,463 | 7.9 | 8.0 | 4,698 | 10.0 | | Depreciation | 5.1 | 1,226 | 5.0 | 6.2 | 1,016 | 6.0 | | Gross Profits(EBIT) | 7.3 | 4,238 | 8.8 | 8.5 | 3,682 | 11.1 | | Interest | 4.4 | 1,310 | 5.0 | 4.0 | 1,065 | 2.4 | | Earnings Before Tax(EBT) | 8.8 | 2,927 | 10.5 | 10.6 | 2,617 | 15.1 | | Tax Provision | 25.3 | 779 | 2.2 | 32.9 | 709 | 6.5 | | Net Profits | -0.7 | 1,966 | 9.3 | -0.1 | 1,812 | 18.4 | | Paid-up Capital | 2.8 | 1,457 | 4.7 | 3.1 | 1,289 | 4.8 |
| Table 2 : Important Performance Parameters of Listed Non-Government Non-Financial Companies | | (Per cent) | | Period | No. of Companies | Sales Growth | GVA Growth | Expenditure Growth | Operating Profit Growth | Net Profit Growth | Operating Profit Margin | Net Profit Margin | | 1 | 2 | 3 | 4 | 5 | 6 | 7 | 8 | | 2009-10 | 2,629 | 11.7 | 19.2 | 9.6 | 26.6 | 28.8 | 16.9 | 9.4 | | 2010-11 | 2,763 | 19.8 | 13.5 | 22.1 | 12.4 | 15.8 | 15.6 | 9.0 | | 2011-12 | 2,679 | 18.5 | 9.1 | 20.7 | 1.7 | -16.8 | 13.5 | 6.4 | | 2012-13 | 2,931 | 9.1 | 8.0 | 9.6 | 3.5 | -2.0 | 12.9 | 5.9 | | 2013-14 | 2,854 | 4.7 | 6.6 | 4.2 | 2.3 | -5.1 | 12.8 | 5.8 | | 2014-15 | 2,925 | 1.4 | 8.0 | 0.7 | 5.3 | -0.7 | 13.6 | 5.9 | | 2015-16 | 2,932 | -1.6 | 9.7 | -4.4 | 10.2 | 9.3 | 15.2 | 6.6 | 1.2. Contraction in raw material expenses contributed towards the improvement in nominal GVA growth (Y-o-Y) in 2015-16. Net profit growth of private corporate sector improved after four successive years of contraction mainly on account of high operating profits and lower tax provisions (Table 1 & 2). Profitability measured by operating profit margin significantly improved in 2015-16 compared with the previous year. Net profit margin also showed signs of improvement after remaining range bound from 2012-13 to 2014-15 (Table 2). 1.3. Excluding ‘Petroleum Products’ and ‘Iron & Steel’ companies, sales growth (Y-o-Y) of the remaining companies moderated to 2.9 per cent in 2015-16 compared with 4.8 per cent observed in the previous year (Table 1). Performance of the ‘Petroleum Products’ and ‘Iron & Steel’ industries are covered in details in section 4. 2. Contraction in sales across size classes 2.1. The listed companies are classified into three size groups according to their sales in the respective year. Companies having sales more than ₹10 billion, between ₹1 billion to ₹10 billion and less than ₹1 billion are classified as large, medium and small, respectively. 2.2. For the large companies, sales contracted for the first time in seven years. However, their operating profit growth improved significantly as compared with the previous year and was at the highest level since 2010-11. Higher operating profit growth was mainly due to fall in commodity prices. Net profit growth also improved for the large companies for three successive years. Operating profit margin stood at the six-year high level of 16.4 per cent while net profit margin stood at the five-year high level of 8.2 per cent (Table 3). 2.3. Sales contracted and operating profit improved for the medium-sized companies also, but their net profits contracted. Operating profit margins showed some improvement for the medium sized companies (Table 3). 2.4. Small companies, as a whole, indicated no signs of improvement. It may, however, be noted that the method of classification (referred in section 2.1) creates a downward bias in the sales growth of small-sized companies, as companies migrate to a lower size class when sales decline and companies migrate to a higher size class when sales increase. For example, sixty-eight companies, classified as small in 2015-16, were classified as medium in 2014-15. Another forty-nine companies, classified as small in 2014-15, were classified as medium in 2015-16. However, even after excluding such migrating companies, performance in terms of sales growth and net profit margin of small companies worsened in 2015-16 as compared with 2014-15. | Table 3 : Size Class wise Performance Parameters of Listed Non-Government Non-Financial Companies | | (Per cent) | | Period | Large | Medium | Small | | Sales Growth | Ope rating Profit Growth | Net Profit Growth | Ope rating Profit Margin | Net Profit Margin | Sales Growth | Ope rating Profit Growth | Net Profit Growth | Ope rating Profit Margin | Net Profit Margin | Sales Growth | Ope rating Profit Growth | Net Profit Growth | Ope rating Profit Margin | Net Profit Margin | | 1 | 2 | 3 | 4 | 5 | 6 | 7 | 8 | 9 | 10 | 11 | 12 | 13 | 14 | 15 | | 2009-10 | 13.0 | 27.1 | 26.4 | 17.6 | 10.2 | 9.6 | 25.0 | 45.7 | 14.7 | 6.5 | -8.8 | 12.4 | 42.7 | 9.2 | 3.5 | | 2010-11 | 20.6 | 13.3 | 18.1 | 16.2 | 9.8 | 19.1 | 7.5 | 4.1 | 13.2 | 5.6 | -4.4 | 2.2 | -70.4 | 8.7 | 1.1 | | 2011-12 | 20.8 | 3.7 | -15.0 | 14.0 | 7.0 | 9.5 | -9.5 | -34.6 | 11.1 | 3.4 | -9.2 | -23.6 | 125.7 | 6.3 | 1.2 | | 2012-13 | 10.7 | 4.0 | 3.2 | 13.3 | 6.8 | 1.5 | 0.7 | -62.1 | 10.5 | 1.3 | -9.3 | -14.4 | $ | 5.4 | -4.7 | | 2013-14 | 6.0 | 5.2 | 0.2 | 13.4 | 6.8 | 1.0 | -15.1 | -77.3 | 9.6 | 0.6 | -26.3 | -58.2 | $ | 3.2 | -11.9 | | 2014-15 | 2.3 | 6.3 | 3.0 | 14.5 | 7.1 | -2.8 | 0.3 | @ | 8.6 | -0.8 | -15.6 | @ | $ | -1.7 | -17.6 | | 2015-16 | -1.2 | 10.6 | 7.8 | 16.4 | 8.2 | -1.8 | 12.6 | $ | 9.4 | -0.5 | -19.6 | $ | $ | -7.1 | -33.6 | @: Denominator negligible
$: Denominator negative | 3. Sectoral View - Risk profile of vulnerable manufacturing companies worsened 3.1. Sales of the manufacturing sector contracted in 2015-16, but it recorded the highest growth in operating profit and nominal GVA in the current year compared with the recent past. Net profit growth of the manufacturing sector improved considerably in 2015- 16 on the back of two consecutive contractions. Profit margins also improved in 2015-16 compared with the previous year. IT sector recovered by recording improvements in sales, nominal GVA and operating profit growth after moderation in 2014-15. However, its performance is yet to match the levels observed during 2010-11 to 2013-14. Sales growth of the non-IT services sector continued in its path of recovery after significant moderation in 2013-14. Noticeable improvement was observed in the profit margins of this sector (Table 4). | Table 4 : Sector wise Performance Parameters of Listed Non-Government Non-Financial Companies | | (Per cent) | | | Manufacturing | Services (Non-IT) | IT | | Period | Sales Gro wth | GVA Gro wth | Ope rating Profit Gro wth | Net Profit Gro wth | Ope rating Profit Mar gin | Net Profit Mar gin | Sales Gro wth | GVA Gro wth | Ope rating Profit Gro wth | Net Profit Gro wth | Ope rating Profit Mar gin | Net Profit Mar gin | Sales Gro wth | GVA Gro wth | Ope rating Profit Gro wth | Net Profit Gro wth | Ope rating Profit Mar gin | Net Profit Mar gin | | 1 | 2 | 3 | 4 | 5 | 6 | 7 | 8 | 9 | 10 | 11 | 12 | 13 | 14 | 15 | 16 | 17 | 18 | | 2009-10 | 12.9 | 30.0 | 33.1 | 44.2 | 15.8 | 8.5 | 3.6 | -8.3 | -1.8 | -42.5 | 13.7 | 4.7 | 5.6 | 13.2 | 18.9 | 18.0 | 27.5 | 21.4 | | 2010-11 | 22.4 | 17.5 | 11.7 | 20.0 | 14.3 | 8.2 | 8.5 | 21.9 | 17.6 | 25.3 | 14.3 | 5.4 | 16.9 | 23.1 | 13.5 | 14.4 | 25.8 | 19.8 | | 2011-12 | 18.7 | 10.8 | -0.1 | -22.1 | 11.9 | 5.4 | 15.3 | 5.2 | -3.9 | -48.0 | 12.4 | 2.1 | 21.8 | 29.1 | 16.1 | 23.0 | 24.7 | 20.1 | | 2012-13 | 8.8 | 7.4 | 2.7 | 2.2 | 11.3 | 5.3 | 11.5 | 7.7 | 11.0 | -36.1 | 12.8 | 1.4 | 14.0 | 20.5 | 18.3 | 8.9 | 25.4 | 19.3 | | 2013-14 | 4.2 | 4.2 | 0.0 | -7.1 | 10.9 | 4.9 | 2.6 | -4.1 | -15.4 | -71.7 | 11.6 | 1.2 | 20.4 | 25.8 | 29.1 | 25.7 | 28.2 | 21.1 | | 2014-15 | 0.4 | 5.2 | 3.3 | -7.8 | 11.5 | 4.5 | 3.7 | 22.4 | 38.1 | $ | 13.6 | 2.7 | 10.7 | 14.8 | 6.6 | 8.1 | 26.8 | 21.3 | | 2015-16 | -3.7 | 7.8 | 9.6 | 12.6 | 13.0 | 5.3 | 4.9 | 17.3 | 21.9 | -16.9 | 21.0 | 5.0 | 11.3 | 19.5 | 11.9 | 14.5 | 26.6 | 22.5 | 3.2. An analysis of major components of expenditure of the private corporate sector revealed that at the aggregate level, cost of raw materials (CRM) to sales, which was on a declining trend since 2012-13, further moderated in 2015-16. On the other hand, staff cost to sales ratio continued to increase for four consecutive years (Chart 2). In 2015-16, the ratios of CRM to sales and staff cost to sales reached their minimum and maximum levels respectively in the last fifteen years. CRM to sales ratio for the manufacturing sector continued its declining trend since 2011-12 with significant drop in 2015-16, while staff costs to sales ratio increased for the fourth consecutive year. Non-IT services sector witnessed a decrease in both CRM and staff cost to sales ratios in 2015-16 compared with the previous year. IT sector witnessed a noticeable jump in staff cost to sales ratio in 2015-16 (Chart 2). 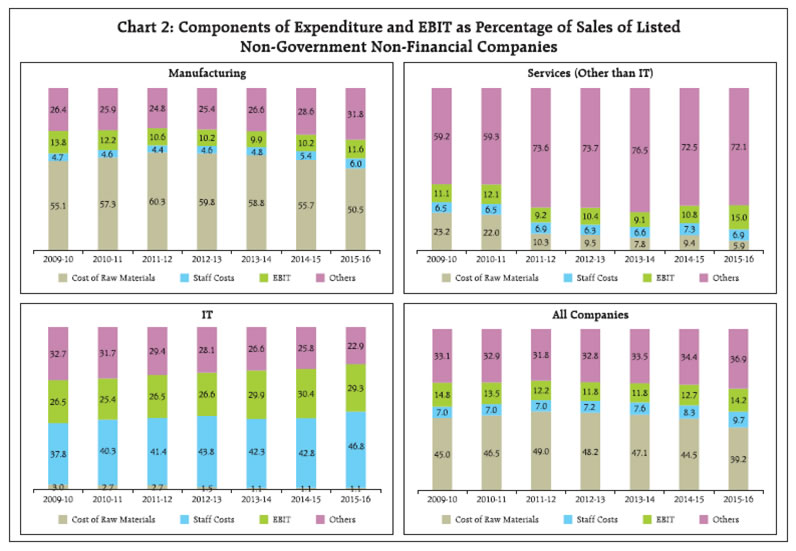 3.3. The annual financial statements of 1,707 common manufacturing companies over the last five years were analysed to study the trends in debt held by the vulnerable set of companies, i.e., those companies having debt-equity ratio greater than 200 per cent and interest coverage ratio less than one. Companies having negative net worth were also considered as vulnerable. The number of vulnerable manufacturing companies continuously increased between 2012-13 to 2015-16. The debt held by these companies (‘debt at risk’) exhibited an increasing trend over the last five years with significant jump in 2014-15. The share of ‘debt at risk’ in the total debt of 1,707 companies grew and stood at around 30 per cent in the last two years, which indicated a deterioration in the risk profile of the manufacturing sector in the recent years. The risk profile of the ‘Iron & Steel’ companies was more alarming with its share of ‘debt at risk’ in the total debt of 142 companies at around 58.7 per cent in 2015- 16. Excluding the ‘Iron & Steel’ companies, there was an improvement in the risk profile of the remaining companies with the share of ‘debt at risk’ in the total debt of 1,565 companies at 18.8 per cent in 2015-16 (Table 5). | Table 5 : Debt at Risk –Listed Manufacturing Companies | | Sector | Manufacturing | ‘Iron & Steel’ | Excluding ‘Iron & Steel’ | | No. of Companies | 1,707 | 142 | 1,565 | | No of vulnerable companies | Debt at risk
(₹ Billion) | Total Debt
(₹ Billion) | Share of debt at risk (per cent) | No of vulnerable companies | Debt at risk
(₹ Billion) | Total Debt
(₹ Billion) | Share of debt at risk (per cent) | No of vulnerable companies | Debt at risk
(₹ Billion) | Total Debt
(₹ Billion) | Share of debt at risk
(per cent) | | Period | 1 | 2 | 3 | 4 | 5 | 6 | 7 | 8 | 9 | 10 | 11 | 12 | | 2011-12 | 224 | 588 | 4,959 | 11.9 | 19 | 202 | 1,222 | 16.5 | 205 | 386 | 3,737 | 10.3 | | 2012-13 | 215 | 681 | 5,604 | 12.1 | 23 | 234 | 1,511 | 15.5 | 192 | 447 | 4,093 | 10.9 | | 2013-14 | 249 | 1,081 | 6,428 | 16.8 | 26 | 354 | 1,773 | 19.9 | 223 | 728 | 4,655 | 15.6 | | 2014-15 | 279 | 2,033 | 6,792 | 29.9 | 37 | 999 | 1,929 | 51.8 | 242 | 1,034 | 4,863 | 21.3 | | 2015-16 | 283 | 2,104 | 6,914 | 30.4 | 43 | 1,182 | 2,014 | 58.7 | 240 | 923 | 4,899 | 18.8 | 3.4. The sources of funds raised by these companies (mentioned in section 3.3) revealed that the share of external sources (i.e., other than share capital and accumulated surplus) increased in 2015-16 compared with the previous year, while in terms of absolute amount, both the sources declined in the last two years. Long-term borrowings, which was a major source of fund until 2014-15, turned negative indicating the deleveraging process undertaken by the manufacturing sector in 2015-16. Similarly, the fund available through trade credit also declined in the last two years (Table 6A). The uses of funds table revealed that while gross fixed assets formation did not improve much in 2015-16, more money was invested in non-current assets. Drawdown of inventory position was another salient feature of the uses of funds by the manufacturing companies (Table 6B). | Table 6A : Sources of Funds – Listed Manufacturing Companies | | (₹ Billion) | | Sources of Funds | 2012-13 | 2013-14 | 2014-15 | 2015-16 | | Items | 1 | 2 | 3 | 4 | | INTERNAL SOURCES | 831 | 707 | 840 | 703 | | A. Share Capital | 30 | 20 | 42 | 36 | | B. Reserves and Surplus | 801 | 686 | 798 | 667 | | EXTERNAL SOURCES | 1,115 | 1,170 | 718 | 793 | | C. Money received against share warrants | 1 | -7 | 1 | -1 | | D. Share application money pending allotment | 2 | -6 | 15 | -21 | | E. Non-current liabilities | 430 | 569 | 491 | -37 | | 1. Long-term borrowings | 368 | 547 | 421 | -62 | | 2. Deferred tax liabilities (Net) | 44 | -15 | 48 | -1 | | 3. Other long-term liabilities | 6 | 4 | -32 | 15 | | 4. Long Term provisions | 13 | 33 | 54 | 10 | | F. Current liabilities | 690 | 615 | 198 | 862 | | 5. Short-term borrowings | 278 | 277 | -57 | 183 | | 6. Trade payables | 245 | 222 | 60 | 60 | | 7. Other current liabilities | 141 | 103 | 150 | 679 | | 8. Short term provisions | 27 | 13 | 46 | -61 | | G. Other equity and liabilities | -8 | 0 | 12 | -11 | | 9. TOTAL | 1,946 | 1,877 | 1,558 | 1,496 |
| Table 6B : Uses of Funds – Listed Manufacturing Companies | | (₹ Billion) | | USES OF FUNDS | 2012-13 | 2013-14 | 2014-15 | 2015-16 | | Items | 1 | 2 | 3 | 4 | | H. Non-Current assets | 1,097 | 1,645 | 1,192 | 1,631 | | 10. Gross Fixed Assets | 818 | 945 | 827 | 832 | | 11. Noncurrent investments | 120 | 534 | 373 | 809 | | 12. Long-term loans and advances | 139 | 107 | -13 | -36 | | 13. Deferred tax assets (Net) | -3 | 14 | 7 | 17 | | 14. Other non-current assets | 23 | 45 | -1 | 8 | | I. Current assets | 849 | 231 | 360 | -130 | | 15. Current investments | 157 | 211 | 192 | -19 | | 16. Inventories | 311 | 112 | 110 | -175 | | 17. Trade receivables | 201 | 115 | 43 | 154 | | 18. Cash and cash equivalents | 44 | -292 | -101 | -19 | | 19. Short term loans and advances | 104 | 5 | 115 | -64 | | 20. other current assets | 32 | 79 | 0 | -7 | | J. Other assets | 0 | 0 | 7 | -4 | | 21. TOTAL | 1,946 | 1,877 | 1,558 | 1,496 |
4. Higher profitability in most of the industries 4.1. The sales growth of most of the industries were lower than their long-term (seven-year) averages, but a few major industries showed signs of recovery. Operating profit margins of most of the major industries were above their long-term averages. 4.2. Among the major industries in the basic goods sector, sales growth declined for the ‘Cement & Cement Products’ industry. The significant recovery that was observed in 2014-15 could not be sustained in 2015-16. Operating profit margins remained at similar levels in the last two years and was significantly below the levels observed in 2009-10 (Chart 3). ‘Iron & Steel’ industry was heavily impacted by contraction in output prices and its sales declined by 10.2 per cent. The operating profit margin also declined to a seven-year low level of 11.0 per cent (Chart 4). Interest coverage ratio of this industry declined below one, while its ‘debt at risk’ increased by 18.3 per cent in 2015-16 compared with the previous year (Table 5). For both ‘Cement & Cement Products’ and ‘Iron & Steel’ industries, net cash outflows2 for investing activities declined in 2015-16. 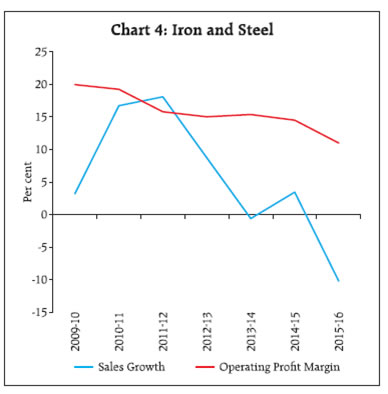 4.3. In the consumer goods sector, the ‘Motor Vehicles & Other Transport Equipments’ and the ‘Pharmaceuticals & Medicines’ industries recorded impressive sales growth. Operating profit margin for the ‘Motor Vehicles & Other Transport Equipments’ industry stood at a six-year high in 2015-16 (Chart 5). The companies in this industry, also made a decent increase in net cash flow from operating activities in 2015-16 over 2014-15. Operating profit margin for the ‘Pharmaceuticals & Medicines’ industry increased to a seven-year high level of 22.0 per cent in 2015-16 (Chart 6).
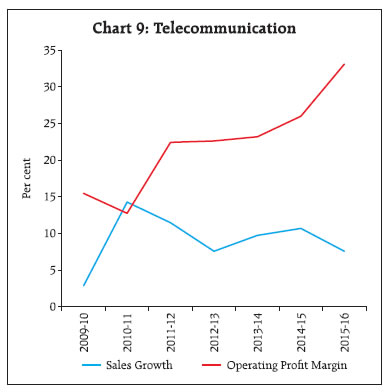
4.4. In the capital goods sector, sales growth of the ‘Machinery’ industry showed some recovery in 2015- 16, recording the highest level in four years. Operating profit margin also improved for the industry (Chart 7). 4.5. ‘Construction’ industry showed positive sales growth after successive contraction in the last two years. However, operating profit margin declined for the industry (Chart 8). The industry also showed 11.0 per cent increase in total borrowings and their vulnerability in terms of interest coverage ratio and share of ‘debt at risk’ in total debt of 151 companies increased in 2015-16. 4.6. For the ‘Telecommunication’ industry, although sales growth declined, operating profit margin increased significantly to 33.1 per cent, which was the highest among major industries in 2015-16 (Chart 9). Twelve companies in this industry whose balance sheets were available for the last five years showed an increase of 60.0 per cent in the total borrowings in 2015-16. This led to 37.0 per cent increase in interest expenses. The cash flow statements, as available, also showed a net inflow of cash from financing activities. However, due to increase in profitability, the interest coverage ratio increased only marginally. Among other industries in the non-IT services sector, the ‘Transport and Storage’ industry after three successive years of sales stagnation, showed significant improvements in terms of sales growth and profitability (Chart 10). 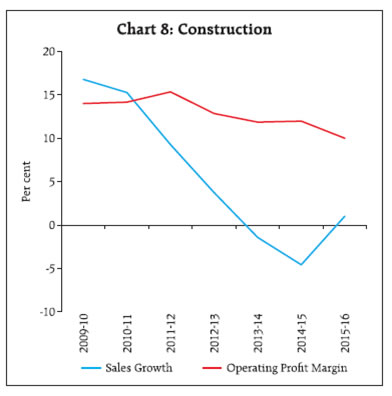
 4.7. Fall in global crude oil prices had a pronounced effect on the performance of the ‘Petroleum Products’ industry in 2015-16. ‘Petroleum Products’ industry suffered from a sharp contraction in sales but enjoyed the benefits of higher contraction in expenditure thus recording exceptionally high operating profit margin (Chart 11). Further, benefits of fall in global crude oil prices were not transmitted to the domestic consumers completely, which resulted in higher profitability.
5. Improvement in sales growth in Q4:2015-16 after successive contractions 5.1. Analysis of quarterly earnings statements of a common set of 2,139 listed non-government non-financial companies showed a turnaround in the demand situation, as they recorded positive sales growth in Q4:2015-16 after four successive quarters of contraction. With expenditure continuing to contract, though at a much lower rate, these companies recorded a robust operating profit growth of 18.4 per cent in Q4:2015-16, which was the highest in the last eight quarters. Nominal GVA growth also increased continuously over the last six quarters (Table 7). 5.2. Interest expenses of the manufacturing sector contracted for the second successive quarter in Q4:2015-16, while it increased markedly for the non-IT service sector. This was mainly on account of large borrowings undertaken by the ‘Telecommunication’ industry. IT sector witnessed noticeable improvement recording the highest growth in sales, operating profits and net profit in Q4:2015-16 over the last six quarters (details are available in the quarterly data releases in the Bank’s website). | Table 7 : Performance over the Quarters - 2014-15 and 2015-16 of Listed Non-Government Non-Financial Companies | | (Per cent) | | Item | Q1FY15 | Q2FY15 | Q3FY15 | Q4FY15 | Q1FY16 | Q2FY16 | Q3FY16 | Q4FY16 | | 1 | 2 | 3 | 4 | 5 | 6 | 7 | 8 | | No. of companies | 2,139 | | Y-o-Y Growth | | Sales | 8.5 | 5.3 | 0.5 | -3.5 | -1.7 | -3.9 | -2.3 | 3.3 | | Value of Production | 8.9 | 5.8 | 1.1 | -4.0 | -1.9 | -4.9 | -3.0 | 2.0 | | Gross Value Added (GVA) | 11.3 | 11.3 | 2.7 | 6.2 | 6.8 | 7.3 | 9.2 | 10.4 | | Expenditure, of which | 7.9 | 5.1 | 1.3 | -4.7 | -3.1 | -7.2 | -5.3 | -0.7 | | Operating Profits | 15.6 | 9.7 | -0.2 | 0.3 | 4.8 | 8.8 | 11.2 | 18.4 | | Other Income | -2.7 | 28.4 | -4.1 | 6.2 | 4.9 | -3.5 | -3.1 | -9.9 | | EBITDA | 12.4 | 13.0 | -0.8 | 1.3 | 4.8 | 6.5 | 8.9 | 13.1 | | Depreciation | 8.3 | 5.1 | 7.4 | 4.1 | 5.0 | 4.8 | 7.1 | 11.9 | | Gross Profits (EBIT) | 13.5 | 15.3 | -3.1 | 0.6 | 4.8 | 6.9 | 9.5 | 13.4 | | Interest | 2.5 | 5.5 | 9.7 | 9.7 | 13.0 | 9.1 | 2.7 | 6.4 | | Net Profits | 21.0 | 27.2 | -23.6 | -20.5 | -2.6 | 6.5 | 12.7 | 11.1 | | Ratio | | Cost of Raw Materials to Sales | 54.3 | 55.2 | 52.4 | 50.6 | 49.8 | 49.4 | 48.4 | 47.4 | | Staff Cost to Sales | 8.4 | 8.5 | 8.8 | 9.3 | 9.5 | 9.7 | 9.9 | 9.6 | | Interest Burden | 25.6 | 26.3 | 30.3 | 27.9 | 27.5 | 27.0 | 28.9 | 26.8 | | Tax Provisions to EBT | 24.9 | 23.0 | 23.6 | 23.4 | 25.4 | 24.4 | 25.2 | 22.8 | | Other Income to Net Profit | 35.0 | 45.3 | 46.7 | 49.6 | 37.4 | 40.3 | 40.9 | 40.3 | | Interest to Sales | 3.5 | 3.6 | 3.8 | 3.8 | 4.0 | 4.1 | 4.0 | 3.9 | | Interest Coverage(times) | 3.9 | 3.8 | 3.3 | 3.6 | 3.6 | 3.7 | 3.5 | 3.7 | | Operating Profit to Sales | 14.7 | 14.0 | 13.7 | 14.3 | 15.8 | 15.9 | 15.6 | 16.0 | | EBITDA to Sales | 17.3 | 17.5 | 16.3 | 17.5 | 18.6 | 19.3 | 18.2 | 18.8 | | EBIT to Sales | 13.6 | 13.8 | 12.5 | 13.6 | 14.7 | 15.3 | 14.0 | 14.6 | | Net Profit to Sales | 7.5 | 7.6 | 5.6 | 6.4 | 7.5 | 8.4 | 6.2 | 7.0 | 5.3. Results available so far for Q1:2016-17 (April-June 2016), indicated a slight moderation in sales growth, compared with Q4:2015-16 at the aggregate level and for the manufacturing sector. There has been a considerable improvement in the profitability ratios at the aggregate level in Q1:2016-17 compared with the previous quarter. Improvement in demand situation in the coming quarters would be the key for private corporate sector’s profitability as benefits from lower raw material expenses may get eroded going forward.
|