An analysis of the results of the select 237,398 Nongovernment Non-financial (NGNF) private limited companies showed that sales growth and operating expenses accelerated for the year 2014-15 as compared to the previous year. The growth in operating profit and net profit moderated in 2014-15. Despite the moderation in these parameters, the profitability ratios such as operating profit margin and return on equity improved in 2014-15. The growth in total net assets increased whereas that of total borrowings declined in 2014-15 vis-à-vis the previous year. The select NGNF private companies relied mainly on external sources of funds for their business expansion; however, its share in total sources of funds had declined in 2014-15. Funds were predominantly used for gross fixed assets formation. This article presents an analysis of the financial performance of NGNF private limited companies based on their audited annual accounts of select 237,398 companies, which closed their account on March 31, 2015. As per the provisional estimates of Ministry of Corporate Affairs (MCA) the select 237,398 private limited companies accounted for 23.3 per cent of population paid up capital (PUC) of all NGNF private limited companies as on March 31, 2015. Data received from MCA systems are used in this article. The industry classification for these select companies is based on the National Industrial Classification (NIC) 2004 code. The performance of these companies for three year period, i.e., from 2012-13 to 2014-15 has been assessed in this article. Reference may also be made to the detailed data for 2014-15 along with explanatory notes already released vide press release on the website of the Reserve Bank in March, 2016. | Table1: Growth Rate of Gross Value Added | | (Per cent) | | Year | 2013-14 | 2014-15 | | Aggregate (All Companies) | 20.1 | 16.9 | | Small companies (sales less than ₹ 250 million) | 33.3 | 8.0 | | Medium companies(sales ₹250million to ₹1 billion) | 26.0 | 22.6 | | Large Companies (sales ₹1 billion and above) | 12.1 | 18.8 | | Manufacturing sector | 17.3 | 16.2 | | Service sector | 18.6 | 17.4 | 1. Growth Rate: Gross Value Added declined 1.1 Gross value added (GVA) of select NGNF private companies grew at a slower pace of 16.9 per cent in 2014-15 as against 20.1 per cent in 2013-14, mainly on account of small companies where GVA growth declined to 8.0 per cent in 2014-15 as against 33.3 per cent in 2013-14 (Table1). 1.2 Sales growth of these companies accelerated to 12.0 per cent in 2014-15 as compared to 8.7 per cent recorded in 2013-14. As a result, the growth in value of production also accelerated in 2014-15. Operating expenses also recorded a higher growth of 11.1 per cent in 2014-15 from 8.8 percent in 2013-14 (Chart 1). 1.3 Operating profit and Net profit decelerated to 16.6 per cent and 12.3 per cent in 2014-15 respectively from 23.0 per cent and 23.6 per cent in previous year. Growth in total borrowings of these companies declined to 11.6 per cent in 2014-15 from 19.3 per cent in 2013-14 (Statement 1). 1.4 Increase in sales growth during 2014-15 was witnessed among all the sales classes namely, large, medium and small companies. While growth in operating profit of large companies increased significantly to 18.0 per cent from 4.2 per cent, for small and medium companies the growth declined to 6.3 per cent and 24.9 per cent in 2014-15, respectively as compared to 43.8 per cent and 30.1 per cent in previous year. The net worth of large companies recorded a higher growth rate but for small and medium companies’ growth rate in net worth was lower (Statement 1). 1.5 Among the industry groups, except ‘Food products and beverages’, ‘Textiles’ and ‘Chemicals and chemical products’, all other industries witnessed increase in sales growth. Real estate sector recorded highest sales growth of 23.6 per cent in 2014-15. The operating profit growth of Service Sector decelerated to 15.3 per cent in 2014-15 from 21.0 per cent in 2013-14 which was mainly contributed by ‘Wholesale and retail trade’ and ‘Real estate’ industries whereas Manufacturing Sector witnessed marginal increase in operating profit (Statement 1). 2. Profitability ratios: increased gradually 2.1 Though the operating profit moderated in 2014-15, the profitability ratios such as profit margin and return on equity showed improvement in 2014-15. profit margin (measured as a ratio of operating profit to sales) increased steadily from 8.7 per cent in 2013-14 to 9.1 per cent in 2014-15. Return on equity (measured as a ratio of profit after tax to net worth) also witnessed increasing trend over the three year period. Following the trend at aggregate level, the profit margin for small, medium and large sales size companies increased in 2014-15 as compared to 2013-14 (Statement 2). 2.2 Profit margin increased for Manufacturing Sector and decreased marginally for Services Sector in 2014-15. All industries in Manufacturing Sector witnessed increase in profit margin in 2014-15. While in Services Sector profit margin improved for all the industry group in 2014-15, except for ‘Wholesale and retail trade’ and ‘Computer and related activities’ (Statement 2). 3. Leverages increased and Interest Coverage ratio remained at same level 3.1 Total borrowings of the NGNF private limited companies grew at a lower rate of 11.6 per cent in 2014-15 as compared to 19.3 per cent in 2013-14. The leverage ratio (measured as a ratio of total borrowings to equity) increased to 80.3 per cent in 2014-15 from 77.7 per cent in 2013-14. Similarly, debt to equity ratio also witnessed increasing trend over the three year study period. Both, debt to equity and total borrowings to equity ratios increased for small sales size companies, whereas for large sales size companies these ratios have declined in 2014-15. Among sectors, Construction Sector was the most leveraged as compared to remaining sectors (Statement 1 & 2). 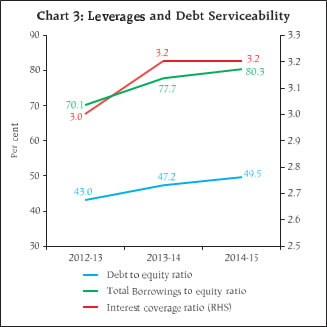
| Table 2: Leverage Ratio and their Share in Borrowings | | (Per cent) | Leverage Class
(Per cent)* | Share in number of companies | Share in bank borrowings | Share in total borrowings | | 2012-13 | 2013-14 | 2014-15 | 2012-13 | 2013-14 | 2014-15 | 2012-13 | 2013-14 | 2014-15 | | 0- 100 | 75.5 | 74.7 | 74.6 | 38.0 | 31.9 | 32.7 | 40.7 | 40.8 | 38.6 | | 100 – 200 | 5.0 | 4.9 | 4.7 | 13.3 | 13.2 | 10.6 | 11.9 | 10.8 | 10.2 | | 200 – 300 | 2.5 | 2.5 | 2.4 | 7.4 | 7.6 | 9.7 | 6.9 | 6.4 | 7.7 | | 300 – 400 | 1.5 | 1.5 | 1.4 | 5.3 | 5.9 | 4.5 | 4.0 | 4.2 | 4.9 | | Above 400 | 8.9 | 8.8 | 8.3 | 21.8 | 26.3 | 26.6 | 21.5 | 22.8 | 22.8 | | Net worth <0 | 6.7 | 7.7 | 8.6 | 14.2 | 15.2 | 15.9 | 15.0 | 15.1 | 15.9 | | Total | 100 | 100 | 100 | 100 (2259) | 100 (2308) | 100 (2613) | 100 (4684) | 100 (5591) | 100 (6242) | | *Based on long term borrowings to net worth ratio. Amounts in parenthesis are in ₹ billions. | 3.2 The interest coverage ratio (ICR), calculated as ratio of earnings before interest and tax (EBIT) to interest expenses, at the aggregate level remained almost at the same level of 3.2 in 2014-15 as was in the previous year. Among the sales size classes, ICR improved marginally to 2.9 in 2014-15 from 2.8 in previous year for large sales size companies. In Manufacturing Sector, debt serviceability (ICR) in 2014-15 improved among all the industry groups, barring ‘Textiles’ companies. Debt serviceability for Services Sector had declined marginally in 2014-15 as compared to the previous year, mainly due to ‘Real estate’ companies (Statement 2). 3.3 Highly leveraged companies i.e., companies having debt to equity more than 400 per cent or negative net worth accounted for 16.9 per cent companies and they had 42.5 per cent share in bank borrowings in 2014-15. These companies also accounted for 38.7 per cent share in total borrowings in 2014-15 (Table 2). 3.4 Among the select NGNF private limited companies, more than one tenth of the total number of companies had their debt to equity ratio >=200 and ICR<11. These companies constituted 36.1 per cent share in total bank borrowings by NGNF private limited companies in 2014-15 and witnessed increasing trend over the three years period (Chart 4). 4. Capital Structure: Share of Net worth declined 4.1 The proportion of shareholders’ funds constituted 40.7 per cent in total liabilities, though it had declined marginally in 2014-15 from 41.9 per cent in the previous year. Share of long term borrowings in total liabilities increased marginally, whereas share of short term borrowings declined in 2014-15 as compared to the previous year (Statement 3A and Chart 5). 5. Asset pattern: Net assets expanded in 2014-15 5.1 Total net assets of select NGNF private limited companies expanded by 11.6 percent in 2014-15 as against 10.6 per cent in the previous year, mainly contributed by large companies. Total net assets of large companies expanded significantly to 19.9 per cent in 2014-15 as compared against 11.7 per cent in previous year. The growth of total net assets of Services Sector had improved to 11.6 per cent in 2014-15 from 9.1 per cent in 2013-14 and was mainly driven by the companies in ‘Wholesale and retail trade’ and ‘Computer and related activities’. For Manufacturing Sector the growth in total net assets moderated in 2014-15 as compared to the previous year (Statement 1). 5.2 The share of net fixed assets in total assets increased to 26.4 per cent in 2014-15 as against 24.7 per cent in 2013-14. Share of Non-current investments in total assets declined marginally to 14.8 per cent in 2014-15 as compared to 15.5 per cent in 2013-14. Share of Loans and advances in total assets exhibited declining trend over the three year study period (Statement 3B). 6. Sources of funds: share of external sources declined 6.1 The external sources (i.e., other than companies’ own funds) continued to play a major role in expanding the business of NGNF private limited companies. However, their share declined to 70.5 per cent in 2014-15 as against 73.0 per cent in 2013-14 mainly due to decline in the share of short term and long term borrowings as well as the share capital & premium in total sources of funds (Statement 4A). 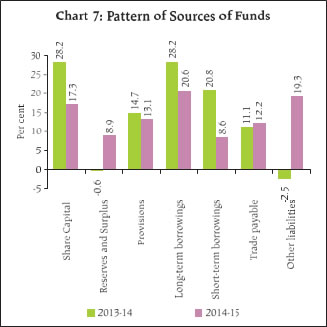 6.2 The share of funds raised through long term borrowings and short term borrowings in total sources of funds declined to 20.6 per cent and 8.6 per cent respectively in 2014-15 from 28.2 per cent and 20.8 per cent in 2013-14. The share of funds mobilised through long term borrowings from banks in total sources of funds declined to 8.5 per cent in 2014-15 from 11.1 per cent in the previous year. However, the share of short term borrowings from banks in total sources of funds increased in 2014-15. Further, increase in the share of funds raised through other liabilities was mainly contributed by few companies in Construction and Services Sector, as their other liabilities in 2014-15 witnessed a sharp increase (Statement 4A). 7. Uses of funds: Share of gross fixed asset formation increased 7.1 The fund mobilised by select NGNF private limited companies were predominantly used for gross fixed asset (GFA) formation. The share of GFA in total uses of funds increased to 48.0 per cent in 2014-15 from 32.7 per cent in 2013-14. The share of Inventories formation in total uses of funds declined to 13.9 per cent in 2014- 15 from 18.7 per cent in 2013-14. Further, proportion of cash and cash equivalents in total uses of funds increased to 7.7 per cent in 2014-15 as against 3.2 per cent in previous year (Statement 4B). 8. Conclusion: Sales growth of NGNF private limited companies accelerated during the year 2014-15 as compared to the previous year. However, growth in operating profit and net profit moderated in 2014-15. Despite the moderation in growth rate of operating profits, the profitability ratios such as operating profit margin and return of equity improved in 2014-15. The NGNF private limited companies relied mainly on external sources of funds for their business expansion, however, its share in total sources of funds had declined in 2014-15. The mobilised funds were predominantly used for gross fixed assets formation. The share of bank borrowings of highly leveraged companies had increased in 2014-15. | Statement 1: Growth Rates of Select Parameters of Private Limited Companies (Contd.) | | (Per cent) | | | Growth Rates | | Sales | Operating Expenses | Operating Profit | Net Profit | | 2013-14 | 2014-15 | 2013-14 | 2014-15 | 2013-14 | 2014-15 | 2013-14 | 2014-15 | | Number of sample cos | 237,398 | 237,398 | 237,398 | 237,398 | 237,398 | 237,398 | 237,398 | 237,398 | | Aggregate (All Companies) | 8.7 | 12.0 | 8.8 | 11.1 | 23.0 | 16.6 | 23.6 | 12.3 | | Sales-wise | | | | | | | | | | Less than ₹ 250 million | -0.1 | 4.6 | 0.1 | 3.7 | 43.8 | 6.3 | 48.2 | -3.7 | | ₹ 250 million – ₹1 billion | 14.8 | 15.4 | 15.1 | 13.8 | 30.1 | 24.9 | 31.9 | 30.8 | | ₹ 1 billion and above | 10.7 | 14.3 | 10.7 | 13.8 | 4.2 | 18.0 | -13.6 | 15.1 | | Industry-wise | | | | | | | | | | Mining and quarrying | 0.1 | 12.2 | 1.1 | 10.0 | 15.4 | 17.9 | 34.0 | 18.3 | | Manufacturing | 8.0 | 9.5 | 8.1 | 8.9 | 17.4 | 17.5 | 11.8 | 23.1 | | Food products and beverages | 8.3 | 6.4 | 9.5 | 5.6 | 8.2 | 15.6 | -21.4 | 32.5 | | Textiles | 12.7 | 5.7 | 13.7 | 4.8 | 29.0 | 7.7 | 48.3 | 2.6 | | Chemicals and chemical products | 13.2 | 8.0 | 12.8 | 7.3 | 18.7 | 18.2 | 11.1 | 25.3 | | Iron and steel | 1.1 | 9.3 | 0.6 | 9.6 | 23.9 | 14.7 | 107.5 | -1.0 | | Machinery and equipments’ | 5.9 | 10.0 | 6.9 | 8.8 | 11.7 | 16.6 | -0.3 | 20.1 | | Electrical machinery and apparatus | 10.0 | 10.8 | 10.1 | 9.0 | 7.4 | 31.5 | -26.3 | 88.8 | | Motor vehicles and other transport equipment’s | -3.2 | 11.7 | -2.6 | 8.4 | -18.3 | 80.1 | -77.4 | # | | Construction | 4.8 | 10.4 | 6.7 | 3.9 | # | 21.5 | # | # | | Services | 9.8 | 15.5 | 9.9 | 15.2 | 21.0 | 15.3 | 20.6 | 9.0 | | Wholesale and retail trade | 8.9 | 18.3 | 8.6 | 18.9 | # | -37.8 | # | -57.4 | | Transport, storage and communication | 9.4 | 13.3 | 10.1 | 13.3 | 5.9 | 14.5 | -4.1 | 21.3 | | Real Estate | 7.7 | 23.6 | 7.0 | 15.4 | # | # | # | # | | Computer and related activities | 14.6 | 19.7 | 16.1 | 22.4 | 11.5 | 12.8 | 13.2 | 9.6 | | # Denominator negative, nil or negligible |
| Statement 1: Growth Rates of Select Parameters of Private Limited Companies (Concld.) | | (Per cent) | | | Growth Rates | | Net worth | Total borrowings | Total net asset | | 2013-14 | 2014-15 | 2013-14 | 2014-15 | 2013-14 | 2014-15 | | Number of sample cos | 237,398 | 237,398 | 237,398 | 237,398 | 237,398 | 237,398 | | Aggregate (All Companies) | 7.7 | 8.1 | 19.3 | 11.6 | 10.6 | 11.6 | | Sales-wise | | | | | | | | Less than ₹ 250 million | 4.8 | 3.8 | 19.2 | 15.1 | 9.4 | 8.9 | | ₹ 250 million – ₹1 billion | 10.3 | 10.0 | 16.5 | 10.1 | 13.3 | 9.1 | | ₹ 1 billion and above | 15.5 | 20.0 | 22.0 | 3.9 | 11.7 | 19.9 | | Industry-wise | | | | | | | | Mining and quarrying | 7.7 | 5.7 | 10.2 | 1.2 | 7.2 | 3.5 | | Manufacturing | 9.9 | 10.5 | 16.7 | 6.2 | 10.1 | 8.1 | | Food products and beverages | 5.9 | 4.9 | 19.3 | 1.1 | 9.2 | 4.3 | | Textiles | 12.5 | 10.4 | 13.6 | 6.6 | 12.6 | 8.1 | | Chemicals and chemical products | 11.2 | 13.4 | 16.0 | 15.4 | 10.2 | 11.1 | | Iron and steel | 4.8 | 6.9 | 20.6 | 5.8 | 8.0 | 7.1 | | Machinery and equipments’ | 13.8 | 13.1 | 14.4 | 7.8 | 10.5 | 7.7 | | Electrical machinery and apparatus | 8.2 | 13.3 | 28.6 | 6.0 | 11.7 | 7.4 | | Motor vehicles and other transport equipment’s | 11.5 | 11.4 | 4.4 | -2.0 | 2.6 | 11.0 | | Construction | 4.5 | 3.9 | 21.3 | 13.3 | 13.2 | 19.0 | | Services | 6.9 | 8.1 | 16.5 | 13.5 | 9.1 | 11.6 | | Wholesale and retail trade | 2.6 | 5.7 | 27.4 | 5.4 | 5.9 | 9.9 | | Transport, storage and communication | 10.5 | 12.2 | 16.8 | 2.9 | 9.9 | 7.5 | | Real Estate | 6.6 | 5.5 | 18.7 | 17.0 | 14.8 | 12.4 | | Computer and related activities | 15.3 | 27.6 | 19.5 | 48.0 | 15.3 | 26.2 |
| Statement 2: Ratios of Select Parameters of Private Limited Companies (Contd.) | | (Per cent) | | | Ratios | | Operating profit to Sales | PAT to net worth | Total borrowings to equity | | 2012-13 | 2013-14 | 2014-15 | 2012-13 | 2013-14 | 2014-15 | 2012-13 | 2013-14 | 2014-15 | | Number of sample cos | 237,398 | 237,398 | 237,398 | 237,398 | 237,398 | 237,398 | 237,398 | 237,398 | 237,398 | | Aggregate (All Companies) | 7.7 | 8.7 | 9.1 | 7.6 | 8.7 | 9.1 | 70.1 | 77.7 | 80.3 | | Sales-wise | | | | | | | | | | | Less than ₹ 250 million | 7.1 | 10.2 | 10.4 | 4.2 | 5.9 | 5.5 | 62.4 | 71.1 | 78.8 | | ₹ 250 million – ₹1 billion | 9.0 | 10.2 | 11.1 | 16.8 | 20.1 | 23.8 | 89.3 | 94.3 | 94.3 | | ₹ 1 billion and above | 7.3 | 6.8 | 7.0 | 12.4 | 9.3 | 8.9 | 81.8 | 86.4 | 74.9 | | Industry-wise | | | | | | | | | | | Mining and quarrying | 5.4 | 6.2 | 6.5 | 2.6 | 3.3 | 3.7 | 85.0 | 87.0 | 83.3 | | Manufacturing | 6.3 | 6.8 | 7.3 | 12.0 | 12.2 | 13.6 | 86.3 | 91.7 | 88.1 | | Food products and beverages | 4.8 | 4.8 | 5.2 | 8.3 | 6.2 | 7.8 | 82.2 | 92.6 | 89.3 | | Textiles | 6.2 | 7.1 | 7.2 | 14.0 | 18.4 | 17.1 | 110.6 | 111.6 | 107.7 | | Chemicals and chemical products | 7.5 | 7.9 | 8.6 | 13.7 | 13.7 | 15.1 | 76.5 | 79.8 | 81.2 | | Iron and steel | 2.5 | 3.1 | 3.3 | 2.5 | 4.9 | 4.5 | 95.0 | 109.4 | 108.2 | | Machinery and equipments’ | 10.6 | 11.2 | 11.9 | 18.8 | 16.4 | 17.5 | 65.7 | 66.0 | 62.9 | | Electrical machinery and apparatus | 7.4 | 7.2 | 8.6 | 11.9 | 8.1 | 13.5 | 88.5 | 105.2 | 98.5 | | Motor vehicles and other transport equipment’s | 6.1 | 5.2 | 8.3 | 16.6 | 3.4 | 20.1 | 94.8 | 88.7 | 78.0 | | Construction | 2.8 | 8.7 | 9.6 | -4.1 | -0.4 | -1.6 | 152.1 | 176.6 | 192.6 | | Services | 9.9 | 10.9 | 10.8 | 8.3 | 9.4 | 9.4 | 47.5 | 51.8 | 54.4 | | Wholesale and retail trade | 0.2 | 1.5 | 0.8 | 0.1 | 1.1 | 0.4 | 27.2 | 33.7 | 33.6 | | Transport storage and communication | 11.2 | 10.8 | 11.0 | 26.5 | 23.0 | 24.9 | 107.0 | 113.1 | 103.7 | | Real Estate | -16.3 | -4.7 | 0.2 | -7.5 | -4.0 | -4.5 | 105.4 | 117.3 | 130.1 | | Computer and related activities | 25.5 | 24.8 | 23.4 | 36.8 | 36.1 | 31.0 | 26.1 | 27.1 | 31.4 |
| Statement 2: Ratios of Select Parameters of Private Limited Companies (Concld.) | | (Per cent) | | | Ratios | | Debt to equity | Interest coverage ratio* | | 2012-13 | 2013-14 | 2014-15 | 2012-13 | 2013-14 | 2014-15 | | Number of sample cos | 237,398 | 237,398 | 237,398 | 237,398 | 237,398 | 237,398 | | Aggregate (All Companies) | 43.0 | 47.2 | 49.5 | 3.0 | 3.2 | 3.2 | | Sales-wise | | | | | | | | Less than ₹ 250 million | 40.8 | 47.1 | 52.3 | 2.7 | 3.2 | 2.9 | | ₹ 250 million – ₹ 1 billion | 53.4 | 55.9 | 55.4 | 3.3 | 3.6 | 3.9 | | ₹ 1 billion and above | 42.3 | 40.9 | 38.2 | 3.1 | 2.8 | 2.9 | | Industry-wise | | | | | | | | Mining and quarrying | 56.5 | 49.2 | 47.9 | 1.9 | 1.9 | 2.1 | | Manufacturing | 43.3 | 43.1 | 43.5 | 2.8 | 2.9 | 3.1 | | Food products and beverages | 38.0 | 39.9 | 41.8 | 2.5 | 2.2 | 2.2 | | Textiles | 57.1 | 55.8 | 54.6 | 2.4 | 2.9 | 2.8 | | Chemicals and chemical products | 39.2 | 36.7 | 43.0 | 3.2 | 3.6 | 4.4 | | Iron and steel | 40.8 | 47.3 | 48.2 | 1.3 | 1.5 | 1.5 | | Machinery and equipments’ | 32.8 | 34.3 | 30.9 | 4.8 | 4.5 | 4.9 | | Electrical machinery and apparatus | 51.5 | 55.4 | 51.4 | 2.7 | 2.3 | 2.8 | | Motor vehicles and other transport equipment’s | 46.1 | 36.5 | 40.7 | 3.2 | 1.8 | 4.5 | | Construction | 115.1 | 133.0 | 144.7 | 0.6 | 1.1 | 1.0 | | Services | 28.7 | 31.2 | 32.4 | 4.4 | 4.7 | 4.5 | | Wholesale and retail trade | 14.0 | 16.7 | 17.5 | 1.3 | 1.8 | 1.4 | | Transport storage and communication | 69.8 | 72.0 | 67.0 | 4.7 | 4.4 | 4.6 | | Real Estate | 65.9 | 74.5 | 81.2 | -0.5 | 0.3 | 0.4 | | Computer and related activities | 16.9 | 17.6 | 15.9 | 24.9 | 23.9 | 23.5 | | * Actual ratio |
| Statement 3: Composition of Liabilities and Assets of Private Limited Companies | | (Per cent) | | A. Composition of liabilities | | Year | 2012-13 | 2013-14 | 2014-15 | | 1. Shareholders' Funds | 42.7 | 41.9 | 40.7 | | (i) Share Capital | 10.0 | 10.4 | 10.3 | | (ii) Reserves and Surplus | 32.6 | 31.5 | 30.4 | | (a) Capital reserve | 19.3 | 19.7 | 18.8 | | 2. Long-term borrowings (debt) | 18.8 | 20.0 | 20.3 | | (a) Bonds/ Debentures-removed | 1.9 | 1.9 | 2.2 | | Term loans from banks- removed | 9.7 | 9.9 | 9.8 | | 3. Short-term borrowings | 11.9 | 13.0 | 12.6 | | of which, from banks- removed | 5.2 | 3.7 | 3.9 | | 4. trade payable | 11.8 | 11.8 | 12.0 | | 5. provision | 1.7 | 1.9 | 1.9 | | 6. other liability | 13.0 | 11.4 | 12.5 | | (i) non-current | 2.3 | 1.5 | 2.0 | | (ii) current | 10.7 | 9.9 | 10.4 | | TOTAL | 100.0 | 100.0 | 100.0 |
| B. Composition of assets | | (Per cent) | | Year | 2012-13 | 2013-14 | 2014-15 | | 1. Gross Fixed Assets | 32.6 | 33.0 | 35.2 | | (a) Tangible assets | 26.5 | 25.6 | 25.9 | | (b) Capital work in progress | 3.3 | 3.4 | 3.7 | | (c) Intangible asset | 2.1 | 2.4 | 4.4 | | 2. Depreciation (i) Tangible | 7.2 | 7.6 | 8.0 | | (ii) Intangible | 0.6 | 0.7 | 0.8 | | 3. Net fixed assets | 24.8 | 24.7 | 26.4 | | 4. Non-current investments | 16.1 | 15.5 | 14.8 | | 5. Current investments | 3.6 | 3.2 | 3.2 | | 6. Loans and advances | 16.7 | 16.5 | 15.5 | | 7. Inventories | 16.0 | 16.5 | 16.4 | | 8. Trade receivables | 12.6 | 12.6 | 12.7 | | 9. Cash and cash equivalents | 7.0 | 6.7 | 6.9 | | 10. Other assets | 3.1 | 4.2 | 4.0 | | (i) non-current | 0.9 | 1.6 | 1.2 | | (ii) current | 2.2 | 2.5 | 2.8 | | TOTAL | 100.0 | 100.0 | 100.0 |
| Statement 4: Composition of Sources and Uses of Funds of Private Limited Companies | | (Per cent) | | A. Composition of sources of funds during the year | | | 2013-14 | 2014-15 | | Internal sources | 27.0 | 29.5 | | 1. Paid-up Capital | 12.9 | 7.5 | | 2. Reserves and Surplus | -0.6 | 8.9 | | 3. Provisions | 14.7 | 13.1 | | of which, Depreciation | 11.8 | 11.3 | | External sources | 73.0 | 70.5 | | 4. Share Capital and Premium | 15.4 | 9.8 | | 5. Long-term borrowings | 28.2 | 20.6 | | of which, (a) Bonds / Debentures | 1.5 | 4.4 | | (b) From banks | 11.1 | 8.5 | | 6. Short-term borrowings | 20.8 | 8.6 | | of which, From banks | -8.5 | 5.2 | | 7. Trade payables | 11.1 | 12.2 | | 8. Other liabilities | -2.5 | 19.3 | | (i) non-current | -5.0 | 5.8 | | (ii) current | 2.5 | 13.5 | | TOTAL | 100.0 | 100.0 |
| B. Composition of uses of funds during the year | | | 2013-14 | 2014-15 | | 1. Gross Fixed Assets | 32.7 | 48.0 | | (i) Tangible assets | 14.9 | 24.7 | | of which, Plant and machinery | 28.8 | 10.9 | | (ii) Capital Work-in-progress | 4.0 | 5.3 | | (iii) Intangible assets | 13.8 | 18.0 | | 2. Non-current investments | 9.2 | 7.2 | | 3. Current investments | -0.3 | 2.8 | | 4. Loans and advances | 12.9 | 6.1 | | 5. Inventories | 18.7 | 13.9 | | 6. Trade Receivables | 11.0 | 11.8 | | 7. Cash and cash equivalents | 3.2 | 7.7 | | 8. Other assets | 12.7 | 2.4 | | (i) non-current | 8.0 | -2.3 | | (ii) current | 4.7 | 4.7 | | TOTAL | 100.0 | 100.0 |
ratio >=200 includes companies with negative net worth and EBIT to interest expense, i.e., ICR<1 also includes companies having borrowings but EBIT <=0. |