The overall resource balance of the economy, measured by the saving-investment correspondence, improved considerably in 2013-14 in relation to the preceding two years, mainly reflecting the sizable reduction in the net resource gap of private non-financial corporations as well as the significant cutback in investment in valuables (largely gold). Investments became the most preferred financial instrument in 2013-14. Measures of financial interconnectedness corroborated the systemic importance of banking and household sectors. I. Introduction Flow of Funds (FoF) accounts show transactions in financial instruments in an economy on a ‘from whom- to-whom basis’ in a three dimensional plane. By tracking interactions between the real and financial sectors, the FoF sheds light on the financial development of the economy. International standards for compiling FoF have evolved around the System of National Accounts (SNA) of the United Nations Statistical Commission. The SNA 2008 is its fifth and latest version. Globally, there is an intensified focus on the implementation of the SNA 2008, largely as a result of the G-20’s Data Gaps Initiative. Australia was the first country to implement the SNA 2008 in 2009. Currently, all OECD countries have adopted it except Turkey (which plans to implement it in 2015), Japan and Chile (which will adopt it by 2016).1 For several countries, it is their central banks – the Federal Reserve Board, the European Central Bank, the Bank of Japan, the People’s Bank of China, and the South African Reserve Bank, to name a few – that compile the FoF. Drawing on the recommendations of a Working Group2, the Reserve Bank which has been compiling the FoF for India since the early 1960s, is engaged in aligning these accounts with the SNA 2008. Under the existing framework, the Indian economy is divided into six major sectors – Banking, Other Financial Institutions (OFI), Private Corporate Business (PCB), Government, Rest of the World (ROW) and Households.3 Transactions between these sectors are classified under nine categories of financial instruments viz., currency and deposits, investments, loans and advances, small savings, life funds, provident funds, trade debts, foreign claims not elsewhere classified (NEC) and other claims NEC. This article analyses the FoF accounts of India for the fiscal year 2013-14 along with revised data for 2012- 13. The rest of the article is organised into five sections. Section II sets out an overview of the sectoral resource gaps between saving and physical investment. Sectoral and instrument-wise movements in flow of funds are discussed in Section III. Select indicators of financial development and measures of financial interconnectedness are profiled in Section IV. Section V sums up and concludes the article. II. Evolution of Sectoral Saving-Investment Gaps4 The overall resource balance of the economy, measured by the saving-investment gap and mirrored in the current account deficit (CAD), improved considerably in 2013-14 in relation to the preceding two years. Driving this consolidation was the sizable reduction in the net resource gap of private nonfinancial corporations and the significant cutback in investment in valuables (largely gold), following tax and administrative curbs imposed towards the end of 2012-13. The financial surplus (or financial saving) of the household sector increased during 2013-14, while the improvement in the net resource position of private financial corporations was supported by substantial capital transfers. On the other hand, the resource gap of the general government sector widened, reflecting increase in its investment; net saving of public financial and non-financial corporations deteriorated somewhat (Table 1). Table 1: Net Saving and Net Investment of Different Sectors5
[As percentage of Net National Income (NNI) at current market prices] | | (per cent) | | | 2011-12 | 2012-13 | 2013-14 | | 1. Public Non-Financial Corporations | | | | | (i) Net Saving | 0.1 | 0.3 | 0.1 | | (ii) Net Capital Formation | 2.9 | 2.6 | 2.7 | | (iii) Resource Gap [(i) - ii)] | -2.7 | -2.3 | -2.6 | | 2. Private Non-Financial Corporations | | | | | (i) Net Saving | 5.3 | 5.5 | 6.2 | | (ii) Net Capital Formation | 9.9 | 10.3 | 9.5 | | (iii) Resource Gap [(i) - ii)] | -4.6 | -4.8 | -3.2 | | 3. Public Financial Corporations | | | | | (i) Net Saving | 2.4 | 2.1 | 1.9 | | (ii) Net Capital Formation | 0.1 | 0.1 | 0.1 | | (iii) Surplus [(i) - ii)] | 2.3 | 2.0 | 1.8 | | 4. Private Financial Corporations | | | | | (i) Net Saving | 1.3 | 1.5 | 1.8 | | (ii) Net Capital Formation | 0.4 | 0.3 | 0.2 | | (iii) Surplus [(i) - ii)] | 0.8 | 1.1 | 1.6 | | 5. General Government | | | | | (i) Net Saving | -4.1 | -3.5 | -3.2 | | (ii) Net Capital Formation | 2.8 | 2.7 | 3.5 | | (iii) Resource Gap [(i) - ii)] | -6.9 | -6.2 | -6.6 | | 6. Household Sector | | | | | (i) Net Saving | 21.6 | 18.6 | 16.3 | | (ii) Net Capital Formation | 13.4 | 10.7 | 8.2 | | (iii) Surplus [(i) - ii)] | 8.2 | 7.9 | 8.1 | | 7. Total (1 to 6) | | | | | (i) Net Saving | 26.6 | 24.3 | 23.2 | | (ii) Net Capital Formation | 29.5 | 26.7 | 24.2 | | (iii) Resource Gap [(i) - ii)] | -2.9 | -2.3 | -1.0 | | 8. Valuables | 2.8 | 2.7 | 1.1 | | 9. Errors and Omissions | -0.9 | 0.4 | -0.3 | | 10. Overall Resource Gap [7(iii)-8-9] | -4.8 | -5.4 | -1.8 | | Memo Items: | | | | | 11. Surplus/Resource Gap of: | | | | | (i) Financial Corporations [3(iii) + 4(iii)] | 3.2 | 3.1 | 3.4 | | (ii) Non-Financial Corporations [1(iii) + 2(iii)] | -7.3 | -7.1 | -5.9 | | (iii) Private Financial and Non- Financial Corporations [2(iii) + 4(iii)] | -3.8 | -3.7 | -1.6 | | (iv) Public Financial and Non-Financial Corporations [1(iii) + 3(iii)] | -0.4 | -0.3 | -0.8 | | (v) Public Sector [1(iii) + 3(iii) + 5(iii)] | -7.3 | -6.5 | -7.5 | | Source: CSO. | In the aggregate, the reduction in the overall resource gap in 2013-14, and hence in the reliance on foreign saving, resulted from a sharper reduction in domestic investment than in overall domestic saving. Households and financial corporations (both public and private) continued to remain the surplus sectors, providing funds to the other domestic sectors. III. Sectoral Movements in FoF Total claims issued by all sectors (including the ROW) declined for the third consecutive year in 2013- 14, a fall of over 8 percentage points of net national income (NNI) and by over 17 percentage points from their recent peak in 2010-11 (Chart 1). The reduction in claims issued in 2013-14 was evident across all domestic non-financial sectors except the Government sector. III.1 Private Corporate Business Sector6 The private corporate business (PCB) sector’s saving improved during 2013-14 with the deceleration in operating expenses offsetting the slowdown in sales. The physical investment rate of the sector also declined during the year in an uncertain domestic policy environment and volatility in foreign exchange and capital markets. Consequently, the resource gap of the PCB sector was lower than in the previous year as a proportion to NNI. This was reflected in a larger decline in the sector’s financial claims (as a proportion to NNI) relative to its financial investment. Specifically, commercial borrowings from the ROW sector as well as foreign institutional investment (FII) in equity (paid-up capital) slackened during the year (Chart 2). Furthermore, these companies reduced their loans to other sectors and continued to liquidate their fixed deposits in commercial banks. The banking and the ROW sectors predominantly financed the resource gap of the PCB sector. III.2 Government Sector The financing pattern of the resource gap of the government sector has shown significant changes over the years (Chart 3). The widening of the resource gap of the government sector in 2013-14 was mirrored in higher issuances of Government dated securities (largely subscribed by commercial banks and insurance companies) as also higher borrowings by non departmental commercial undertakings (NDCUs) from commercial banks and other financial institutions (OFI) sector. Financial investments by the government sector dipped during the year, reflecting a much lower order of build-up of cash balances of the Central and State Governments with the banking system than in the preceding two years. The NDCU sub-sector (which includes public sector enterprises and power companies) drew down its cash balances with commercial banks and expanded its lending to other entities. The banking sector, followed by the OFI sector, remained the predominant sources of financing the Government sector’s resource gap. Investments in provident funds boosted households’ funding of the government sector. 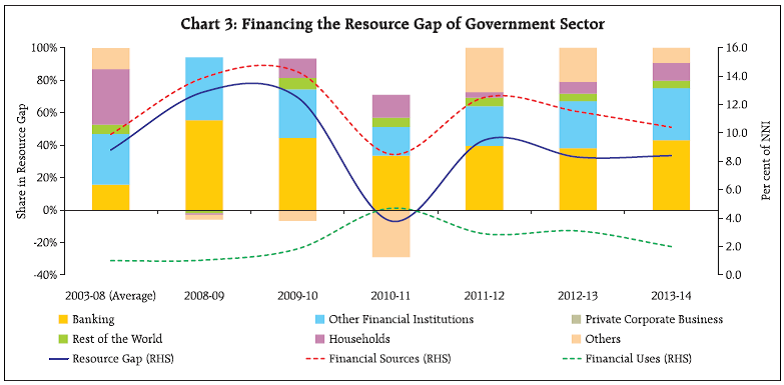 III.3 Rest of the World Sector Net financial claims issued by the rest of the world (ROW) sector picked up in 2013-14, largely reflecting the build-up of foreign currency assets of the Reserve Bank during the second half of the year (Chart 4). This mainly reflected the impact of policy measures for enhancing foreign inflows to manage the effects of the US Federal Reserve’s ‘taper talk’ - particularly via the swap window for fresh Foreign Currency Non-Resident (Bank) [FCNR(B)] deposits of commercial banks – which more than recouped the outflows from the reserves in the first half of the year. Consequently, the share of the banking sector in net financial claims of the ROW sector increased substantially in 2013-14, even as those of the PCB sector remained predominant. 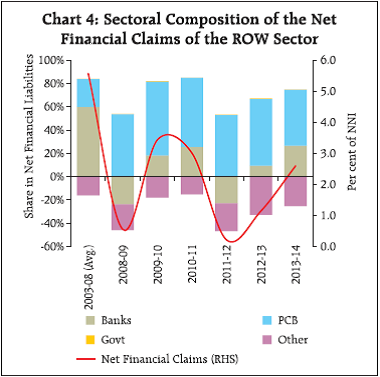 These developments notwithstanding, net financial assets (increase in assets minus decrease in assets) of the ROW sector declined in 2013-14, largely mirroring the sharp reduction in (i) external commercial borrowings (particularly via short-term trade credits) of the PCB sector and (ii) foreign investment (both FDI and FII) (Chart 5). III.4 Household Sector The financial surplus of the household sector (i.e., financial uses minus sources) improved during 2013-14, as real financial returns turned positive with the moderation in inflation. The composition of the financial surplus changed only slightly from the previous year, with banks accounting for the predominant share (55 per cent), followed by the OFI sector (largely reflecting life insurance premium, provident and pension funds) and the Government sector (Chart 6). III.5 Banking Sector Financial claims issued by the banking sector remained more or less unchanged during 2013-14, although sharp changes in composition were evident (Chart 7). Sizable accretions to (i) households deposits (ii) FCNR(B) deposits from the ROW sector, (iii) deposits of government commercial undertakings and (iv) the ‘currency and the gold revaluation account’(CGRA) (‘other liabilities’) of the RBI were offset by outflows of deposits of the PCB and the OFI sectors. Furthermore, borrowings from the OFI sector contracted during the year. In the aggregate, while households continued to account for the predominant share of the sources of funds of the banking sector, the share of the ROW sector increased sharply during the year. Financial uses of the banking sector also increased during the year, largely reflecting accretions to the RBI’s foreign currency assets, as stated earlier (Chart 8). III.6 Other Financial Institutions Sector Financial claims issued by the other financial institutions (OFI) sector dipped during 2013-14, mainly reflecting a sharp contraction in the issuance of bonds and debentures by financial corporations, and in particular by NBFCs (Chart 9). At the same time, robust accretions under life insurance funds and provident and pension funds boosted the share of the household sector in the total claims of the OFI sector. Financial uses of the OFI sector increased pari passu with their investment in Central Government securities and debentures of private companies even as their deposits with and loans to commercial banks declined (Chart 10). III.7 Financial Flows by Instruments Currency and deposits continued to gain ground as instruments of inter-sectoral financial flows, boosted by the robust increase in FCNR (B) deposits during 2013-14 (Chart 11). Notwithstanding a reduction in their share in total claims, investments became the most preferred financial instrument in 2013-14 relegating loans and advances to the second position. Investment in private securities (including mutual funds) dampened during the year, which offset the slight increase in flows into Government securities. The shares of life funds and provident funds in total claims issued, however, improved. IV. Select Indicators of Financial Development With the evolution of overall and sectoral resource balances as a backdrop, it is useful to explore the speed and quality of financial development with the help of the FoF (Table 2). The finance ratio, which measures the proportion of total financial claims issued to national income, is the broadest indicator of the rate of financial development. This ratio declined in 2013-14 to its lowest level in the years following the global financial crisis and well below the pre-crisis period average, mainly reflecting the slowing pace of domestic primary issues in the wake of declining investment rates of corporates. On the other hand, the intermediation ratio (which depicts the ratio of financial claims issued by the financial sector to those issued by the non-financial sector) and the financial inter-relation ratio (measuring the importance of total issues in net domestic capital formation) showed some decline in 2013-14. However, the new issue ratio (primary issues to net domestic capital formation) remained unchanged (Table 2). | Table 2: Financial Ratios: 2003-04 to 2013-14 | | (Amount in ₹ billion) | | | 2003-04 to 2007-08 (Average) | 2008-09 | 2009-10 | 2010-11 | 2011-12 | 2012-13 | 2013-14 | | 1 | 2 | 3 | 4 | 5 | 6 | 7 | 8 | | 1. Secondary Issues# | 7,711 | 11,545 | 13,671 | 16,796 | 17,203 | 19,870 | 18,838 | | 2. Primary Issues## | 11,586 | 13,777 | 19,346 | 24,450 | 25,715 | 25,893 | 24,667 | | 2.1 Domestic Sectors | 9,642 | 13,505 | 17,401 | 22,404 | 25,546 | 24,878 | 22,055 | | 2.2 Rest of the World | 1,944 | 272 | 1,945 | 2,046 | 169 | 1,015 | 2,612 | | 3. Total Issues (1+2) | 19,297 | 25,322 | 33,017 | 41,246 | 42,917 | 45,958 | 43,705 | | 4. Net Domestic Capital Formation@ | 9,873 | 14,414 | 17,971 | 21,958 | 24,614 | 26,291 | 25,138 | | 5. Net National Income at current market prices (Base year 2011-12) | 33,452 | 49,286 | 56,613 | 67,995 | 78,465 | 88,417 | 1,00,565 | | 6. Finance Ratio (Ratio of 3 to 5) | 0.55 | 0.51 | 0.58 | 0.61 | 0.55 | 0.52 | 0.43 | | 7. Financial Inter-relations Ratio (Ratio of 3 to 4) | 1.91 | 1.76 | 1.84 | 1.88 | 1.74 | 1.74 | 1.73 | | 8. New Issue Ratio ( Ratio of 2 to 4) | 1.14 | 0.96 | 1.08 | 1.11 | 1.04 | 0.98 | 0.98 | | 9. Intermediation Ratio (Ratio of 1 to 2) | 0.68 | 0.84 | 0.71 | 0.69 | 0.67 | 0.77 | 0.76 | #: Refers to issues by financial intermediaries (i.e., Banks and Other Financial Institutions).
##: Refers to issues by all sectors other than financial intermediaries.
@: At Current Prices. | Financial Interconnectedness The application of the input-output framework to the FoF sectors and, in particular, the concepts of backward and forward linkages between industries/ sectors provides insights into financial interconnectedness across the sectors of the economy.7 In the context of FoF, the power of dispersion index (PDI) measures the direct and indirect financing demand in the aggregate induced by a unit shock (additional financing demand) from a certain sector8. On the other hand, the sensitivity of dispersion index (SDI) measures the direct and indirect financing demand from a certain sector induced by a unit shock (additional financing demand) from all sectors. In order to detract from year-to-year changes, average PDIs and SDIs are calculated for different sectors for two periods viz., 2003-04 to 2007-08 (pre-global crisis and high growth phase) and 2008-09 to 2013-14 (post-global crisis period) [Charts 12 and 13].
The PDIs for different FoF sectors have hovered around unity in the two periods. Between the two periods, however, there has been an increase in financial claims of the government and the ROW sectors in the more recent period at the cost of a reduction of financial claims in respect of households, banking and other financial institutions. On the other hand, the SDIs of the banking and household sectors have remained substantially above unity, on average, during both the pre-and post-global crisis periods. The high value of SDI for the banking sector is on expected lines, given that the financial system in India is bank-dependent. The high value of SDI of the household sector follows from the fact that over half of household financial saving is invested in bank deposits. The SDIs of the OFI, Government, ROW and PCB sectors were each less than unity during pre-and post-global crisis periods. The increase in SDIs of the PCB and ROW sectors in the post-crisis period has systemic implications: the relatively large exposure of the PCB sector to the ROW sector, particularly via external commercial borrowings and foreign investment, exposes the former to external vulnerabilities. V. Conclusions Despite continued pressure from public sector budgets, financial resource mobilisation decelerated for the third consecutive year in 2013-14, as reflected in a genera l decline in aggregate claims issued by all sectors. Decelerating private sector investment as well as administrative curbs on the import of valuables obviated the need for mobilising large-scale financial resources in 2013-14. Nonetheless, the increase in financial claims relative to capital formation suggests that financial resources were absorbed into uses other than physical investment. The banking sector continued to account for the predominant share of total claims in 2013-14, attesting to its central role in financial intermediation in the Indian economy. The Government sector, though primarily funded by the banking sector, progressively increased its reliance on the OFI sector. The household sector remained the main financial surplus sector, with banking followed by the OFI sector being the predominant recipients of its resource transfers. Investments became the most preferred financial instrument in 2013-14. The share of currency and deposits continued to increase, buoyed by the substantial increase in FCNR (B) deposits during 2013-14. Measures of financial interconnectedness corroborated the fact that the banking and household sectors are critical suppliers of financial resources and therefore, disruptions to these supply sources would have systemic implications.
|