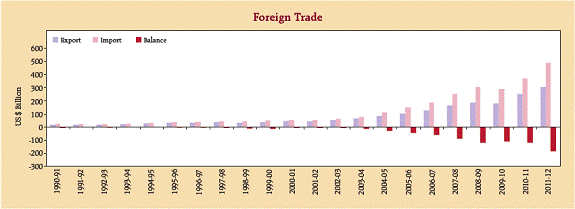
(US $ Million) |
Year/Month |
Exports |
Imports |
Trade Balance |
Aggregate |
Oil |
Non-oil |
Aggregate |
Oil |
Non-oil |
Aggregate |
Oil |
Non-oil |
1 |
2 |
3 |
4 |
5 |
6 |
7 |
8 |
9 |
2003-04 |
63,843 |
3,568 |
60,274 |
78,149 |
20,569 |
57,580 |
-14,307 |
-17,001 |
2,694 |
2004-05 |
83,536 |
6,989 |
76,547 |
111,517 |
29,844 |
81,673 |
-27,981 |
-22,855 |
-5,127 |
2005-06 |
103,091 |
11,640 |
91,451 |
149,166 |
43,963 |
105,203 |
-46,075 |
-32,323 |
-13,752 |
2006-07 |
126,414 |
18,635 |
107,779 |
185,735 |
56,945 |
128,790 |
-59,321 |
-38,311 |
-21,011 |
2007-08 |
162,904 |
28,363 |
134,541 |
251,439 |
79,645 |
171,795 |
-88,535 |
-51,281 |
-37,254 |
2008-09 |
185,295 |
27,547 |
157,748 |
303,696 |
93,672 |
210,025 |
-118,401 |
-66,125 |
-52,277 |
2009-10 |
178,751 |
28,192 |
150,559 |
288,373 |
87,136 |
201,237 |
-109,621 |
-58,944 |
-50,678 |
2010-11 |
251,136 |
41,480 |
209,656 |
369,769 |
105,964 |
263,805 |
-118,633 |
-64,484 |
-54,149 |
2011-12 |
304,624 |
55,604 |
249,020 |
489,417 |
154,906 |
334,511 |
-184,794 |
-99,302 |
-85,491 |
2010-11 |
|
|
|
|
|
|
|
|
|
April |
18,139 |
2,748 |
15,391 |
31,675 |
9,454 |
22,221 |
-13,536 |
-6,706 |
-6,829 |
May |
17,282 |
2,583 |
14,698 |
29,747 |
8,571 |
21,176 |
-12,465 |
-5,988 |
-6,478 |
June |
20,667 |
3,343 |
17,324 |
28,649 |
7,830 |
20,818 |
-7,982 |
-4,487 |
-3,495 |
July |
16,954 |
2,927 |
14,028 |
29,670 |
8,357 |
21,313 |
-12,715 |
-5,430 |
-7,285 |
August |
17,750 |
3,031 |
14,719 |
27,108 |
7,192 |
19,915 |
-9,357 |
-4,161 |
-5,196 |
September |
18,984 |
3,021 |
15,964 |
29,512 |
8,425 |
21,087 |
-10,528 |
-5,404 |
-5,124 |
October |
19,081 |
3,482 |
15,599 |
32,462 |
8,346 |
24,115 |
-13,381 |
-4,864 |
-8,517 |
November |
22,575 |
3,228 |
19,347 |
28,842 |
7,792 |
21,050 |
-6,267 |
-4,564 |
-1,704 |
December |
23,349 |
3,937 |
19,413 |
31,511 |
9,244 |
22,267 |
-8,162 |
-5,307 |
-2,855 |
January |
22,692 |
4,083 |
18,609 |
33,354 |
9,722 |
23,632 |
-10,662 |
-5,639 |
-5,023 |
February |
23,243 |
3,915 |
19,329 |
32,973 |
9,078 |
23,895 |
-9,730 |
-5,164 |
-4,566 |
March |
30,419 |
5,182 |
25,236 |
34,267 |
11,953 |
22,314 |
-3,848 |
-6,770 |
2,922 |
2011-12 R |
|
|
|
|
|
|
|
|
|
April |
23,474 |
5,121 |
18,353 |
36,598 |
13,004 |
23,594 |
-13,125 |
-7,883 |
-5,242 |
May |
26,524 |
5,309 |
21,215 |
45,271 |
13,144 |
32,127 |
-18,748 |
-7,835 |
-10,913 |
June |
26,539 |
4,853 |
21,686 |
40,867 |
13,277 |
27,590 |
-14,328 |
-8,424 |
-5,904 |
July |
26,341 |
4,666 |
21,675 |
41,060 |
12,943 |
28,117 |
-14,719 |
-8,277 |
-6,442 |
August |
24,739 |
4,341 |
20,398 |
39,985 |
12,506 |
27,479 |
-15,245 |
-8,165 |
-7,081 |
September |
26,598 |
4,777 |
21,820 |
39,765 |
10,780 |
28,986 |
-13,168 |
-6,002 |
-7,166 |
October |
23,558 |
4,270 |
19,288 |
41,227 |
11,234 |
29,992 |
-17,669 |
-6,965 |
-10,704 |
November |
23,217 |
4,245 |
18,972 |
39,115 |
12,437 |
26,678 |
-15,897 |
-8,191 |
-7,706 |
December |
25,283 |
4,416 |
20,867 |
39,663 |
11,677 |
27,986 |
-14,381 |
-7,261 |
-7,119 |
January |
25,208 |
4,491 |
20,717 |
42,974 |
14,871 |
28,103 |
-17,766 |
-10,381 |
-7,385 |
February |
24,919 |
3,910 |
21,009 |
40,183 |
13,124 |
27,059 |
-15,264 |
-9,214 |
-6,050 |
March |
28,253 |
5,204 |
23,049 |
42,326 |
15,910 |
26,417 |
-14,073 |
-10,705 |
-3,368 |
2012-13 P |
|
|
|
|
|
|
|
|
|
April |
23,600 |
4,373 |
19,227 |
37,729 |
13,552 |
24,177 |
-14,129 |
-9,180 |
-4,949 |
May |
24,741 |
3,875 |
20,866 |
40,736 |
14,533 |
26,203 |
-15,995 |
-10,659 |
-5,337 |
June |
24,810 |
4,131 |
20,679 |
35,776 |
11,291 |
24,485 |
-10,966 |
-7,160 |
-3,806 |
July |
22,443 |
.. |
.. |
37,936 |
12,229 |
25,707 |
-15,493 |
.. |
.. |
August |
22,330 |
.. |
.. |
37,953 |
12,876 |
25,077 |
-15,622 |
.. |
.. |
P: Provisional. R: Revised. .. : Not Available. Source: DGCI & S and Ministry of Commerce & Industry.
Note: 1. Data conversion has been done using period average exchange rates. Also see ‘Notes on Tables’.
2. Monthly data may not add up to the annual data on account of revision in monthly figures. Also see ‘Notes on Tables’. |
 |