End of |
Foreign Currency Assets* |
Gold # |
SDRs ## |
Reserve Tranche Position in IMF |
Total |
`
billion |
In millions
of US $ |
`
billion |
In millions
of US $ |
In millions
of SDRs |
`
billion |
In millions
of US $ |
`
billion |
In millions
of US $ |
`
billion |
In
millions
of
US $ |
1 |
2 |
3 |
4 |
5 |
6 |
7 |
8 |
9 |
10=
(1+3+6+8) |
11=
(2+4+7+9) |
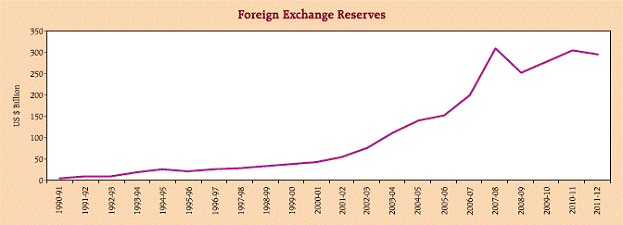
2007-08 |
11,960 |
299,230 |
401 |
10,039 |
11 |
1 |
18 |
17 |
436 |
12,380 |
309,723 |
2008-09 |
12,301 |
241,426 |
488 |
9,577 |
1 |
– |
1 |
50 |
981 |
12,839 |
251,985 |
2009-10 |
11,497 |
254,685 |
812 |
17,986 |
3,297 |
226 |
5,006 |
62 |
1,380 |
12,597 |
279,057 |
2010-11 |
12,249 |
274,330 |
1,026 |
22,972 |
2,882 |
204 |
4,569 |
132 |
2,947 |
13,610 |
304,818 |
2011-12 |
13,305 |
2,60,069 |
1,383 |
27,023 |
2,885 |
229 |
4,469 |
145 |
2,836 |
15,061 |
2,94,398 |
2010-11 |
|
|
|
|
|
|
|
|
|
|
|
April |
11,322 |
254,773 |
824 |
18,537 |
3,297 |
221 |
4,982 |
60 |
1,341 |
12,427 |
279,633 |
May |
11,517 |
247,951 |
902 |
19,423 |
3,297 |
226 |
4,861 |
61 |
1,309 |
12,706 |
273,544 |
June |
11,633 |
249,628 |
927 |
19,894 |
3,297 |
227 |
4,875 |
61 |
1,313 |
12,848 |
275,710 |
July |
12,012 |
258,551 |
896 |
19,278 |
3,297 |
233 |
5,006 |
63 |
1,348 |
13,203 |
284,183 |
August |
12,063 |
256,227 |
942 |
20,008 |
3,297 |
234 |
4,974 |
91 |
1,932 |
13,330 |
283,142 |
September |
11,914 |
265,231 |
922 |
20,516 |
3,297 |
230 |
5,130 |
90 |
1,993 |
13,156 |
292,870 |
October |
11,985 |
269,093 |
965 |
21,668 |
3,297 |
231 |
5,182 |
90 |
2,013 |
13,271 |
297,956 |
November |
12,121 |
263,281 |
1,019 |
22,124 |
3,297 |
232 |
5,031 |
90 |
1,954 |
13,462 |
292,389 |
December |
12,001 |
267,814 |
1,007 |
22,470 |
3,297 |
228 |
5,078 |
88 |
1,972 |
13,324 |
297,334 |
January |
12,402 |
269,893 |
1,007 |
21,924 |
3,297 |
237 |
5,150 |
104 |
2,259 |
13,749 |
299,224 |
February |
12,288 |
271,988 |
1,000 |
22,143 |
3,298 |
234 |
5,187 |
103 |
2,275 |
13,626 |
301,592 |
March |
12,249 |
274,330 |
1,026 |
22,972 |
2,882 |
204 |
4,569 |
132 |
2,947 |
13,610 |
304,818 |
2011-12 |
|
|
|
|
|
|
|
|
|
|
|
April |
12,517 |
282,037 |
1,056 |
23,790 |
2,882 |
207 |
4,671 |
134 |
3,013 |
13,914 |
313,511 |
May |
12,588 |
279,537 |
1,098 |
24,391 |
2,882 |
208 |
4,613 |
134 |
2,975 |
14,028 |
311,516 |
June |
12,676 |
283,458 |
1,103 |
24,668 |
2,883 |
206 |
4,614 |
133 |
2,975 |
14,119 |
315,715 |
July |
12,637 |
286,160 |
1,119 |
25,349 |
2,883 |
204 |
4,609 |
131 |
2,972 |
14,091 |
319,090 |
August |
13,163 |
286,034 |
1,303 |
28,319 |
2,884 |
213 |
4,638 |
138 |
2,991 |
14,818 |
321,982 |
September |
13,490 |
275,699 |
1,403 |
28,667 |
2,884 |
220 |
4,504 |
128 |
2,612 |
15,241 |
311,482 |
October |
13,786 |
282,087 |
1,314 |
26,896 |
2,884 |
224 |
4,574 |
130 |
2,653 |
15,453 |
316,210 |
November |
14,230 |
272,771 |
1,463 |
28,041 |
2,885 |
234 |
4,476 |
135 |
2,596 |
16,062 |
307,884 |
December |
14,006 |
262,933 |
1,418 |
26,620 |
2,885 |
236 |
4,429 |
144 |
2,706 |
15,804 |
296,688 |
January |
12,859 |
258,830 |
1,328 |
26,728 |
2,885 |
222 |
4,475 |
136 |
2,734 |
14,545 |
292,766 |
February |
12,751 |
260,544 |
1,377 |
28,128 |
2,885 |
220 |
4,490 |
138 |
2,828 |
14,486 |
295,989 |
March |
13,305 |
260,069 |
1,383 |
27,023 |
2,885 |
229 |
4,469 |
145 |
2,836 |
15,061 |
294,398 |
2012-13 |
|
|
|
|
|
|
|
|
|
|
|
April |
13,699 |
260,839 |
1,398 |
26,618 |
2,885 |
235 |
4,474 |
153 |
2,915 |
15,485 |
294,846 |
May |
14,288 |
253,237 |
1,444 |
25,585 |
2,886 |
246 |
4,358 |
160 |
2,839 |
16,137 |
286,019 |
May 4, 2012 |
13,924 |
259,189 |
1,398 |
26,618 |
2,885 |
240 |
4,460 |
156 |
2,906 |
15,717 |
293,173 |
May 11, 2012 |
13,832 |
257,860 |
1,398 |
26,618 |
2,885 |
238 |
4,435 |
155 |
2,890 |
15,623 |
291,802 |
May 18, 2012 |
14,056 |
256,117 |
1,398 |
26,618 |
2,886 |
241 |
4,399 |
157 |
2,866 |
15,852 |
290,000 |
May 25, 2012 |
14,178 |
254,406 |
1,398 |
26,618 |
2,886 |
244 |
4,381 |
159 |
2,854 |
15,979 |
288,259 |
June 1, 2012 |
14,153 |
253,094 |
1,444 |
25,585 |
2,886 |
243 |
4,347 |
158 |
2,832 |
15,998 |
285,857 |
June 8, 2012 |
14,094 |
254,594 |
1,444 |
25,585 |
2,886 |
241 |
4,360 |
157 |
2,840 |
15,936 |
287,379 |
– Negligible. See ‘Notes on Tables’
* FCA excludes US $ 250.00 millon invested in foreign currency denominated bonds issued by IFFC (UK) since March 2, 2009, excludes US $ 380.00 million since September 16, 2011,
excludes US $ 550 million since March 9, 2012 and excludes US $ 673 million since March 30, 2012 (as also its equivalent value in Indian Rupee).
# Includes ` 314.63 billion ( US$ 6,699 million) reflecting the purchase of 200 metric tonnes of gold from IMF on November 3, 2009.
## Includes SDRs 3,082.5 million allocated under general allocation and SDRs 214.6 million allocated under special allocation by the IMF done on August 28, 2009 and September 9, 2009, respectively. |
 |
|