(` Billion) |
March 31/
reporting
Fridays of
the month/last
reporting Friday
of the month |
Currency with the Public |
Deposit Money of the Public |
M1 (5+8) |
Post
Office
Saving
Bank
Depo sits |
M2 (9+10) |
Time
Deposits
with
Banks |
M3 (9+12) |
Total
Post
Office
Depo sits |
M4(13+14) |
Notes
in
Circula tion (1) |
Circulation of |
Cash
on
Hand
with
Banks |
Total
(1+2+3-4) |
Demand
Deposits
with
Banks |
‘Other’
Deposits
with
Reserve
Bank (3) |
Total
(6+7) |
Rupee
Coins
(2) |
Small
Coins
(2) |
| |
1 |
2 |
3 |
4 |
5 |
6 |
7 |
8 |
9 |
10 |
11 |
12 |
13 |
14 |
15 |
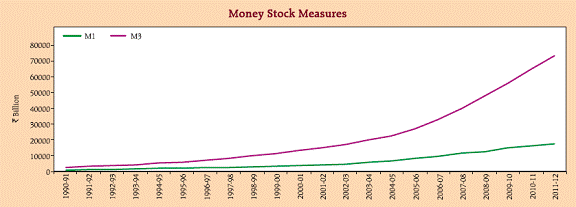
2009-10 |
7,882.8 |
97.0 |
15.7 |
320.6 |
7,674.9 |
7,179.7 |
38.1 |
7,217.8 |
14,892.7 |
50.4 |
14,943.1 |
41,134.3 |
56,027.0 |
259.7 |
56,286.7 |
2010-11 |
9,369.4 |
111.6 |
15.7 |
378.2 |
9,118.4 |
7,228.6 |
36.5 |
7,265.1 |
16,383.5 |
50.4 |
16,433.9 |
48,657.7 |
65,041.2 |
259.7 |
65,300.9 |
2011-12 |
10,537.9 |
125.4 |
15.7 |
413.0 |
10,266.0 |
7,002.1 |
30.6 |
7,032.7 |
17,298.7 |
50.4 |
17,349.1 |
56,142.0 |
73,440.7 |
259.7 |
73,700.4 |
May 6, 2011 |
9,818.4 |
112.7 |
15.7 |
365.9 |
9,580.8 |
6,522.4 |
29.4 |
6,551.8 |
16,132.7 |
50.4 |
16,183.1 |
50,430.3 |
66,563.0 |
259.7 |
66,822.7 |
May 20, 2011 |
9,875.4 |
113.9 |
15.7 |
390.9 |
9,614.1 |
6,420.9 |
29.8 |
6,450.7 |
16,064.8 |
50.4 |
16,115.2 |
50,650.1 |
66,715.0 |
259.7 |
66,974.6 |
January
2012 |
10,245.7 |
124.2 |
15.7 |
424.0 |
9,961.7 |
6,725.0 |
26.6 |
6,751.6 |
16,713.3 |
50.4 |
16,763.7 |
55,060.0 |
71,773.3 |
259.7 |
72,033.0 |
February
2012 |
10,433.7 |
125.4 |
15.7 |
417.2 |
10,157.6 |
6,736.8 |
10.9 |
6,747.7 |
16,905.3 |
50.4 |
16,955.7 |
55,500.6 |
72,405.9 |
259.7 |
72,665.6 |
March
2012 |
10,537.9 |
125.4 |
15.7 |
413.0 |
10,266.0 |
7,002.1 |
30.6 |
7,032.7 |
17,298.7 |
50.4 |
17,349.1 |
56,142.0 |
73,440.7 |
259.7 |
73,700.4 |
April
2012 |
10,946.6 |
125.4 |
15.7 |
427.3 |
10,660.4 |
6,776.5 |
14.8 |
6,791.2 |
17,451.6 |
50.4 |
17,502.1 |
57,676.3 |
75,128.0 |
259.7 |
75,387.6 |
May
4, 2012 |
11,014.8 |
125.4 |
15.7 |
440.8 |
10,715.1 |
6,812.9 |
17.1 |
6,830.0 |
17,545.1 |
50.4 |
17,595.5 |
57,927.1 |
75,472.1 |
259.7 |
75,731.8 |
May
18, 2012 |
11,133.4 |
125.4 |
15.7 |
440.3 |
10,834.1 |
6,580.2 |
12.9 |
6,593.1 |
17,427.2 |
50.4 |
17,477.6 |
58,141.1 |
75,568.3 |
259.7 |
75,828.0 |
Note: Monetary aggregates as at end-March incorporate data on i) scheduled commercial banks as on last reporting Friday and ii) the Reserve Bank of
India pertaining to the last working day of the fiscal year.
Data are provisional.
Also see Notes on Tables. |
 |