Spillovers from high global food, energy and other commodity prices and volatile international financial market movements exerted upward pressures on domestic inflation during 2022-23. Monetary policy remained focused on containing inflation and anchoring inflation expectations. The policy repo rate was raised by a cumulative 250 basis points with the stance shifting to withdrawal of accommodation. Surplus liquidity moderated in consonance with the policy stance and banks’ deposit and lending rates as well as market interest rates moved higher during the year. III.1 The war in Ukraine that started in February 2022 triggered a surge in global food, fuel and other commodity prices and supply chain disruptions. The volatility in international financial markets resulting from the aggressive tightening of monetary policy amplified upward pressures on domestic consumer price inflation (CPI), pulling it above the upper tolerance band. Against this backdrop, the conduct of monetary policy during 2022-23 assigned primacy to price stability. The policy repo rate was increased cumulatively by 250 basis points (bps) during 2022-23 to anchor inflation expectations, break the persistence in core inflation and contain the second-round effects of adverse supply shocks. The monetary policy stance shifted to withdrawal of accommodation to ensure that inflation remains within the target going forward, while supporting growth. III.2 In its liquidity management operations in support of the monetary policy stance, the Reserve Bank activated the standing deposit facility (SDF) in April 2022 at 25 bps below the repo rate as the new floor of the liquidity adjustment facility (LAF) corridor. The width of the corridor was thus restored to its pre-pandemic configuration of 50 bps. Surplus liquidity moderated during the year and the Reserve Bank conducted variable rate repo (VRR) auctions on occasions to mitigate frictional liquidity pressures. Banks’ deposit and lending rates as well as other market rates increased in tandem with the policy repo rate. The mandated external benchmark regime introduced in October 2019 for loan pricing in select sectors strengthened the pace of monetary transmission. III.3 Against the above backdrop, section 2 presents the implementation status of the agenda set for 2022-23 along with major developments during the year, while section 3 sets out the agenda for 2023-24. Concluding observations are given in the last section. 2. Agenda for 2022-23 III.4 In last year’s Annual Report, the Department had set out the following goals for 2022-23: -
An economy-wide credit conditions index and an analysis of its relationship with key macroeconomic variables (Paragraph III.5); -
Evaluation of drivers of inflation expectations (Paragraph III.5); and -
A study of the investment behaviour of corporates/firms to understand constraints on investment (Paragraph III.5). Implementation Status III.5 In pursuance of the goals set for 2022-23, an economy-wide credit conditions index was constructed using the loan sanctioning data. Analysis was done on inflation expectations anchoring as well as inflation’s ascent in India during the pandemic. In addition, studies were undertaken to assess monetary policy trade-offs in the face of supply shocks and the impact of financial conditions on corporate investment. The sensitivity of output prices to input costs as well as the interlinkage between rural prices and wages were examined. The information content of market expectations from the yield curve and monetary transmission were the other focus areas. Major Developments Monetary Policy III.6 The monetary policy committee’s (MPC’s) first meeting for 2022-23 was held in April 2022 in an environment of heightened geopolitical tensions due to the war in Ukraine, a generalised hardening of global commodity prices, supply chain disruptions, and volatility in global financial markets. Considering elevated input cost pressures, assuming a normal monsoon in 2022 and an average crude oil price (Indian basket) of US$ 100 per barrel, the inflation projection for 2022-23 was revised up from 4.5 per cent in the February 2022 policy to 5.7 per cent. Real gross domestic product (GDP) growth for 2022-23 was revised down from 7.8 per cent to 7.2 per cent. Given the evolving risks and uncertainties, the MPC unanimously changed the monetary policy stance from accommodative to withdrawal of accommodation to ensure that inflation remains within the target going forward, while supporting growth. The MPC unanimously decided to keep the policy repo rate unchanged at 4 per cent. The Reserve Bank instituted the SDF at 40 bps above the prevailing fixed rate reverse repo to strengthen the operating framework of monetary policy. III.7 As the war progressed, inflationary pressures turned acute due to elevated commodity prices, supply dislocations and volatility in financial markets. There was a spike in the headline CPI inflation print for March 2022 (released on April 12). With economic activity exhibiting resilience and significant upside risks to the inflation trajectory, the MPC in an off-cycle meeting on May 2 and 4, 2022 unanimously voted to increase the policy repo rate by 40 bps to 4.40 per cent to anchor inflation expectations and contain the second-round effects of supply shocks. The MPC also unanimously decided to continue with the stance set out in the April resolution. Concomitantly, the Reserve Bank raised the cash reserve ratio (CRR) by 50 bps to 4.5 per cent of net demand and time liabilities (NDTL) to absorb surplus liquidity (Box III.1). III.8 By June 2022, the global economy was grappling with multi-decadal high inflation amidst elevated crude oil prices and lingering supply chain bottlenecks. Domestic CPI inflation rose to 7.8 per cent in April 2022, breaching the upper tolerance level for the fourth consecutive month. Taking into account the elevated commodity and crude oil prices and the pass-through to output prices, the inflation projection was revised up to 6.7 per cent for 2022-23. In order to keep inflation expectations anchored and to restrain the broadening of price pressures, the MPC unanimously raised the policy rate by 50 bps. III.9 When the MPC met in August 2022, CPI headline inflation had persisted above the upper tolerance band, notwithstanding some easing to 7.0 per cent during May-June 2022. With an assumption of the average crude oil price (Indian basket) at US$ 105 per barrel, the inflation projection was retained at 6.7 per cent in 2022-23, with Q2 at 7.1 per cent; Q3 at 6.4 per cent and Q4 at 5.8 per cent. For Q1:2023-24, inflation was projected at 5.0 per cent. Real GDP growth projection for 2022-23 was retained at 7.2 per cent. Given the elevated level of inflation and the resilience of domestic economic activity, the MPC noted that further calibrated monetary policy action was needed. Accordingly, the MPC unanimously decided to increase the policy repo rate by 50 bps to 5.4 per cent. It continued with the withdrawal of accommodation stance with a 5-1 vote. Box III.1
Reserve Requirements and Monetary Policy Since the 1990s, policy interest rates have emerged as the key instrument for the conduct of monetary policy across central banks. The use of cash reserve requirements has accordingly diminished. Nonetheless, reserve ratios remain an important countercyclical instrument for fostering monetary and financial stability in major emerging market economies (EMEs) [Cordella et. al., 2014]. Following the outbreak of the COVID-19 pandemic in India, the cash reserve ratio (CRR) was cut by 100 bps to 3.0 per cent of net demand and time liabilities (NDTL), releasing primary liquidity of around ₹1.37 lakh crore, to stabilise domestic financial markets and support the availability of credit in the economy. Major EMEs such as Brazil, China, Indonesia, Russia and Türkiye also reduced reserve requirements during the pandemic (Chart 1). In addition, exemptions from maintenance of reserve requirement have been used to incentivise sector specific/ targeted credit growth (Cantú et. al., 2021). For example, in 2020, the Reserve Bank provided exemptions from CRR maintenance for incremental retail loans for automobiles, residential housing and loans to micro, small and medium enterprises (MSMEs). Amongst other countries, Argentina reduced minimum reserve requirements for financial institutions extending loans to MSMEs and to health service providers for the purchase of supplies or medical equipment during the pandemic. In Brazil, reserve requirement exemptions were given for loans to small companies affected by the pandemic. In Türkiye, reserve requirement incentives have been provided to channel loan supply towards productive sectors rather than consumption. 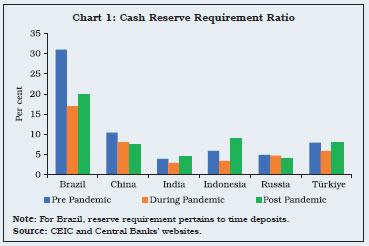 The CRR tool can also be deployed to modulate forex flows by tweaking the requirements on non-resident deposits - for example, the Reserve Bank exempted incremental Foreign Currency Non-Resident (Bank) [FCNR(B)] and Non-Resident (External) [NRE] deposits from the maintenance of CRR for the period July 1, 2022 to November 4, 2022 to attract forex inflows1. Following the conflict in Ukraine and the associated surge in inflation, a number of EME central banks supplemented their policy rate hikes with increases in CRR. In India, the start of the monetary tightening cycle was marked by a simultaneous increase in the policy rate and the CRR in May 2022. Overall, as the recent experience shows, reserve requirements remain a useful instrument in the monetary policy toolkit, used during both easing and tightening cycles. References: 1. Cantú, C., P. Cavallino, F. D. Fiore, and J. Yetman (2021), ‘A Global Database on Central Banks’ Monetary Responses to COVID-19’, BIS Working Paper no. 934. 2. Cordella T., P. Federico, C. Vegh, and G. Vuletin (2014), ‘Reserve Requirements in the Brave New Macroprudential World’, World Bank, April. | III.10 At the time of the September MPC meeting, CPI headline inflation was at 7.0 per cent in August - above the upper tolerance level. Domestic economic activity had gained traction, with real GDP rising by 13.5 per cent in Q1:2022-23 (y-o-y). In the MPC’s resolution, real GDP growth projection for 2022-23 was revised to 7.0 per cent. With core inflation remaining high and headline inflation likely to hover above the upper tolerance level, the MPC decided that further calibrated action was necessary to keep inflation expectations anchored, restrain the broadening of price pressures and pre-empt second-round effects. Accordingly, the MPC raised the policy repo rate by 50 bps to 5.9 per cent with a 5-1 vote. One member voted for a smaller increase of 35 bps. The MPC also decided by a majority of 5-1 to remain focused on withdrawal of accommodation. III.11 With the release of CPI inflation for September 2022 at 7.4 per cent on October 12, 2022, average inflation exceeded 6.0 per cent (the upper threshold around the target) for three consecutive quarters – Q4:2021-22 (6.3 per cent), Q1:2022-23 (7.3 per cent) and Q2 (7.0 per cent). In terms of the accountability norms mandated by legislation – Section 45ZN of the RBI Act, 1934 and Regulation 7 of RBI MPC and Monetary Policy Process Regulations, 2016 – a meeting of the MPC was held on November 3, 2022 and a report was sent to the central government by the Reserve Bank. III.12 Inflation moderated to 6.8 per cent in October 2022 when the MPC met for its scheduled December 2022 meeting, driven by favourable base effects. Real GDP registered a growth of 6.3 per cent (y-o-y) in Q2:2022-23. With headwinds from protracted geopolitical tensions, tightening global financial conditions and slowing external demand, the real GDP growth projection for 2022-23 was revised to 6.8 per cent; and it was projected at 7.1 per cent for Q1:2023-24 and 5.9 per cent for Q2. Headline inflation was projected at 6.6 per cent for Q3:2022-23, 5.9 per cent for Q4, 5.0 per cent for Q1:2023-24 and 5.4 per cent for Q2. The MPC observed that while headline inflation was likely to moderate in H1:2023-24, it would still be well above the target. Meanwhile, economic activity had held up well and was expected to remain resilient. The MPC judged that the impact of monetary policy measures undertaken needed to be monitored carefully. On balance, the MPC observed the need for further calibrated monetary policy action and decided to increase the policy repo rate by 35 bps to 6.25 per cent with a 5-1 vote. The MPC also decided by a 4-2 vote to continue with the stance focused on withdrawal of accommodation. III.13 At the time of its February 2023 meeting, CPI headline inflation had eased to 5.7 per cent (y-o-y) in December, driven by sharper and earlier-than-expected decline in vegetable prices, even as core inflation remained sticky and above 6 per cent. The MPC noted that the outlook for inflation was surrounded by uncertainties linked to sustained geopolitical tensions, upward pressures on commodity prices due to easing up of mobility restrictions, coupled with ongoing pass-through from input costs to output prices, especially in services. Taking into account these factors and with an assumption of average crude oil price (Indian basket) of US$ 95 per barrel, inflation was projected at 6.5 per cent in 2022-23, with Q4 at 5.7 per cent. On the assumption of a normal monsoon, CPI inflation was projected at 5.3 per cent for 2023-24, with Q1 at 5.0 per cent, Q2 and Q3 at 5.4 per cent and Q4 at 5.6 per cent, with risks evenly balanced. Economic activity continued to exhibit resilience – real GDP growth for 2023-24 was projected at 6.4 per cent with Q1 at 7.8 per cent, Q2 at 6.2 per cent, Q3 at 6.0 per cent and Q4 at 5.8 per cent, and risks broadly balanced. The MPC judged that elevated inflation remained a major risk to the outlook and was of the view that further calibrated monetary policy action was warranted to keep inflation expectations anchored, break core inflation persistence and thereby strengthen medium-term growth prospects. Accordingly, the MPC increased the policy repo rate by 25 bps to 6.50 per cent and persisted with the withdrawal of accommodation, with a 4-2 vote for both the rate action and the stance decisions. The policy repo rate actions during 2022-23 were largely anticipated by the market, thereby strengthening the impact of monetary actions on the economy (Box III.2). Box III.2
Decoding Policy Expectations of Market Participants 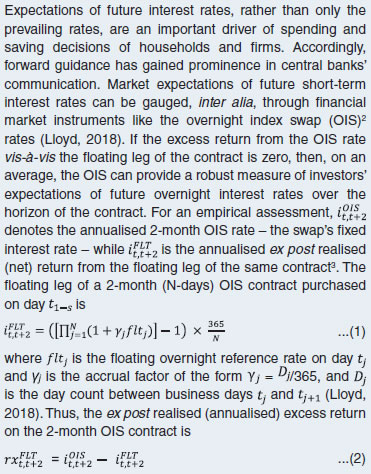 Under the expectations hypothesis, the fixed leg of the OIS contract equals the floating leg. This implies that the ex post realised excess return in (2) and hence the ex ante forecasting error have zero means. Under these circumstances, the 2-month OIS rate can provide a good measure of expected policy rate changes. For India, the average excess return over the period 2010 to 2019, controlled for episodes of market turmoil (e.g., taper tantrum) yields a zero mean, suggesting that monetary policy actions were well anticipated by the market. During the COVID-19 pandemic phase, there was a ‘surprise’ element in policy changes – the unanticipated component based on equation (2) – in the unscheduled meeting of the MPC on March 27, 2020 (Table 1). While the market was expecting a 50 bps rate cut, the surprise component was around 25 bps, given the actual reduction of 75 bps. In most of the subsequent policy announcements, market expectations were broadly in sync with policy decisions. In May 2022, the off-cycle policy rate hike of 40 bps took the market by surprise as evident from the average negative excess return (- 40 bps) prior to the policy. While the next two policies (June and August 2022) were on expected lines, the September 2022 policy decision entailed a surprise element of 15 bps as the market had priced in a hike of 35 bps as against the actual increase of 50 bps. The February 2023 rate hike of 25 bps was in line with the market anticipation. This analysis suggests that the Reserve Bank’s communication has been effective in anchoring market expectations. | Table 1: Average Excess Return | | (Basis points) | | Policy Date | Δ Policy Rate | Excess Return | | 1 | 2 | 3 | | 2020-21 | | March 27 | -75 | 24 | | May 22 | -40 | 0 | | August 6 | 0 | -7 | | October 9 | 0 | 12 | | December 4 | 0 | 8 | | February 5 | 0 | 4 | | 2021-22 | | April 7 | 0 | 3 | | June 4 | 0 | 5 | | August 6 | 0 | 6 | | October 8 | 0 | 4 | | December 8 | 0 | 7 | | February 10 | 0 | 17 | | 2022-23 | | April 8 | 0 | 0 | | May 4 | 40 | -40 | | June 8 | 50 | 2 | | August 5 | 50 | -1 | | September 30 | 50 | -15 | | December 7 | 35 | 12 | | February 8 | 25 | 0 | Note: Average excess returns are estimated based on OIS rates.
Source: RBI staff estimates. | Reference: Lloyd, S. (2018), ‘Overnight Index Swap Market-based Measures of Monetary Policy Expectations’, Bank of England Staff Working Paper no. 709. | III.14 Two black swan events – the pandemicand the war in Ukraine – in succession ledto globalisation of inflation in 2022, whichaccentuated inflation deviations from targets.4This necessitated aggressive monetary policytightening across economies – the third majorshock for the global economy since 20205(Chart III.1). III.15 The MPC’s decisions during 2022-23 were initially marked by unanimity on both rate actions and stance, but diversity characterised decision-making beginning August 2022 (stance) and September (repo rate action) amidst increasing uncertainty on the outlook (Chart III.2). The Operating Framework: Liquidity Management III.16 Amidst growing inflation risks and a shift in the monetary policy stance towards withdrawal of accommodation, as noted earlier, the SDF was institutionalised at 40 bps above the fixed rate reverse repo (FRRR) in April 2022. The SDF replaced the FRRR as the floor of the LAF corridor and the SDF rate was set at 25 bps below the repo rate. The marginal standing facility (MSF) rate was retained at 25 bps above the policy repo rate, making the LAF corridor symmetric around the policy repo rate and restoring the width of the corridor to its pre-pandemic configuration of 50 bps. Although the SDF window is applicable on overnight deposits, the Reserve Bank retains the flexibility to absorb liquidity of longer tenors, if necessary, with appropriate pricing. With the institution of the SDF, the fixed reverse repo rate, retained at 3.35 per cent, was delinked from the policy repo rate. The FRRR remains a part of the Reserve Bank’s toolkit and can be used at the Reserve Bank’s discretion. Access to the SDF (like the MSF) is at the discretion of banks, unlike repo/ reverse repo, open market operation (OMO) and CRR, which are at the discretion of the Reserve Bank. By removing the collateral constraint, the SDF has strengthened the operating framework of monetary policy; moreover, it is also a financial stability tool in addition to its role in liquidity management. Furthermore, the Reserve Bank increased the CRR by 50 bps to 4.5 per cent (effective fortnight beginning May 21, 2022), withdrawing primary liquidity to the tune of ₹87,000 crore from the banking system, consistent with the shift in monetary policy stance towards withdrawal of accommodation. 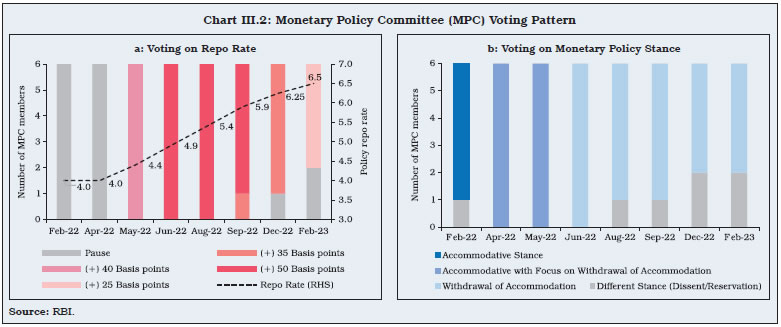 Drivers and Management of Liquidity III.17 Currency demand by the public, volatile capital flows and swings in government cash balances were the major drivers of liquidity during 2022-23. In Q1:2022-23, the build-up of government cash balances and currency demand resulted in liquidity drainage (Table III.1). In terms of management, OMO sales and the increase in CRR also drained surplus liquidity in consonance with the monetary policy stance. During Q2, the Reserve Bank’s forex sales amidst turbulent global financial markets mopped up rupee liquidity. This was partially offset by the drawdown of government cash balances and the usual return of currency to the banking system during the monsoon season. In Q3, festival season currency demand and the build-up of government cash balances reduced surplus liquidity while capital inflows and drawdown of excess reserves partially ameliorated liquidity pressures. Thereafter, drawdown in government cash balances and excess reserves in Q4 partially offset liquidity withdrawal due to leakage from currency in circulation and net forex sales. Further, currency demand declined sequentially in H1:2022-23 but stabilised thereafter in H2 (Chart III.3). Overall, the average daily net absorptions under the LAF declined sharply from ₹6.6 lakh crore in March 2022 to ₹0.14 lakh crore in March 2023. | Table III.1: Liquidity – Key Drivers and Management | | (₹ crore) | | Item | 2021-22 | 2022-23* | Q1:2022-23 | Q2:2022-23 | Q3:2022-23 | Q4:2022-23* | | 1 | 2 | 3 | 4 | 5 | 6 | 7 | | Drivers | | (i) CiC [withdrawal (-) /return (+)] | -2,79,953 | -2,46,702 | -83,887 | 59,283 | -74,331 | -1,47,766 | | (ii) Net Forex Purchases (+)/ Sales (-) | 1,34,629 | -2,23,165 | 16,159 | -2,89,713 | 53,147 | -2,758 | | (iii) GoI Cash Balances [build-up (-) / drawdown (+)] | 1,97,220 | -1,71,400 | -2,64,512 | 64,651 | -1,589 | 30,050 | | (iv) Excess Reserves [build-up (-) / drawdown (+)] | -43,729 | 1,69,808 | 1,50,165 | -54,446 | 26,944 | 47,145 | | Management | | (i) Net OMO Purchases (+)/ Sales (-) | 2,13,976 | -31,360 | -6,620 | -14,460 | -10,280 | 0 | | (ii) Required Reserves [including both change in NDTL and CRR] | 1,28,155 | -1,56,083 | -1,03,054 | -13,946 | -23,643 | -15,440 | | Memo Items: | | Average Daily Net Absorption during the Period | 6,71,285 | 1,87,156 | 4,99,919 | 1,64,699 | 55,967 | 27,978 | CiC: Currency in Circulation. GoI: Government of India.
*: Data for Q4 are up to March 24, 2023.
Note: Inflow (+)/Outflow (-) to and from the banking system.
Source: RBI. | III.18 The daily absorption under the SDF during 2022-23 averaged ₹1.5 lakh crore, while the amount absorbed through variable rate reverse repo auctions (both main and fine-tuning operations) averaged ₹1.4 lakh crore (Chart III.4a). In view of the ebbing liquidity surplus, banks’ appetite to park funds with the Reserve Bank for a longer period waned and the amount absorbed through the variable rate reverse repo auctions declined to 8.5 per cent of the total absorption in March 2023 from 69.3 per cent in March 2022. In order to mitigate frictional liquidity pressures from the goods and services tax (GST) payments, advance tax outflows and usual year-end tightness, the Reserve Bank conducted three variable rate repo (VRR) auctions during 2022-23 – ₹50,000 crore each of 3 days and overnight maturity on July 26 and September 22, 2022, respectively, and ₹75,000 crore of 5 days maturity on March 24, 2023. Banks occasionally took recourse to the MSF to meet their liquidity requirements. While the MSF borrowings touched a high of ₹65,646 crore on October 24, 2022, the daily recourse to MSF averaged ₹5,936 crore during 2022-23. The Reserve Bank conducted two 14-day VRR auctions as the main operation in February and March 2023. An amount of ₹5,000 crore was also made available to standalone primary dealers (SPDs) under the standing liquidity facility (SLF) on March 31, 2023 at the prevailing repo rate. Overall, the net LAF generally remained in absorption mode (barring some intermittent periods), averaging ₹1.9 lakh crore during 2022-23 as compared with ₹6.7 lakh crore in 2021-22. 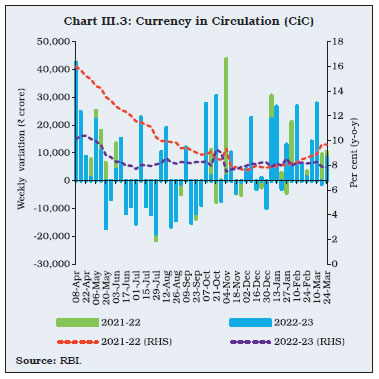
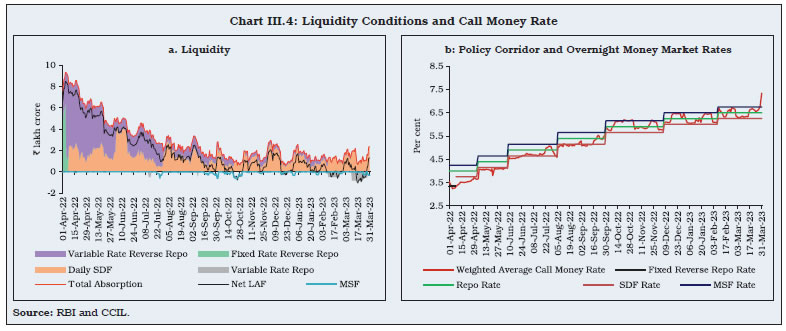 III.19 With the shift in the monetary policy stance, the weighted average call rate (WACR) moved from below the fixed reverse repo rate in early April 2022 towards the policy repo rate over the course of 2022-23. Specifically, the WACR traded 3 bps above the policy repo rate (on an average) in H2:2022-23 in contrast to being 27 bps below in H1. Transient liquidity tightness caused the WACR to breach the MSF rate – the upper band of the LAF corridor – occasionally in Q3 and Q4. The WACR hardened to 7.34 per cent on March 31, 2023 on account of year-end balance sheet considerations (Chart III.4b). III.20 Money market interest rates rose broadly in tandem with the policy repo rate hikes and the decline in surplus liquidity during 2022-23 (Table III.2). Medium to long term bond yields were also sizeably influenced by global cues. | Table III.2: Interest Rates | | (Per cent) | | Indicator | Average for | | Mar-2022 | Jun-2022 | Sep-2022 | Mar-2023 | | 1 | | 2 | 3 | 4 | 5 | | Rates | WACR | 3.32 | 4.49 | 5.30 | 6.52 | | | Tri-party Repo | 3.41 | 4.51 | 5.41 | 6.47 | | | Market Repo | 3.42 | 4.50 | 5.40 | 6.55 | | | 3-Month T-Bill | 3.79 | 5.02 | 5.79 | 6.88 | | | 3-Month CP | 4.34 | 5.46 | 6.27 | 7.75 | | | 3-Month CD | 4.01 | 5.21 | 6.10 | 7.48 | | | AAA Corporate Bond - 5-year | 6.48 | 7.59 | 7.43 | 7.85 | | | G-Sec Yield - 5-year | 6.38 | 7.29 | 7.15 | 7.28 | | | G-Sec Yield - 10-year | 6.83 | 7.49 | 7.23 | 7.35 | | Spreads (bps) | CP - T-Bill | 59 | 55 | 68 | 90 | | AAA 5-year - G-Sec 5-year | 10 | 30 | 28 | 57 | | Memo Items: | | | | | | | Liquidity | Net LAF (₹ crore) | 6,61,027 | 3,37,597 | 1,02,757 | 14,185 | | Global Indicators | US 10-year G-sec (Per cent) | 2.14 | 3.13 | 3.51 | 3.66 | | | Crude Oil Price (Indian basket) (US $ per barrel) | 114 | 116 | 91 | 79 | | Source: CCIL, RBI and Bloomberg. | Other Policy Measures III.21 In order to enable banks to better manage their investment portfolio during 2022-23, the Reserve Bank enhanced the limit under Held to Maturity (HTM) category from 22 per cent to 23 per cent of NDTL till March 31, 2023 in April 2022 and subsequently up to March 31, 2024 in December. It was also decided to allow banks to include eligible SLR securities acquired between September 1, 2020 and March 31, 2024 under this enhanced limit. The HTM limits are set to be restored from 23 per cent to 19.5 per cent in a phased manner starting from the quarter ending June 30, 2024. In view of the moderation in surplus liquidity, the Reserve Bank announced merger of the 28-day VRRR with the fortnightly 14-day main auction in the September policy. As part of the calibrated move towards normal liquidity operations, market hours were restored – from 9.00 am to 5.00 pm – in respect of call/notice/term money, commercial paper, certificates of deposit and repo in corporate bond segments of the money market as well as for rupee interest rate derivatives in December 2022, and for the government securities market from February 2023. Monetary Policy Transmission III.22 Banks’ deposit and lending rates increased in 2022-23 in tandem with the policy repo rate. In response to the 250 bps increase in the policy repo rate in 2022-23, banks raised their external benchmark-based lending rate (EBLR) upwards by the same magnitude, which strengthened the pace of transmission. The 1-year median marginal cost of funds-based lending rate (MCLR) of banks moved higher by 150 bps in 2022-23. The weighted average lending rates (WALRs) on outstanding and fresh rupee loans increased by 98 bps and 169 bps, respectively, in 2022-23 (Table III.3). III.23 Amidst the moderation in surplus liquidity and strong credit demand, the weighted average domestic term deposit rate (WADTDR) on fresh deposits (including retail and bulk deposits) increased by 236 bps in 2022-23. The increase in term deposit rates was initially led by adjustments in bulk deposit rates (Chart III.5). The pass-through to retail term deposit rates jumped in H2:2022-23; the WADTDR on retail term deposits rose by 126 bps during October 2022-March 2023 as compared with an increase of 48 bps in H1. The weighted average savings deposit rate, however, remained broadly unchanged during 2022-23. | Table III.3: Transmission from the Policy Repo Rate to Deposit and Lending Rates of SCBs | | (Variation in basis points) | | Period (April-March) | Repo Rate | Term Deposit Rates | Lending Rates | | WADTDR – Fresh Deposits | WADTDR – Outstanding Deposits | 1-year MCLR (Median) | EBLR | WALR – Fresh Rupee Loans | WALR – Outstanding Rupee Loans | | 1 | 2 | 3 | 4 | 5 | 6 | 7 | 8 | | 2020-21 | -40 | -159 | -110 | -90 | -115@ | -78 | -82 | | 2021-22 | 0 | 27 | -25 | -5 | 0 | -29 | -36 | | 2022-23 | +250 | 236 | 113 | 150 | 250 | 169 | 98 | | Memo Items: | | February 2019 to March 2022 (Easing Cycle) | -250 | -259 | -188 | -155 | - | -232 | -150 | | May 2022 to March 2023 (Tightening Cycle) | +250 | 245 | 113 | 140 | 250 | 181 | 100 | SCBs: Scheduled Commercial Banks. WADTDR: Weighted Average Domestic Term Deposit Rate. WALR: Weighted Average Lending Rate. MCLR: Marginal Cost of Funds-based Lending Rate. EBLR: External Benchmark-based Lending Rate. -:Nil.
@ : Includes the impact of repo rate cut of 75 bps on March 27, 2020.
Note: Data on EBLR pertain to domestic banks.
Source: Special Monthly Return VIAB, RBI, and RBI staff estimates. |
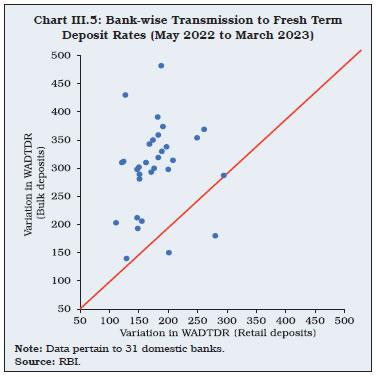 III.24 Across bank groups, the increase in WALRs on fresh loans was higher in the case of public sector banks (PSBs) relative to private banks (PVBs). The transmission to WADTDR on outstanding deposits and WALR on outstanding loans was relatively more for PVBs (Chart III.6). The transmission was the highest in the case of foreign banks, facilitated by low cost and lower duration deposits which enabled them to make quick adjustments in response to policy rate changes. III.25 The mandated external benchmark regime introduced in October 2019 for loan pricing in select sectors has strengthened the pace of monetary transmission. The proportion of outstanding floating rate loans linked to external benchmarks increased from 9.1 per cent in March 2020 to 48.3 per cent in December 2022 and these loans have now the largest share in total floating rate loans. Concurrently, the share of the MCLR-linked loans fell from 78.3 per cent to 46.1 per cent over the same period (Table III.4). III.26 In case of loans linked to the policy repo rate, the spread in respect of fresh rupee loans (i.e., WALR over the repo rate) was the highest for education loans, followed by other personal loans (Table III.5). Among the domestic bank groups, the spreads charged by PSBs for vehicle, education, and other personal loans were lower than those of PVBs while for housing and MSME loans, the spreads charged by PVBs were lower than those of PSBs.
| Table III.4: Outstanding Floating Rate Rupee Loans of SCBs across Interest Rate Benchmarks | | (Per cent to total) | | Month | Base Rate | MCLR | EBLR | Others | Total | | 1 | 2 | 3 | 4 | 5 | 6 | | March 2020 | 10.3 | 78.3 | 9.1 | 2.3 | 100.0 | | March 2021 | 6.4 | 62.3 | 29.5 | 1.8 | 100.0 | | March 2022 | 4.9 | 48.6 | 44.0 | 2.5 | 100.0 | | December 2022 | 3.4 | 46.1 | 48.3 | 2.2 | 100.0 | Note: Data pertain to 73 scheduled commercial banks.
Source: RBI. |
| Table III.5: Loans linked to External Benchmark – Spread of WALR (Fresh Rupee Loans) over Repo Rate (March 2023) | | (Percentage points) | | Bank Group | Personal Loan | MSME Loans | | Housing | Vehicle | Education | Other Personal Loans | | 1 | 2 | 3 | 4 | 5 | 6 | | Public Sector Banks | 2.57 | 2.71 | 3.90 | 3.13 | 3.64 | | Private Sector Banks | 2.49 | 3.47 | 4.82 | 6.22 | 3.07 | | Domestic Banks | 2.52 | 3.08 | 4.21 | 3.78 | 3.26 | | Source: RBI. | Sectoral Lending Rates III.27 The WALR on fresh loans rose by around 201 bps for housing and 152 bps for education sectors, 179 bps for industry (large), and 118 bps for MSMEs in 2022-23 (Table III.6). | Table III.6: Sector-wise WALR of SCBs (Excluding RRBs) - Fresh Rupee Loans | | (Per cent) | | End-Month | Agriculture | Industry (Large) | MSMEs | Infrastructure | Trade | Professional Services | Personal Loans | Rupee Export Credit | | Housing | Vehicle | Education | Credit Card | Others$ | | 1 | 2 | 3 | 4 | 5 | 6 | 7 | 8 | 9 | 10 | 11 | 12 | 13 | | Mar-20 | 9.66 | 8.51 | 10.37 | 8.18 | 7.38 | 8.89 | 8.73 | 9.91 | 11.04 | 36.81 | 8.24 | 6.57 | | Mar-21 | 9.98 | 7.12 | 8.90 | 7.50 | 7.31 | 7.52 | 7.15 | 9.27 | 8.97 | 36.04 | 8.37 | 6.21 | | Mar-22 | 9.06 | 6.55 | 8.66 | 7.09 | 7.36 | 7.68 | 7.01 | 8.85 | 8.74 | 36.04 | 7.64 | 5.53 | | Jun-22 | 8.97 | 6.87 | 8.81 | 7.12 | 7.28 | 7.68 | 7.60 | 8.36 | 9.27 | 34.15 | 7.51 | 6.10 | | Sep-22 | 9.42 | 7.37 | 9.46 | 7.46 | 8.06 | 8.25 | 7.99 | 8.93 | 9.86 | 36.77 | 9.39 | 6.79 | | Dec-22 | 9.62 | 7.78 | 9.41 | 7.96 | 8.63 | 8.49 | 8.62 | 9.83 | 10.17 | 34.31 | 8.84 | 7.51 | | Mar-23 | 10.12 | 8.34 | 9.84 | 8.56 | 8.87 | 8.80 | 9.02 | 10.47 | 10.26 | 37.06 | 9.22 | 8.09 | | Variation (Percentage Points) | | 2021-22 | -0.92 | -0.57 | -0.24 | -0.41 | 0.05 | 0.16 | -0.14 | -0.42 | -0.23 | 0 | -0.73 | -0.68 | | 2022-23 | 1.06 | 1.79 | 1.18 | 1.47 | 1.51 | 1.12 | 2.01 | 1.62 | 1.52 | 1.02 | 1.58 | 2.56 | $: Other than housing, vehicle, education, and credit card loans.
Source: RBI. |
| Table III.7: Sector-wise WALR of SCBs (Excluding RRBs) - Outstanding Rupee Loans | | (Per cent) | | End-Month | Agriculture | Industry (Large) | MSMEs | Infrastructure | Trade | Professional Services | Personal Loans | Rupee Export Credit | | Housing | Vehicle | Education | Credit Card | Others$ | | 1 | 2 | 3 | 4 | 5 | 6 | 7 | 8 | 9 | 10 | 11 | 12 | 13 | | Mar-20 | 10.07 | 9.22 | 10.51 | 9.67 | 8.92 | 9.90 | 8.59 | 10.01 | 10.53 | 28.90 | 9.40 | 7.31 | | Mar-21 | 9.68 | 8.27 | 9.73 | 8.87 | 8.51 | 8.44 | 7.55 | 9.59 | 9.47 | 31.90 | 8.79 | 6.76 | | Mar-22 | 9.35 | 7.76 | 9.28 | 8.31 | 8.14 | 8.11 | 7.46 | 9.06 | 9.30 | 30.51 | 8.16 | 6.55 | | Jun-22 | 9.35 | 7.89 | 9.33 | 8.38 | 8.38 | 8.30 | 7.74 | 9.11 | 9.44 | 30.23 | 8.52 | 6.78 | | Sep-22 | 9.47 | 8.21 | 9.77 | 8.70 | 8.75 | 9.09 | 8.20 | 9.21 | 9.74 | 29.48 | 8.64 | 7.12 | | Dec-22 | 9.63 | 8.54 | 10.10 | 8.81 | 9.24 | 9.12 | 8.67 | 9.39 | 10.07 | 30.26 | 8.86 | 7.42 | | Mar-23 | 9.84 | 8.78 | 10.28 | 8.96 | 9.49 | 9.29 | 8.86 | 9.36 | 10.20 | 30.44 | 9.19 | 7.71 | | Variation (Percentage Points) | | 2021-22 | -0.33 | -0.51 | -0.45 | -0.56 | -0.37 | -0.33 | -0.09 | -0.53 | -0.17 | -1.39 | -0.63 | -0.21 | | 2022-23 | 0.49 | 1.02 | 1.00 | 0.65 | 1.35 | 1.18 | 1.40 | 0.30 | 0.90 | 0.23 | -0.07 | 1.16 | $: Other than housing, vehicle, education, and credit card loans.
Source: RBI. | III.28 In the case of outstanding loans, the WALR increased by 140 bps for housing, 102 bps for industry (large), and 100 bps for MSMEs during 2022-23 (Table III.7). Despite the increase in 2022-23, the WALRs in most sectors are below their levels in March 2020. 3. Agenda for 2023-24 III.29 The Department would support the conduct and formulation of monetary policy with high quality analysis of evolving macro-financial developments, constant reassessment of the outlook for inflation and growth, forecasting and analysis of liquidity conditions and assessment of credit conditions with a special focus on sectoral flows. Against this backdrop, the Department would undertake the following new initiatives during 2023-24: -
Use machine learning (ML) techniques for improving nowcasting and forecasting of GDP (Utkarsh 2.0); -
With non-banking financial companies (NBFCs) constituting an increasingly important segment of the Indian financial system, the Department plans to strengthen the analysis of transmission to lending rates and sectoral credit flows by expanding the coverage to include NBFCs in addition to banks in a phased manner (Utkarsh 2.0); and -
A review of the working of the external benchmark system for loans to strengthen monetary transmission (Utkarsh 2.0). 4. Conclusion III.30 The conduct of monetary policy in 2022-23 was conditioned by an abrupt change in the inflation outlook following the war in Ukraine. This was amplified by aggressive monetary policy tightening by major central banks. In India, inflationary pressures caused monetary policy to shift focus to inflation management. It raised the repo rate cumulatively by 250 bps during 2022-23 and changed the policy stance to withdrawal of accommodation. Surplus liquidity moderated through the year, and the operating procedure of monetary policy was strengthened with the introduction of the SDF. Bank deposit and lending rates as well as market rates rose, reflecting the combined impact of higher policy rate and the reduction in the size of surplus liquidity. III.31 Looking ahead, the conduct of monetary policy will continue to be guided by the objective of achieving the medium-term target for CPI inflation of 4 per cent within a band of +/- 2 per cent, while supporting growth. The Reserve Bank will undertake liquidity management operations in sync with the monetary policy stance and taking into account the needs of the productive sectors of the economy.
|