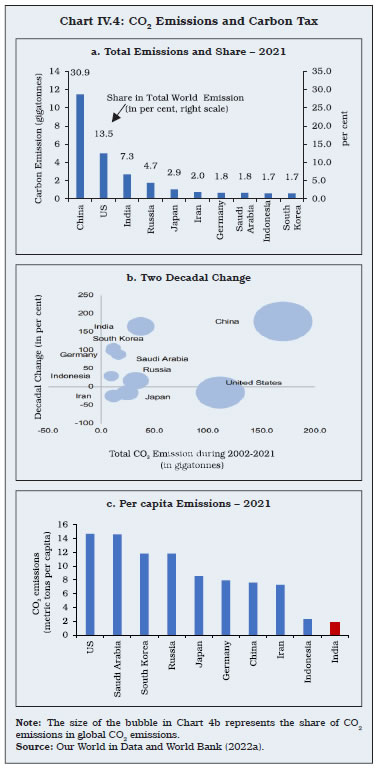
The enormous scale of the green transition challenge and the colossal cost of delayed policy actions warrant a comprehensive decarbonisation strategy, encompassing all carbon emitting sectors of the economy and all available policy levers – fiscal, technology, regulatory, trade and monetary. The policy mix needs to strike the right balance between a carbon tax, technology support for non-fossil fuel, green hydrogen, carbon capture and storage, standards for energy efficiency, regulatory tweaks incentivising flow of adequate resources for green projects and adoption of energy saving appliances at home and in business establishments. Estimates suggest that compared with a no policy action scenario that could increase India’s carbon emissions to 3.9 gigatonnes by 2030 (from 2.7 gigatonnes in 2021), a balanced policy intervention can lower carbon emissions to 0.9 gigatonne by 2030. 1. Introduction IV.1 A successful transition to a net zero economy would require a strategy of “deep decarbonisation” encompassing all carbon emitting sectors, ranging from power generation and transportation to industrial production processes, construction activity, agriculture, and above all, nudging the citizens to change their lifestyle habits and consumption preferences. India’s emphasis on the Mission LiFE (Lifestyle for Environment) aims at making individuals adopt sustainable lifestyles to minimise carbon footprints. Even as firms and households have progressively been adopting greener business practices and lifestyle changes, the enormous scale of the transition challenge and the colossal cost of delayed actions warrant comprehensive policy interventions using all feasible options as an integral part of the country’s decarbonisation strategy. India already has a long-term low-carbon development strategy in place (MoEFCC, 2022), which sets out clearly the country’s envisaged multi-pronged climate action plans. International experience and emerging risk mitigating policy options, however, suggest that the strategy may have to be dynamic to be effective, and there must be an unwavering commitment displayed through timely actions to achieve the net zero target. IV.2 An effective strategy would first need to recognise the dimension of the challenge. Of the current annual carbon emissions in India, about 40 per cent could be addressed by replacing fossil fuels with renewables, another 15 per cent by switching over to electric vehicles (EVs) and energy efficient electrical appliances in residences and business establishments. The remaining 45 per cent, however, relate to hard-to-abate sectors, viz., heavy industries, animal husbandry and agriculture (Mony, 2022). They are hard to abate because either technology to support the green transition is not available or the cost is prohibitive. A business-as-usual scenario can only increase the annual absolute size of carbon emissions by about 2.6 times between 2020 and 2050 (Paltsev et al., 2022). While use of more renewables and energy efficient practices can reduce emissions from the hard-to-abate sectors by 15-20 per cent by 2050, appropriate carbon pricing would be critical to reducing carbon emissions by 80 per cent by 2050. The Energy Conservation (Amendment) Act, 2022 recognises the importance of carbon pricing and aims at development of a carbon market or an emissions trading system (ETS), where the focus will be on reduction of carbon emissions rather than the current emphasis on energy efficiency under the Perform, Achieve and Trade (PAT) scheme. In the context of the forthcoming Carbon Border Adjustment Mechanism (CBAM) of the European Union (EU), an early attention to carbon tax/ETS in India has become necessary. IV.3 The second key dimension of the challenge is the scale of resources required for mitigation, adaptation and disaster management. Financial resources have two key components – cost and availability – but much of the current policy focus has been on keeping the cost low through greenium. The real challenge for India will be in arranging new investment, estimated to be in the range of US$ 7.2 trillion (baseline scenario) to US$ 12.1 trillion (accelerated scenario) till 2050 (Ghosh, 2023). One of the related challenges in financial planning would be managing the costs of decarbonisation – as several carbon emitting industries, buildings and firms would have already made large fixed investments, while also deploying considerable labour force, which may have to be re-trained to facilitate re-deployment in greener ventures. IV.4 The third dimension relates to access to technology and mineral resources at an affordable cost. Increasing dependence on new technologies used in batteries; solar panels and wind turbines; green hydrogen; carbon capture, utilisation and storage (CCUS); and e-waste management would require higher expenditure on research and development (R&D) and strategic collaboration. Currently, there is a high degree of concentration in the solar supply chain – polysilicon, silicon wafer, photovoltaic (PV) cells and PV modules – and access to strategic minerals such as lithium, rare earths, copper, zinc, chromium and graphite. Therefore, the goal of enhancing and securing the capacity for a successful green transition may have to contend with known and unknown impediments. Increasing geo-economic fragmentation of the world economy is amplifying uncertainty about access to technology, industrial raw materials and final products for individual countries, with a few major economies cornering disproportionately large shares of available global supplies. IV.5 Each sector of the economy faces formidable challenges that could potentially slow down the pace of green transition. Globally, rice farming, cattle rearing and biomass burning are estimated to account for more than a fifth of total methane emissions. While India has a National Mission for Sustainable Agriculture (NMSA) to promote climate-smart agriculture and climate-smart villages aimed at avoiding excessive use of water and electricity, adopting climate resilient cropping practices, and reducing carbon emissions; wider adoption on a sustained basis would be required going ahead. In the power sector, despite laudable progress in generating renewable energy, the country’s dependence on fossil fuels remains large, and the financial stress facing electricity distribution companies, though easing in recent years, continues. In the transportation sector, the state road transport companies have limited financial capacity to phase out old vehicles, and the cost of EVs needs to fall much more to enhance their attractiveness to the common man. While solar and wind energy generation costs are reducing, their uneven supply cycles pose a major challenge given the costs of storage technology. In the construction sector, despite known climate-smart building techniques and guidelines, most construction projects prefer extant low-cost techniques, in view of the large shortages of housing in urban areas and the rising cost of construction in the country. Despite sustained efforts of the Bureau of Energy Efficiency (BEE) and rising enforcement of efficiency norms, energy conservation practices are not widely adopted in businesses. The limited financial capacity of several municipal corporations has been a constraint for sewage and waste treatment in cities in sync with the national green transition plans. Therefore, a multi-pronged policy approach is necessary that recognises the trade-offs of each policy intervention and uses a mix of incentives and enforcement for optimal results that accelerate green transition. IV.6 Set against this context, this chapter explores the policy choices available to India today for transitioning to a greener and cleaner India over the coming decades. The broad available policy levers include fiscal policy, technology-enabled solutions, regulatory measures, trade policy, and monetary policy, besides energy conservation norms for wider voluntary adoption by the households and more effective interventions by firms under corporate social responsibility recognising the rising preference of investors, shareholders and other key stakeholders in every business for pro-planet realignment of business strategies. Governments, the world over, have been leading the fight against climate change risks by setting national climate action plans, coordinating across borders with key stakeholders, identifying national-level challenges to sustainable development and nudging individuals and firms to embrace climate-friendly lifestyles and business practices. Section 2 discusses fiscal policy initiatives and options, such as the current tax-subsidy mix and budgetary allocations, carbon taxes, ETS, and sovereign green bonds. Section 3 explores evolving innovations and technology-based solutions across various sectors that are essential for securing desirable progress towards a greener and cleaner India. Section 4 examines the scope in trade policy for accelerating the pace of green transition. Section 5 reviews and proposes a gamut of regulatory measures to support the green transition, while Section 6 delves into market-based solutions. Section 7 discusses the complementary role that monetary policy could play in supporting green transition. Section 8 examines ways to nudge consumers/businesses to contribute to green transition embracing the virtue that “green begins at home/self” and as part of people’s clean India movement (Swachh Bharat Abhiyan). Section 9 presents a scenario analysis to highlight the critical role of policy interventions in reducing carbon emissions compared with a business-as-usual scenario and recommends the need for concerted actions covering all spheres of policy making. The concluding section sets out specific policy recommendations, encompassing those that are already part of the animated debate at various stages of implementation, or are new and need greater attention. 2. Fiscal Policy Initiatives IV.7 For a policy-induced structural shift in the economy to achieve the net zero target, large scale reallocation of resources would be required from carbon-intensive to green industries/sectors, besides sizeable additional investment within a pre-set time frame. Fiscal policy, therefore, must play a prominent role, backed by an actionable and time-bound policy framework. Green fiscal policy encompasses the use of fiscal instruments such as taxes, subsidies, grants, and expenditures to help align the fiscal policy with climate and other environmental goals (Petrie, 2021). IV.8 The rationale for fiscal intervention is premised on the conflicting interface between public finances and the green transition goal. On the one hand, governments across the world subsidise fossil fuels – US$ 1 trillion in 2022 alone (IEA, 2023a) – on the other hand, they also spend large budgetary resources on protecting the environment, such as expenses on environmental R&D, incentivising adoption of greener technology, management of flora and fauna to protect natural habitats, and building disaster resilient infrastructure. Besides pro-active measures to mitigate climate change risks under a well-designed strategy, adapting to climate change would also entail large fiscal costs. Due to the potential effects of climate change on long-term economic growth, it has emerged as an important risk to public finance sustainability (Baur et al., 2021). IV.9 The Union Budget 2023-24 has identified ‘Green Growth’ as one of its seven priorities, which will guide the economy through the Amrit Kaal. Accordingly, the Government announced several measures to facilitate the transition of the economy to lower carbon intensity and reduced dependence on fossil fuels, such as building infrastructure to evacuate renewable energy from Ladakh and allocation for Green Hydrogen Mission, which targets annual production of 5 million metric tonnes (MMT) by 2030. Additionally, the Budget has also introduced new schemes such as GOBARdhan (Galvanizing Organic Bio- Agro Resources Dhan) scheme to set up 500 new ‘waste to wealth’ plants; PM PRANAM (Programme for Restoration, Awareness, Nourishment and Amelioration of Mother Earth) to incentivise States and Union Territories (UTs) to promote alternative fertilisers and balanced use of chemical fertilisers, MISHTI (Mangrove Initiative for Shoreline Habitats & Tangible Incomes) scheme for mangrove plantation along the coastline and on salt pan lands through convergence between funds under the Mahatma Gandhi National Rural Employment Guarantee Scheme (MGNREGS) and the Compensatory Afforestation Fund Management and Planning Authority (CAMPA); and the Amrit Dharohar scheme to encourage optimal use of wetlands, and enhance biodiversity, carbon stock, eco-tourism opportunities and income generation for local communities. IV.10 Climate change adaptation generally requires an increase in government spending to minimise the damage from climate-related disasters (Dabla-Norris et al., 2021). Climate change mitigation can be pursued through carbon pricing, as it helps generate revenues which can be invested in green projects and/ or used in providing incentives to the private sector for reducing emissions, including through innovation in green technologies (Ferdinandusse et al., 2022). IV.11 As of April 2022, 70 carbon pricing initiatives, covering 23.2 per cent of global greenhouse gas (GHG) emissions, have been put in place (Chart IV.1). Its potential, however, is still untapped as most carbon prices are below the levels needed to deliver significant decarbonisation (World Bank, 2022a). The EU has the largest and most vibrant ETS – the EU ETS – where prices have moved close to 100 per tonne of carbon dioxide (CO2) (Financial Times, 2023). This is higher than in several other countries but still lower than 120 per tonne of CO2 that would be required by 2030 to decarbonise by 2050 (Ferdinandusse et al., 2022). 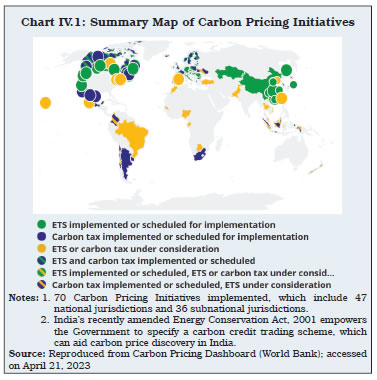 IV.12 The commonly used fiscal policy measures to mitigate and adapt to climate change are: (i) A carbon tax or a green tax; a compulsory, unrequited payment to the government on tax bases deemed to be harming the environment. When the green taxes are introduced along with a reduction in other taxes (such as labour tax or social security), it is viewed as an environmental tax reform (ETR). ETRs were first introduced in the Nordic countries in the 1990s followed by other European countries, Australia (2011), Japan (2012) and Chile (2014) (Gramkow, 2020); (ii) ETS; a market-based solution, which enables carbon emitters to trade emission units to meet their targets. There are two main types of emission systems: (a) cap-and-trade, where an upper limit on emissions is fixed and emission permits are either auctioned or distributed – those exceeding the limit must buy carbon credits and those operating within the limit earn carbon credits (e.g., Kazakhstan, Switzerland, South Korea and Shanghai) and (b) baseline and credit system, in which baseline emission levels are defined but there is no fixed limit on emissions. Entities that reduce their emissions more than the mandated amount can earn carbon credits to sell to underachievers (e.g., Alberta and Tokyo); (iii) Feebates and Regulation; which include a sliding scale of fees (or rebates) for carbon emissions above (or below) certain rates. Examples include emission standards for vehicles, fuel quality standards for petrol and diesel (e.g., China, India, Japan, and Indonesia), tax rebates for EVs, and higher fees on high-emitting vehicles (e.g., Singapore and India). The structure of fees and rebates is usually set to make the system revenue neutral. While feebates and regulations may have limited mitigation impact, they can play an important role in fostering investment in green energy (IMF, 2019); and (iv) Public green investment; even as the private sector is likely to take the lead in undertaking additional green investment, the public sector will need to act as a catalyst for the transition, through direct investment, co-financing, public-private partnership (PPP) or state guarantees (Ferdinandusse et al., 2022). Governments may be incentivised to increase green investment by implementing a green golden rule, under which green investment expenditure is exempt from fiscal rules (Darvas and Wolff, 2022). IV.13 Fiscal authorities in emerging market economies (EMEs) need to carefully consider the pros and cons of these policy options, as well as the methods used to implement them when determining carbon pricing. For arriving at a suitable carbon pricing policy framework for India, it is necessary to understand how carbon taxes and subsidies have been used in other countries. IV.14 Countries that tax non-renewable energy sources, including transportation fuel are shown in Chart IV.2. India is not included in this group of countries because there is no explicit carbon price specifically imposed on fuels like gasoline and diesel. These petroleum products are, however, subject to substantial excise duty and value-added tax (VAT). The total contribution of the petroleum sector to the exchequer in 2021-22 stood at 3.3 per cent of GDP1. IV.15 Several countries subsidise fossil fuels, with the total amount of subsidies (both explicit and implicit) as a share of GDP high enough to disincentivise and constrain green transition efforts (Chart IV.3). Keeping in perspective the international experience, we explore next the scope of carbon taxes and ETS in India. Carbon Tax IV.16 Governments impose carbon tax on CO2 emitters to make them internalise the associated negative externalities and attain socially optimal production levels. CO2 emissions have increased between 2002 and 2022, particularly in Asian countries vis-à-vis the advanced economies (AEs) (Charts IV.4a and IV.4b). India is the third largest emitter of CO2 after China and the US, though, on a per capita basis, it is one of the lowest (Chart IV.4c). To date, very few Asian economies have incorporated carbon taxes into their climate risk-mitigation strategies. 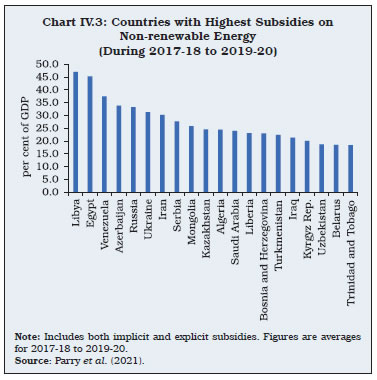
 IV.17 Carbon taxes have been introduced by 36 jurisdictions as of April 2022 (World Bank, 2022b). These are levied per unit of metric tonne of carbon dioxide equivalent (tCO2e). Finland was the first country to adopt a carbon tax, followed by Sweden and Norway. As of April 2022, the carbon tax rate of Finland stood at US$ 85 per tCO2e. Uruguay has the highest tax rate of US$ 137 per tCO2e, followed by Switzerland and Sweden at US$ 130 per tCO2e each. The adoption of carbon taxes significantly reduced GHG emissions in Finland, Sweden, and Norway (Andersson, 2019; Bruvoll and Larsen, 2004; Khastar et al., 2020). IV.18 Estimates based on data for the Asia and Pacific region suggest that a carbon tax of US$ 25 per tonne could reduce emissions by 21 per cent by 2030, with these nations outperforming their Paris Agreement targets and generating additional revenues of 0.8 per cent of GDP (Dabla-Norris et al., 2021). For India, a US$ 25 per tonne of carbon tax is estimated to reduce emissions by about 25 per cent by 2030 (IMF, 2019)2. Limiting global warming to 2 degree celsius, however, would require a carbon tax that may have to rise rapidly to US$ 75 per tonne of carbon dioxide by 2030. Carbon taxes are found to be more effective, but comparatively less used, whereas non-tax risk mitigation measures such as the ETS, feebates and regulations are less effective and therefore should be used as a complement to carbon taxes (Dabla-Norris et al., 2021). The proposed implementation of border carbon adjustments (BCAs)3 by some of the AEs to prevent their mitigation efforts from being undermined also strengthens the case for other nations to implement a carbon tax4. IV.19 India introduced a clean energy cess on coal at a rate of ₹50 per tonne in 20105. The tax proceeds were earmarked for the newly created National Clean Energy Fund (NCEF) to fund research and innovative clean energy technology projects. The utilisation of funds from NCEF was, however, low and disbursements were aligned more with ongoing programmes/missions of various ministries/departments than with the fund’s stated objectives (Pandey, 2013). In July 2017, the clean energy cess was replaced by the Goods and Services Tax (GST) compensation cess of ₹400 per tonne on coal production, which was meant to bridge the revenue shortfall of States due to the implementation of GST. Furthermore, with an excise tax of ₹19.9 per litre on petrol and ₹15.8 per litre on diesel by the Central Government and a VAT by the State Governments, the consumption of petrol and diesel is heavily taxed in India. It is estimated that 54.7 per cent of GHG emissions in India are subject to a positive net effective carbon rate (NECR).6 The NECR in India is the highest in the road transport sector and zero or negative in other sectors such as agriculture, industry and buildings (OECD, 2021a). IV.20 Carbon taxes on fossil fuels entail distributional consequences as they are generally regressive. The imposition of carbon taxes can reduce social welfare and is more likely to increase income inequality (Khastar et al., 2020). Revenue recycling, i.e., earmarking revenues from carbon taxes for spending on citizen welfare schemes can help enhance public support for carbon taxation. It is estimated that the introduction of carbon pricing without revenue recycling could increase the Gini coefficient by 0.59 per cent over the baseline scenario of business as usual in 2030 (Zhao et al., 2022). With a progressive recycling scheme (i.e., lower income groups receiving higher benefits), however, the Gini coefficient in 2030 would be 0.34 per cent lower than the baseline. IV.21 The impact of carbon taxes also depends on the utilisation of tax proceeds. There are three possible ways to utilise tax proceeds to reduce tax burdens and improve economic outcomes: (a) providing a lumpsum dividend to households, as in the United Kingdom and France, which can improve progressivity but may reduce employment and income by disincentivising work/search for work among the unemployed; (b) a corporate tax rate cut, which may increase output, productivity, and innovation but at the cost of likely reduction of progressivity; and (c) a reduction in income tax, as in Finland, which can improve progressivity, income, and employment (Pomerleau and Asen, 2019). Hence, the third strategy may be the preferred policy tool to reduce the adverse impact of a carbon tax. Table IV.1: Step-wise Considerations for Implementing a Carbon Tax | | | | | Utilisation of tax revenue | Implementation | • Revenues may be utilised for the promotion of clean technology and R&D spending on low-carbon technology.
• Since a carbon tax may increase the burden on low-income households as they may not be able to switch to low-carbon technology quickly, appropriate offsets may be required.
• Small industries using less carbon- efficient production technology may increase their final prices which may degrade their competitiveness. Hence identifying and subsidising these industries using the tax proceeds may be required. | Determination of tax rate | • Phased yet timely implementation is crucial, with institutional amendments. The tax base and rate may be gradually increased over time.
• Inclusion of carbon taxes in GST, Central Excise and State VAT, may help implementation in India. | | Determination of tax base | There are two approaches to determining the tax rate:
1) Social cost of carbon - tax rates are estimated based on the social cost due to emissions of CO2.
2) Abatement approach - carbon tax is imposed to meet specific emissions reduction targets committed at international fora. | All fuels that produce carbon should be considered as the universal tax base. | Source: EY (2018). | IV.22 At present, India does not have an explicit carbon tax system but it imposes taxes on the use of fossil fuels, as noted earlier. As and when a carbon tax is introduced, it is important to recognise that several considerations must predate its implementation (Table IV.1). Moreover, the World Bank recommends that countries imposing carbon taxes should target higher economic growth, spend more on clean technology, provide direct benefit transfers to low-income households and effectively regulate and monitor environmental objectives of carbon pricing. Feebates and Subsidies IV.23 Fiscal measures should also support investment in clean technologies through greater budgetary outlay on R&D for developing low-carbon technologies and by compensating losses arising from the transition to clean technologies to incentivise firms to adopt these technologies. Investment in climate resilient infrastructure and specifically earmarked resources for managing post-disaster losses must also be an integral part of the medium-term fiscal policy strategy. After decades of congressional stalemate, the Inflation Reduction Act (IRA) in the US was passed on account of two major strategic shifts. First, carrots score higher over sticks to build political support and hence the law subsidises clean energy rather than taxing carbon pollution. Second, the law explicitly favours US-made products (such as EVs) and clean energy, as part of a broader shift toward strategic intervention to promote and protect firms in targeted sectors such as production of semiconductors (Joselaw and Montalbano, 2022). Emissions Trading Systems (ETS) IV.24 Like a carbon tax, an ETS has its own challenges and benefits (Table IV.2). Adopting a new carbon pricing mechanism such as the ETS may necessitate overhauling the current carbon tax/subsidy framework. IV.25 India’s Energy Conservation (Amendment) Act, 2022 has drawn attention to the importance of carbon markets and green financing via green bonds for meeting the country’s decarbonisation targets. Its scope is substantial, and it gives the Government the authority to create a system for trading carbon credits, laying the foundation for a legitimate carbon market. Several EMEs (accounting for around half of the global GHG emissions) have so far implemented or are contemplating carbon pricing using ETS or carbon taxes (Table IV.3). | Table IV.2: Carbon Tax and ETS: Advantages and Disadvantages | | | Carbon Tax | ETS | | Advantage | Provides certainty about the price of carbon | Increases certainty about emission reductions and environmental benefits. | | Disadvantage | The outcome of emission reductions is unknown. | The costs of achieving the desired level of abatement are unknown. | | Source: Observer Research Foundation (2022). | IV.26 Mexico conducted several pilots involving specific enterprises before its three-year trial operational phase in 2020. China implemented its national ETS market in 2021 after trials in eight provinces. The federal structure of India could help in implementing ETS pilot programmes across states. The gradual enlargement of its scope into a more practical nation-wide ETS would require simulations and pilots. On July 15, 2019, the Gujarat Pollution Control Board (GPCB) introduced India’s first ETS and the world’s first cap-and-trade market in particulate pollution (Table IV.4). | Table IV.3: Carbon Pricing Mechanism in Emerging Market Economies | | Name | GHG Emissions (as per cent of World emission) | Status | Description | Scope (Share of GHG emissions covered) | | Argentina | 0.80 | Carbon Tax (Implemented) | Implemented a Carbon tax in 2018, replacing the fuel tax | 20 per cent | | Brazil | 2.92 | ETS (TBC) | National Climate Policy aims to promote ETS. Since 2013, a group of leading companies have participated in a voluntary ETS simulation | Not decided | | China | 24.23 | ETS (Implemented) | The world’s largest ETS, in terms of covered emissions, was implemented in 2021. | 33 per cent. | | Indonesia | 3.94 | Carbon Tax (Implemented) / ETS (TBC) | Passed a law to implement carbon tax in October 2021, Working towards a mandatory ETS in the power sector | 26 per cent using Carbon tax | | South Korea | 1.31 | ETS (Implemented) | Launched a cap-and-trade based ETS at a national level in 2015 | 73 per cent. | | Malaysia | 0.80 | ETS (TBC) | Considering between Domestic ETS and Carbon tax | Not decided | | Mexico | 1.35 | Carbon Tax (Implemented) / ETS (TBC) | Carbon tax is an excise tax under the special tax on production and services that was implemented in 2014 | 44 per cent. | | Poland | 0.64 | Carbon Tax (Implemented) | Part of the Environmental Protection Act that covers CO2 emission, dust, sewage, and waste. | 3.75 per cent. | | South Africa | 1.13 | Carbon Tax (Implemented) | Places a price on CO2 emissions from large businesses in the industry, power, and transport sectors. | 80 per cent. | | Thailand | 1.13 | ETS (TBC) | Following COP 26, the government is developing guidelines for ETS, expected to be released in 2022 | Not decided | | Türkiye | 1.31 | ETS (TBC) | Laws governing monitoring, reporting, and verification (MRV) were implemented in Türkiye in 2012, and monitoring of GHG emissions from large installations began in 2015. | Not decided | | India | 6.75 | Carbon Tax (TBC) | NA | NA | Note: TBC: To be confirmed.
Source: Our World in Data. |
| Table IV.4: Emissions Trading Model in Surat | | Key Areas | Details | | Background | • Pollution reached a high level in Surat in 2018.
• Surat was selected as the location for the pilot programme. | | ETS model in Surat | • ETS is a regulatory mechanism that aims to reduce pollution load in a region while simultaneously minimising the business compliance cost.
• Different types of businesses can buy and sell the rights to release particulate matter into the atmosphere by exchanging licences, measured in kilograms (kgs) that fall within this cap. | | Trading | • At the beginning of every month (during which the emission permit is valid), 80 per cent of the total cap of 280 tonnes for that period is distributed free to all participating units.
• GPCB will offer the remaining 20 per cent during the first auction of the compliance period at a floor price of ₹5/kg. | | Auctions | • Transactions like these take place on the trading platform known as ETS-PM, which is hosted by the National Commodities and Derivatives Exchange e-Market Limited (NeML), where all participants must register a trading account.
• There are two types of auctions: (i) Uniform price auction and (ii) Continuous market. To satisfy compliance responsibilities, units may acquire and sell leftover permits at the final auction price 2-7 days before the compliance period ends. | | Punitive Actions | • Environmental damage compensation to the amount of ₹200/kg will be assessed for emissions over a unit’s permit holdings when the compliance term ends.
• An upper limit has been established so players cannot stockpile permits to gain an unfair advantage. | | Source: Gujarat Polltuion Control Board (GPCB): Emissions Trading Scheme (Pilot Project, 2019). | IV.27 An ETS provides a transformational alternative to command-and-control policies that are expensive, inflexible and could be enforced by imposing costly and time-consuming penalties. The ETS is anticipated to provide emissions reduction certainty without significantly altering the existing carbon tax or subsidies, and may be adopted in India for accelerating decarbonisation in industries like transportation. ETS may be politically more acceptable and relatively easier to implement (IMF, 2022a). IV.28 Public spending on climate change and related issues remains underreported in India, and hence, a consistent reporting template needs to be put in place to record climate-related expenditures and report them in a Climate Budget Report as a supplement to the annual budget. Even before that, an effective green taxonomy to limit the potential risk of greenwashing is needed. Starting with the first climate budget published by Nepal in 2013, several countries have followed suit, including Bangladesh, Indonesia, Moldova, Kenya, Norway, Sweden and France (Petrie, 2021). In India, Odisha became the first state to publish a climate budget report in 2020. IV.29 To meet its climate goals, India needs to introduce a broad-based carbon pricing system in line with the global best practices highlighted above. Furthermore, a variant of the NCEF may be instituted, to which all receipts from carbon taxes and proceeds from the recently introduced green bonds may be credited. Expenditure tagging must be undertaken to highlight separately expenditures that benefit the environment, and those that are harmful, to produce full-fledged climate budget reports, which may be instrumental in better identifying the green financing needs and attracting international financing (Petrie, 2021). Sovereign Green Bonds IV.30 Sovereign green bonds (SGBs) are similar to traditional Government securities except that they contain a “use of proceeds” clause which states that the funds will be utilized solely for green investments (Ando et al., 2022). The first ever SGBs were issued by Poland in 2016, followed by France, Fiji and Nigeria in 2017. While several EMEs have started issuing SGBs, advanced economies are the frontrunners in SGB issuances so far (Chart IV.5). India issued its first SGBs amounting to ₹16,000 crore in 2022-23. While SGBs are gaining popularity, their market remains shallow as they account for only 0.2 per cent of all Government debt securities issued in the OECD area and 12 per cent of total green bond issuances in EMEs (OECD, 2021b). 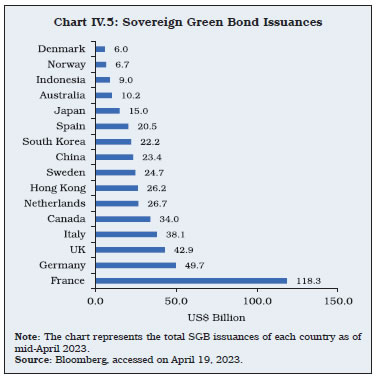 IV.31 Some of the benefits of SGBs include lower refinancing risk as these bonds are generally issued with a long maturity (Doronzo et al., 2021); and a green premium (or greenium) which occurs when the SGB exhibits a lower yield compared to the traditional Government bond, due to strong demand from investors following greater transparency on the use of bond proceeds, despite lower liquidity of SGBs (Ando et al., 2022). SGBs can be a stable source of financing for Government expenditure on climate related infrastructure and can facilitate the transition to a low-carbon economy which would, however, depend on how they perform relative to conventional bonds (Box IV.1). Box IV.1
Emerging Market (EM) Green Bonds: The Significance of Greenium ‘Greenium’- a premium over vanilla bonds, is an integral feature of a successful green bond issuance strategy. JP Morgan’s EM Green Bond Index outperformed the comparable JP Morgan EM Bond Index in 2022, extending the cumulative over-performance since December 2017 to 790 basis points (bps) (IFC, 2021; Bloomberg, 2022). When the green bond index outperforms the conventional bond performance, the greenium widens (Chart 1). Global financial conditions have influenced the evolution of the spread between the return on EM green bonds and their non-green counterparts. A tighter global financial condition (proxied by the US financial conditions) is associated with an increase in the spread, and the association almost doubled from the pre-COVID to post- Covid period. For example, the correlation was 0.31 in the pre-COVID period (2018 M01- 2020 M02) and rose to 0.61 (2020 M03 – 2022 M12). Granger causality results between spread and financial conditions strongly support causality from the National Financial Conditions Index (NFCI) to spread at 1 per cent level of statistical significance (Chart 2 and Table 1). 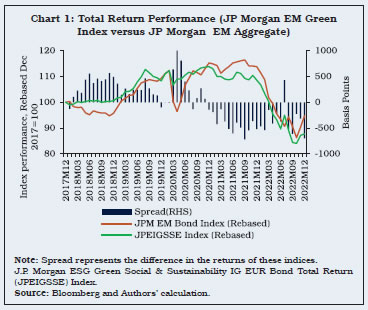
| Table 1: Granger Causality Test Results | | Null-Hypotheses | NFCI does not Granger Cause Spread | Spread does not Granger Cause NFCI | | Lags = 2 | 13.13*** | 2.15 | | | (0.00) | (0.13) | | Lags = 3 | 9.42*** | 1.49 | | | (0.00) | (0.23) | | Lags = 4 | 10.18*** | 1.24 | | | (0.00) | (0.31) | | Lags = 5 | 9.72*** | 1.07 | | | (0.00) | (0.39) | Note: All coefficients are F-Statistics; Terms in bracket are p-values.
Sample: December 2017 to December 2022; Blue shaded region shows easy global financial conditions, whereas red shaded part represents tight financial conditions (post October 2021 tightening of global financial conditions is the outcome of high inflation and expected rise in the US fed funds rate).
Source: Authors’ calculations. |
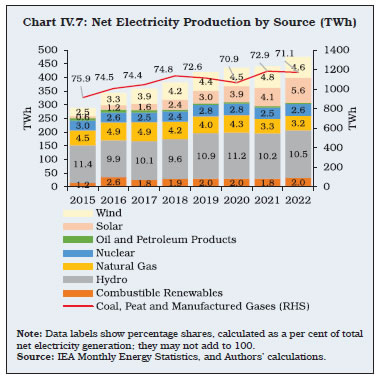
While assessing the pricing of SGBs, it would be important to recognise the significance of global financial conditions in shifting investor appetite, besides the role of a pool of savers, both domestic and foreign, who may accept lower returns on such bonds if the proceeds are clearly earmarked and used for green projects. References: IFC (2021). Emerging market green bonds report: On the road to green recovery. | 3. Innovation and Technology Adoption IV.32 Technical progress can be a key enabler to achieving a successful green transition. Besides increasing the productivity of resources, it can reduce the degradation of natural resources and curtail pollution. In most traditional economic models and growth theories, technology is modelled as an exogenous variable that appears as ‘manna from heaven’. Endogenous growth theories acknowledge that technological change occurs as a result of identifiable and deliberate processes, including R&D; investment, economies of scale and public policy changes. As per this view, public institutions have an important role in allowing efficient price discovery for desirable resource allocation and providing a conducive environment for environment-related innovation. Therefore, Governments have a more direct role in developing and diffusing technology for sustainable development and financing basic research for green innovation. In this context, this section explores alternative technology choices available to the policymakers today while pursuing the path to a clean, green and sustainable energy transition. Renewable Energy IV.33 Technology solutions have helped discover and exploit alternative energy sources, enhance energy efficiency of current and new systems, reduce risks arising from climate change, and lower renewable energy costs. IV.34 Most energy-economy models, in fact, historically underestimated the pace of deployment of renewable energy technologies and overestimated their costs (Way et al., 2022) (Chart IV.6). Compared to continuing with a fossil fuel-based system, a rapid green energy transition may result in significant savings. The price of electricity from utility-scale solar PVs has reduced by 89 per cent from 2009 to 2019, while prices of lithium-ion batteries have fallen by 97 per cent since their commercial introduction in 1991 (UNDP, 2022). IV.35 Renewables’ growth in 2022 was much faster than initially expected, driven by strong policy support in China, the EU and Latin America (IEA, 2022a). India has made significant strides towards a sustainable energy mix over the past few years, with an installed capacity from renewable sources of energy of more than 157 GW (PIB, 2022a), and the share of renewables in electricity generation increasing from around 16 per cent in CY2015 to 23 per cent in CY2022. This is in pursuance of India’s vision of achieving the Net Zero Emission target by 2070 and increasing renewables capacity to 500 GW by 2030. A granular analysis of India’s electricity generation mix shows that the share of solar energy has increased from 0.6 per cent in 2015 to 5.6 per cent in 2022 (Chart IV.7). Hydro-power share remains steady at approximately 10 per cent, while the share of wind energy has nearly doubled. The share of coal and natural gas in the electricity mix has reduced over the years. The key challenge in raising the share of renewable energy is not only incentivising domestic production of solar panels, wind turbines, batteries and EVs, but also facilitating research and technology extension for dealing with the fluctuating energy output from renewable energy sources like solar and wind, and securing the entire supply chain. 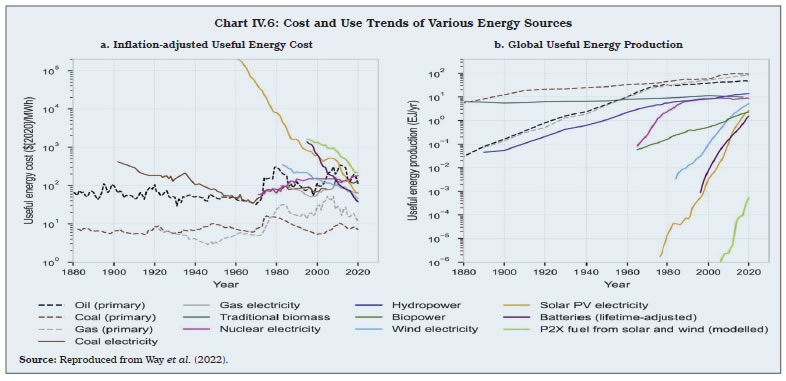
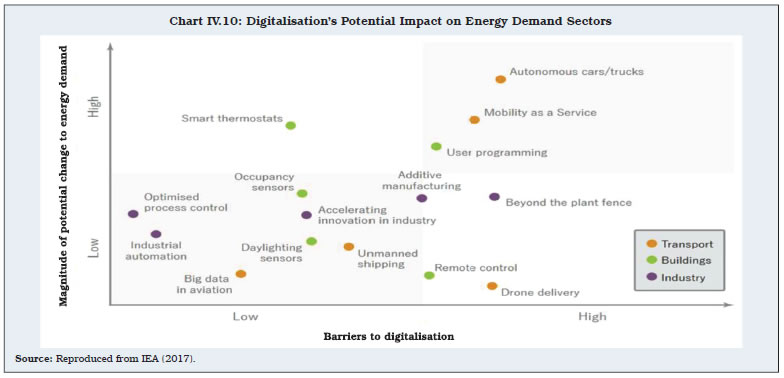
 IV.36 Various policy steps have been taken by the Government towards a sustainable energy mix, including the new solar-powered toll plazas, development of Mass Rapid Transit Systems (MRTS) across cities, the National Smart Grid Mission and the Green Energy Corridor Project for an efficient transmission and distribution network for renewable energy and the Faster Adoption and Manufacturing of Hybrid Electric vehicles (FAME India) scheme. More recently, India submitted its long-term low greenhouse gas emission development strategies (LT-LEDS) at the 27th Conference of Parties (COP 27) of the United Nations Framework Convention on Climate Change (UNFCCC) at Sharm El Sheikh (MoEFCC, 2022). The LT-LEDS is a crucial policy tool that can help a country to place short-term climate actions in the context of the long-term structural changes required to transition to a low-carbon and climate-resilient economy. IV.37 As part of its LT-LEDS, India aims at carrying out a just, smooth and sustainable transition away from fossil fuels by making India a green hydrogen hub, increasing electrolyser-manufacturing capacity in the country, and undertaking a three-fold increase in nuclear power generation capacity by 2032. Additionally, the LT-LEDS focuses on low-carbon transportation, by increasing the use of biofuels through ethanol blending in petrol (which is envisaged to rise to 20 per cent by 2025 from 10 per cent under the Ethanol Blended Petrol programme), increase in EV penetration and promotion of green hydrogen fuel. Solar Power, Batteries and EVs IV.38 In line with international trends, the cost of solar power generation has come down in India in recent years, with the lowest auction winning tariffs hovering in the range of ₹2-3 per kilowatt-hour (kWh). Installed capacity is increasing in a mission mode, but the focus now needs to shift to addressing viability of solar power for use by all. Important sources of non-conventional energy, wind and solar, face two major challenges - high fluctuation in supply due to their dependence on environmental factors such as sunlight and wind speed, and inflexibility in scaling up or down in line with the demand. Hence, a grid with high solar and wind capacity needs stabilising mechanisms to manage fluctuations in demand. One solution could be supplementing the grid with readily variable sources like run-off-the-river hydro or geothermal energy. Another could be to manage demand through the use of smart grids that can monitor power flows from points of generation to points of consumption and control the power flow or curtail the load to match generation in real-time or near real-time. The National Smart Grid Mission is a step in this direction and is expected to inculcate dynamic pricing mechanisms to incentivise consumers to shift their usage over different times of the day in response to price signals. IV.39 The smart grid will also facilitate distributed generation, especially rooftop solar generation, by allowing movement and measurement of energy in both directions using control systems and net metering, which could help “prosumers” i.e., the consumers that both produce and consume electricity, to safely connect to the grid. Yet another option is developing Energy Storage Systems, which involve converting excess solar and wind power to potential energy in batteries, supercapacitors, compressed air energy storage systems, flywheels, and gravity storage or pumped hydro storage plants. Rapid technological progress and cost competitiveness have made batteries the mode of choice for most applications (ISGF, 2019). The research priorities for electrical batteries in India include new cell chemistries emerging from the lithium-ion family, such as lithium-air, lithium-sulphur or other metals, such as sodium and magnesium. The recent discovery of 5.9 million tonnes of lithium reserves should enhance the indigenous impetus for green transition and help India in reducing its import dependence for this crucial mineral. Nevertheless, research and innovation for exploring other battery technologies is a strategic requirement. IV.40 EVs have emerged as the next frontier in mobility, with global electric car sales exceeding 10 million units in 2022. Cumulatively, the number of electric cars on road exceeded 26 million in 2022 - more than five times the stock in 2018 (IEA, 2023c). According to the Vahan dashboard7, India achieved the milestone of one million EV registrations in 2022 – a substantial jump from 3,31,365 registrations a year ago. Globally, the success of EVs has largely been driven by sustained policy support through subsidies aimed at increasing EV sales and crowding–in charging infrastructure and manufacturing capacity. IV.41 In India, the FAME scheme has been extended to FAME-II till the end of 2024, which now includes a 50 per cent increase in purchase incentives for electric two-wheelers to ₹15,000 per kWh of battery capacity. This is important, given that India is the largest two-wheeler market in the world. The FAME-II scheme has provided subsidies to the tune of ₹1,000 crore to develop almost 2,900 charging stations across 25 states. Additionally, the National Highways Authority of India has set an objective to install EV charging stations every 40-60 km along national highways, covering 35,000-40,000 km of highways by 2023. Nineteen states in India offer some form of policy support for EVs, such as purchase incentives, exemptions from road taxes, and subsidies for investment in battery manufacturing and related components (IEA, 2022c). IV.42 The switch to EVs is bound to exert pressure on mines for supply of minerals such as copper, lithium, nickel, manganese and graphite and for rare earth elements that are used in EV manufacturing (Chart IV.8). This is true even for wind power. It is important that the environmental costs of mining and extraction are accurately factored in, and appropriate compensation mechanisms are devised. The prices of these metals surged in the aftermath of the war in Ukraine, and their supply chain remains highly concentrated.  IV.43 Three-fourths of worldwide lithium-ion battery production is centred in China, and over half of lithium, cobalt and graphite processing and refining capacity is located there. Central and South America and Africa hold a large share of reserves of minerals used in the renewable power supply chain (Chart IV.9). China currently dominates the processing, manufacturing and assembly phases of the supply chains of key renewable energy technologies. India needs to secure its supply chain, including through indigenous production and outward foreign direct investment (FDI), as being pursued by the European nations and the US. India neither has substantial reserves of such minerals (other than the recently discovered lithium), nor is it globally competitive in processing capacity. Hence, there is an urgent need to secure a steady supply of these minerals through diplomatic efforts recognising the benefits of South-South cooperation and at the same time, incentivising investment for creating large capacity for material processing, manufacturing and assembly of solar PVCs, wind turbines, EV batteries and related components. IV.44 The electrification of the road transport sector will have to be supported by subsidies, especially in the case of charging stations, until EV density is sufficient to sustain the charging infrastructure without any support. Incentivising the installation of home chargers in existing parking spaces, mandating EV readiness for new buildings and installation of chargers in existing buildings are the way forward. Recycling of metals involved in battery and EV production or moving to newer technologies such as lithium iron phosphate cathodes and manganese-rich cathodes may be necessary to combat metal shortages and encourage local battery production. Battery standardisation and developing a common set of standards for testing and evaluating second-hand batteries may be necessary for the effective recycling of old batteries. Green Hydrogen IV.45 Green hydrogen is the hydrogen produced by the electrolysis of water molecules using energy from renewables. India currently consumes about 6.17 MT of hydrogen annually, and this is expected to grow to 28 MT per annum by 2050 (TERI, 2022). Presently, most consumption is of grey hydrogen8 and its use is largely confined to the fertilizer and refinery sectors. Hard-to-abate sectors such as cement, steel and transport can be potential future hydrogen-consuming sectors. Green hydrogen can be an effective way of storing excess energy during times of low demand to be fed back into the grid when demand rises. The cost of green hydrogen is expected to be reduced by more than 50 per cent by 2030, largely driven by the decrease in the cost of renewables and electrolysers in India (TERI, 2022). The National Green Hydrogen Mission aims to make India a global hub for production, utilisation and export of green hydrogen and its derivatives. Moreover, it would reduce fossil fuel imports by more than ₹1 lakh crore by 2030, thereby bringing down the overall import bill. Various public sector enterprises and conglomerates have announced long-term investment commitments in the green hydrogen space. IV.46 Furthermore, the Green Hydrogen Mission could be a major catalyst for India’s decarbonisation, built on the government’s proactive policy focus, ambitious private sector partnership and advantageous production environment. With abundant renewable resources availability coupled with comparatively lower construction costs than competing regions, India is well positioned to take the lead in green hydrogen production. Indigenisation of technological processes and industry-led R&D for breakthrough technology would be the key to enhancing electrolysis capacity for green hydrogen production. Carbon Capture Utilisation and Storage (CCUS) IV.47 Leading US tech companies9 have pledged US$ 925 million to remove CO2 from the atmosphere (known as carbon capture) to arrest global warming. Globally about six gigatonnes of CO2 a year is required to be removed from the atmosphere by 2050 to avert any disastrous effects of climate change (McKinsey & Company, 2022). The inclusion of Carbon Capture Utilisation and Storage (CCUS) as one of the 13 activities that qualify for carbon trading in India’s upcoming carbon trading market may provide a more diversified toolkit for India to tackle CO2 emissions (PIB, 2023). Moreover, the Ministry of Petroleum and Natural Gas (MoPNG) received ₹35,000 crore grant in the 2022-23 budget, which is expected to be deployed in carbon sequestration technologies such as CCUS. Thus, CCUS can play a crucial role in achieving India’s goal of reducing CO2 emissions by 50 per cent by 2050 by decarbonising hard-to-abate industries such as steel, cement, and petrochemicals (NITI Aayog, 2022a). However, its expensive cost structure and unproven technology pose certain downside risks. Nuclear Energy IV.48 According to the World Nuclear Industry Status Report 2022, the share of nuclear energy in global commercial gross electricity generation in 2021 dropped to 9.8 per cent – the lowest in four decades – and 40 per cent below the peak of 17.5 per cent attained in 1996. Nuclear energy generation in India accounted for 2.6 per cent of total electricity generation in 2022. India has 19 of the world’s total 411 functioning nuclear reactors with eight of them under construction as of October 2022. The declining trends are largely in response to the Fukushima disaster in 2011, after which even firm believers in nuclear power as the viable path to sustainable energy security, such as France, decided to scale down. Post-pandemic energy shortages and the energy crisis in Europe on account of the war in Ukraine, however, have led to a revival of interest in nuclear power. IV.49 New technologies, such as very small reactors, are emerging, which are sealed and do not require regular refueling, making them well-suited for applications in which the entire reactor can be plugged into a grid or dropped into a remote location where they can operate for many years till refueling is required. In a bid to reduce its dependence on imported Uranium, India is tilting towards thorium based nuclear reactors in the long run, since this fuel is available in the monazite sands of the eastern and western coasts of the country. Artificial Intelligence (AI) and Machine Learning (ML) for Sustainable Energy Transition IV.50 In recent years, a large volume of data has been unlocked through the Internet of Things (IoT) enabled sensors, satellite data and drones, with scope for using AI, ML, and blockchain to identify and propagate climate solutions. These technologies can help measure, understand and evaluate challenges and make forecasts, enable informed policy choices, permit the automation of responses, optimise resource use, and provide smart infrastructure. Moreover, AI can also help integrate renewables of fluctuating supply by enabling smart grids that partially match electricity demand to times of high sunshine and wind speed. AI is estimated to have the potential to enable the fulfilment of 93 per cent of the environmental Sustainable Development Goals (Rolnick et al., 2023). Various ML technologies have immense potential to provide green solutions in domains such as electricity systems, transportation and climate prediction (Table IV.5). IV.51 With technology expected to shape the progress on green transition, it is important to prioritise an innovation-supportive policy regime accompanied by a large and sustained increase in R&D expenditure (Box IV.2). | Table IV.5: Machine Learning and its Deployment for Climate Change Solutions | | Solution Domain | Causal Inference | Computer Vision | Interpretable Models | Natural Language Processing | Reinforcement Learning and Control | Time-Series Analysis | Transfer Learning | Uncertainty Quantification | Unsupervised Learning | | Electricity systems | | | | | | | | | | | Enabling low-carbon electricity | | ✓ | ✓ | | ✓ | ✓ | | ✓ | ✓ | | Reducing current-system impacts | | ✓ | | | | ✓ | | ✓ | ✓ | | Ensuring global impact | | ✓ | | | | | ✓ | | ✓ | | Transportation | | | | | | | | | | | Reducing transport activity | | ✓ | | | | ✓ | | ✓ | ✓ | | Improving vehicle efficiency | | ✓ | | | ✓ | | | | | | Alternative fuels & electrification | | | | | ✓ | | | | ✓ | | Buildings and cities | | | | | | | | | | | Optimising buildings | ✓ | | | | ✓ | ✓ | ✓ | | | | Urban planning | | ✓ | | | | ✓ | ✓ | | ✓ | | The future of cities | | | | ✓ | | | ✓ | ✓ | ✓ | | Industry | | | | | | | | | | | Optimising supply chains | | ✓ | | | ✓ | ✓ | | | | | Improving materials | | | | | | | | | ✓ | | Production & energy | | ✓ | ✓ | | ✓ | | | | | | Farms & forests | | | | | | | | | | | Remote sensing of emissions | | ✓ | | | | | | | | | Precision agriculture | | ✓ | | | ✓ | ✓ | | | | | Monitoring peatlands | | ✓ | | | | | | | | | Carbon dioxide removal | | | | | | | | | | | Direct air capture | | | | | | | | | ✓ | | Sequestering CO2 | | ✓ | | | | | | ✓ | ✓ | | Climate prediction | | | | | | | | | | | Uniting data, ML & climate science | | ✓ | ✓ | | | ✓ | | ✓ | | | Forecasting extreme events | | ✓ | ✓ | | | ✓ | | ✓ | | | Source: Rolnick et al. (2023). | Digitalisation and Energy Efficiency IV.52 Digitalisation could prove to be a potent means to enhance energy efficiency, saving energy in the major energy-intensive sectors such as transportation, buildings and industry (Chart IV.10). At the policy design stage, digital tools can provide access to more granular and real-time data, and advanced analytics and modelling capabilities can help predict the impact and cost-effectiveness of programmes. Digitalisation can be an effective communication tool to enable more user-centred policies during programme implementation (Table IV.6). Transportation Sector IV.53 The transportation sector accounts for about 28 per cent of global final energy demand and 23 per cent of global CO2 emissions from fuel combustion (IEA, 2017). The dynamics and net effects of Automated, Connected, Electric and Shared (ACES) mobility will play a key role in shaping the overall transport sector’s future energy and emissions trajectory. In cities with high population density and good public transport networks, digitalisation could contribute to a shift away from the traditional paradigm of vehicle ownership towards the provision of Mobility as a Service (MaaS), which could simplify shared mobility services by offering a unified routing and payment platform. Box IV.2
Innovation for Sustainable Energy Transition Innovation is central to putting the world on a sustainable energy path. It creates value by improving existing processes and generating new ways of doing business. Innovation augments the portfolio of policy options available and the potential strategies to meet goals. Over time, it brings down the costs of achieving set goals (Kobos et al., 2006). Using a panel dataset of 12 AEs and EMEs (including India) with annual frequency between 1996 and 2020, the factors influencing the share of renewable energy in total energy consumption is assessed (Table 1). The analysis incorporates per-capita CO2 equivalent emissions and per capita GDP to control for common but differentiated responsibilities in climate change mitigation, and the levels of oil and natural gas reserves – since availability of such reserves domestically may influence the preferred local energy mix. Gross domestic expenditure on R&D consists of the total expenditure (current and capital) on R&D by all resident companies, research institutes, universities, and Government laboratories. It is found that higher the R&D related expenditure as a per cent of GDP, greater is the shift to renewable energy. This effect may be experienced with a lag (of about two years, as in Models 2 and 3). Hence, the fruits of innovation may take time to yield results, extend to the commercial space and finally percolate into the actual energy mix. Technology innovation does not evolve in a vacuum: the market structure, public support for entrepreneurship, and direct government investment all influence how rapidly new technologies emerge and are adopted. This is true for energy as for other sectors of the economy. These findings suggest that enhancing and incentivising the flow of resources for innovation is essential to achieve a greener energy mix in the future. | Table 1: Panel Data Analysis Results | | Variable | Model (1) Share of Renewable Energy | Model (2) Share of Renewable Energy | Model (3) Share of Renewable Energy | | Per Capita CO2 Emissions | 0.004 | -0.001 | -0.002** | | (0.005) | (0.009) | (0.001) | | Coal Dependence for Electricity | -0.001*** | -0.001** | -0.001*** | | (0.000) | (0.000) | (0.000) | | R&D Expenditure Share in GDP | 0.042** | -0.095*** | -0.075** | | (0.018) | (0.021) | (0.034) | | 2-year lag of R&D Expenditure Share in GDP | | 0.141*** | 0.105*** | | | (0.039) | (0.037) | | Log GDP per capita | | 0.005 | 0.003** | | | (0.014) | (0.002) | | Log Oil Reserves | | | 0.016*** | | | | (0.002) | | Log Gas Reserves | | | 0.010 | | | | (0.007) | | Intercept | -0.041 | -0.053 | -0.027 | | (0.055) | (0.175) | (0.019) | | R2 | 0.62 | 0.74 | 0.96 | | Observations | 129 | 75 | 73 | | Countries | 12 | 7 | 5 | Notes: ***: p<0.01, **: p<0.05, *: p<0.1; Robust standard errors in parenthesis.
All models use the random effects specification (as supported by the Hausman test) and incorporate year fixed effects.
Notes on variables: Renewable energy consumption (exajoules); Per Capita CO2 emissions (million tonnes of CO2 equivalent per 1 billion population); Coal Dependence for electricity (coal share in total electricity generation); R&D Expenditure as a share of GDP (per cent); GDP per capita (2017 US$ PPP); Proven Oil Reserves (thousand million barrels); Proven Gas Reserves (trillion cubic metres). Data from BP Statistical Review and World Bank. | References: Kobos, P.H., Erickson, J.D. and Drennen, T.E. (2006). Technological learning and renewable energy costs: implications for US renewable energy policy. Energy Policy. Volume 34, Issue 13. Pages 1645-1658. |
| Table IV.6: Digital Tools Used for Promoting Energy Efficiency | | Tool | Country | Project | Description | | Geographic Information System (GIS) mapping and remote sensing | Europe | Hot Maps Project | Open-source tool allowing city planners to visualise geographical areas with potentially high heating or cooling loads, which could then be prioritised for energy efficiency upgrades as part of heating or cooling action plans. | | Virtual buildings and digital twin cities | Singapore | Virtual Singapore | 3D digital replicas of every building in the city providing the capability to accurately simulate how new developments and planning changes in the city might affect a range of energy-related indicators, road and foot traffic flows, heating and cooling needs, etc. | | Digital certification and compliance | EU, China | QR codes coupled with smartphones and apps | With QR codes attached on appliances and linked to a database, consumers can easily check and compare the energy efficiency of appliances | | Digital communication and networking | US | Building Performance Database | Online tool created to help people access and browse data on building energy performance, from governments, utilities, energy efficiency programmes, building owners and private companies. | | Natural language processing | US | US Department of Energy | Scan through texts and numerical data on energy investments and company information to track innovation and clean energy progress. | | Web search analytics | Sweden, Denmark, Finland, Iceland | NordCrawl Project | Web scraping provides an alternative method for regulators to assess whether models are being sold that do not meet Minimum Energy Performance Standards. Using automated tools, regulators can quickly scan online shopping websites to assess which models are being offered for sale in their country. | | Source: IEA (2021b). | Green Buildings IV.54 In 2021, buildings accounted for nearly 30 per cent of global final energy consumption and 27 per cent of total energy sector emissions (IEA 2022e). Digitalisation has significant potential to enhance user comfort in buildings while reducing overall energy use. The energy load of a building can be managed using active control systems that use real-time data from sensors. Wherever feasible, active controls should also integrate intelligently with building energy services sharing information to and from the grid, facilitating better electricity supply and demand management. Similarly, smart lighting in public places, notably street lighting, may also cut down energy use beyond the direct energy savings from the use of light emitting diode (LED) lamps, and by connecting streetlights to traffic lights and other traffic management tools. Policymakers and companies need to ensure that devices are able to provide and receive information using open-source or compatible software to allow for interoperability across technologies. Supportive policy frameworks, such as bulk procurement of energy-efficient technologies and white certificates10 can help by driving down product costs and ensuring that those technologies deliver energy savings. Industries IV.55 Industry accounts for 38 per cent of global final energy consumption and around one-fourth of total CO2 emissions (IEA, 2022f). Proactive Government policies in this regard may help small and medium-sized enterprises, that may not have had so far sufficient exposure to these technologies. The adoption of energy management systems such as ISO 50001 – the global standard for energy management – is driven by Government policies or incentives in many countries. Climate-resistant Agriculture/Infrastructure IV.56 Agriculture globally accounts for 25 per cent of GHG emissions, with four per cent contribution to global GDP. Adapting suitable technologies for climate change mitigation measures in agriculture is important as it still accounts for a large share of income in many low-income countries, absorbing a sizeable proportion of the labour force. Climate Smart Agriculture (CSA) practices have been recognised globally for developing sustainable agri-food systems, in line with the Food and Agriculture Organisation (FAO) Strategic Framework 2022-2031. IV.57 Technological advancements in agriculture at various phases of the crop life cycle through Integrated Pest Management (IPM), Conservation Tillage and Enhanced Nutrient Management are crucial and should be promoted through public investment for long-term sustainability. Furthermore, awareness about the role of precision agriculture techniques for mass agricultural production should be further enhanced as empirical studies show that it can reduce the amount of chemicals required for optimum cultivation and reduce the level of nitrogen residue (Bongiovanni et al., 2004). IV.58 The relevance of these new agricultural technologies has increased in India due to growing climatic events like erratic rainfall, cloudbursts and heat waves. Many start-ups in the agri-tech space are providing sustainable solutions for improving farm productivity, reducing crop losses, better crop storage and lowering dependence on water and weedicides. The advancements in methods of agricultural practices may bring about substantial environmental benefits such as increased water retention capacity and accumulation of organic carbon. IV.59 Enhanced usage of technologies such as mapping and surveying, airborne laser scanning, satellite remote sensing, tide gauges, satellite altimetry and GPS could help develop robust climate change adaptation mechanisms to minimise the impact of these shocks. Building a climate-resistant infrastructure network is also important given its spillovers to other sectors of the economy. A study on the potential impact of a major flood in Paris found that the infrastructure sector could bear 30 to 55 per cent of the direct cost of flood damage (OECD, 2018). Resilient infrastructure networks are key for reducing direct losses and negating the challenges posed by climate vulnerabilities. India’s aspirations to build a strong infrastructure network are reflected in recent initiatives such as the National Infrastructure Pipeline, the National Logistics Policy and GATI Shakti. India has spearheaded the global initiative for robust regional disaster management systems by launching the Coalition for Disaster Resilient Infrastructure (CDRI) (Das, 2023). 4. Trade Policy IV.60 Since the mid-1980s, with the rise of globalisation, EMEs have seen a rapid increase in production-related carbon emissions, in part due to production for exports (Chart IV.11). International carbon emission transfers (from AEs to EMEs) increased much faster than growth in international trade and GDP in the 1990s and early 2000s; however, they have been declining since 2006 (Peters et al., 2011). Notwithstanding the distinct deglobalisation since 2018 driven by geo-economic forces, emission transfers through trade remain a major challenge. IV.61 International trade leads to GHG emissions in multiple ways and measuring the overall impact of trade on carbon emissions is a complex task. Over the past decades, GHG emissions from production and transport of traded goods and services have increased. There has been growing evidence suggesting that increasing global trade may lead to environmental degradation (Abman and Lundberg, 2020). It is estimated that 20-30 per cent of GHG emissions have been due to international trade (WTO, 2021). Economic growth and productivity increases have been regarded as the potential gains from trade liberalisation, but the impact of such liberalisation on the environment is debatable (Grossman and Krueger, 1995).  IV.62 While AEs tend to be net importers of GHG emissions, EMEs and commodity-dependent economies tend to be net exporters (WTO, 2021). Policy initiatives and advancements in environmental and energy efficiency technologies can reduce GHG emissions associated with production for exports and their transportation. In this context, international trade can play a crucial role in diffusing green technologies and improving carbon efficiency by (i) focusing on green and clean energy products in regional trade agreements; (ii) reducing the carbon content of international trade and (iii) promoting environmental quality standards and eco-labelling. Climate change focus in regional trade agreements IV.63 Regional trade agreements (RTAs) have generally proliferated with the recent geo-economic shifts and the preference for friend-shoring. Currently, 355 RTAs are in force worldwide, covering more than half of total international trade (WTO, 2022). Traditionally, the primary focus of RTAs has been on lowering tariff and non-tariff barriers to trade; however, there has been an increasing tendency towards the inclusion of environment-related provisions. RTAs, by including environmental provisions, can serve twin objectives – avoid adverse impact of trade liberalisation on the environment and promote trade of green goods. IV.64 Broadly, the following areas have been identified for inclusion of necessary environmental provisions in trade agreements – removal of tariff and non-tariff barriers on green goods and services; clauses regarding environmentally harmful/beneficial subsidies; border adjustment carbon taxes; green procurement; international cooperation on climate change goals; and regulatory coherence (The Economist, 2019; J Ferrante, 2016). Almost 97 per cent of all RTAs notified to the WTO include at least one environmental provision (WTO, 2022a). IV.65 India has so far signed 14 Free Trade Agreements (FTAs) with its trading partners. In addition, it has signed 6 limited coverage Preferential Trade Agreements (PTAs). The TREND database covers PTAs signed up to 2021 and includes information on 16 agreements signed by India. On average, each PTA in India contains around 12 environmental provisions. An examination of the environmental provisions in India’s PTAs reveals that around 70 per cent of these provisions are only in 3 PTAs, with Singapore, Japan and South Korea. Most of the Indian PTAs include provisions on the conservation of natural resources, general exceptions for trade in goods if they are related to the life (health) of animals and/or plants, etc. Many relevant environmental provisions, such as commitments to enforce domestic environmental measures, promote production of renewable energy and energy efficiency and dispute settlement mechanisms which are present in most of the other countries’ PTAs are either missing or are present only in one or two of India’s PTAs (Table IV.7). IV.66 India’s recently signed PTAs are more comprehensive and include provisions relating to the environment. For instance, a reference to environmental protection is included in the preamble to India’s agreements with the UAE and Mauritius. Going forward, India’s future agreements are expected to cover more detailed climate and sustainable development provisions, given the emphasis being put by potential FTA countries/regions such as the UK, Canada, and the EU on climate change. Environmental provisions in trade agreements can be effective in improving environmental welfare, but they need to be specific and legally binding (Brenton and Chemutai, 2021). | Table IV.7: Environmental Provisions in Most of the Global PTAs | | | Description of Provision | Presence in India’s PTAs | | 1 | Conservation of natural resources | ✓ | | 2 | General exceptions for trade in goods if relate to the life (health) of animal/plant | ✓ | | 3 | Norms relating to technical barriers to trade | ✓ | | 4 | Sanitary and phytosanitary measures and environment | ✓ | | 5 | Implementation of obligations found in other environmental agreements (such as commitments at the Rio Summit, Millennium Development Goals, etc.) | ✓ | | 6 | Environment reference in preamble | ✓ | | 7 | Coherence with domestic trade or investment policies | ✓ | | 8 | Level of environmental protection such as not relaxing environmental measures to encourage trade | × | | 9 | Sovereignty in determining own environmental policies | × | | 10 | Conservation of forests | × | | 11 | Promote production of renewable energy and energy efficiency | × | | 12 | Interaction between energy policies/agriculture/transport and environment | × | | 13 | Binding obligations such as commitment to enforce domestic environmental measures | × | | 14 | Pesticides, fertilisers, toxic or hazardous products and chemicals | × | | 15 | Contact point on environmental matters | × | | 16 | Establishment of an inter-Governmental committee | × | | 17 | Dispute settlement mechanisms | × | | 18 | Education or public awareness for environmental protection | × | | 19 | Joint scientific cooperation on environment protection including monitoring/assessment | × | | 20 | General obligation to exchange information related to the environment including provision of information when taking measures to protect the environment | × | | 21 | Exclusion of environmentally harmful inventions from patentability | × | | 22 | Technical assistance, training or capacity-building provided to another party for environmental protection | × | | Source: TRade and ENvironment Database (TREND). Morin, JF, A. Dür and L. Lechner (2018), “Mapping the trade and environment nexus: Insights from a new dataset”, Global Environmental Politics, vol. 18(1). | IV.67 India needs to use its RTAs to facilitate and promote export of goods and services required in the clean energy sector, where it has a comparative advantage. India is the highest ranked G20 country according to the Climate Change Performance Index 2023 and is also the fifth best performing country globally (RBI, 2023). Many Indian companies have aggressively expanded their investment in green sectors such as solar equipment manufacturing, green hydrogen production and energy storage, thereby increasing India’s export potential in a world that is increasingly becoming averse to importing carbon-intensive products. The Government’s Production Linked Incentive (PLI) scheme also promotes green investment by incentivising manufacturing of electric vehicles, solar photovoltaics, and automotive cell company (ACC) batteries. There is a need to link such incentive schemes with environment-related performance parameters (Box IV.3). Additional policy support through trade agreements would foster these efforts to increase green exports of the country. IV.68 EMEs face the challenge of identifying and avoiding the incorporation of protectionist measures under the pretext of environmental policy by their AE trade partners (The Economist, 2019). Therefore, EMEs, including India, need to develop and employ expertise while finalising future trade agreements so that effective provisions can be incorporated in the areas where synergies between trade and environmental objectives can be established while retaining autonomy on domestic environmental policy. Another daunting challenge for EMEs may emerge from the proposal to introduce a carbon border tax (CBT) by some of the AEs to restrict imports from countries having less stringent environment protection laws. Besides progressively reducing the carbon content of India’s export basket, FTAs should emphasise transfer of technologies that could facilitate green transition. Box IV.3
Green PLI: Exploring India’s Export Potential in Climate Friendly Goods (CFGs) On April 7, 2021, the government approved the Production Linked Incentive (PLI) scheme for high-efficiency solar PV modules. This is an important step towards gradually replacing fossil-fuel-derived energy with renewable energy. To explore India’s trade opportunities in 64 climate-friendly goods (CFGs) with India’s major trade partners, the CFGs are identified under 6-digit HS code following the Dinda (2013) approach. The sub-groups under CFGs are classified under various categories related to (i) clean coal technologies, (ii) wind energy; (iii) solar PV systems and (iv) energy-efficient lighting. The optimal mix of trade partners and product categories in CFGs is identified for boosting India’s export potential. India’s major trading partners since 2007 are examined using centroid clusters that best fit the data, applying the K-means clustering algorithm. By minimising within-cluster variation, the clustering method attempts to determine the centroid position from a cluster of data points.  The centroid coordinates are identified as (2.69, 0.07) and (-0.30, -0.01). In the case of cluster 1, it is observed that India’s exports share of CFGs is relatively high for those importing countries with whom India has a relatively lower overall export share. Whereas cluster 2 analysis reveals that, India exports share of CFGs is low with importing countries with whom India has a high overall exports share (Chart 1). The trade cluster analysis can provide insights on developing effective trade engagements to enhance India’s export prospects in a world that is increasingly differentiating imports based on their carbon content. References: Dinda, Soumyananda (2013): Climate Change Creates Trade Opportunity in India. Working Paper at A.K.Dasgupta Centre, Visva Bharati | Reducing carbon content of international trade IV.69 The amount of GHG emissions embedded in an economy’s international trade is determined by a broad range of factors, including the size of the economy, the sectoral composition of its foreign trade, its level of participation in global value chains (GVCs), the modes of transportation used for its imports and exports, and the energy efficiency of its production system, which depends in part on environmental and energy policies. IV.70 Carbon emissions embedded in production differ considerably across economies. EMEs tend to emit more emissions per unit of output than AEs (Box IV.4). With a few exceptions, indirect emissions embedded in production tend to be greater than direct emissions embedded in production. The amount of indirect emissions embedded in production tends to be higher in such economies that are particularly active in downstream supply chains. Conversely, economies active in upstream supply chains tend to have lower indirect emissions embedded in production. Box IV.4
Carbon Emissions Embedded in International Trade – India’s Perspective Total carbon emissions embedded in gross exports (around 9.7 gigatonnes of CO2) accounted for around 29 per cent of global emissions in 2018 (Source: TECO2 database, 2021 edition, OECD). While global carbon emissions have increased by approximately 57.3 per cent between 1995 and 2018, global emissions embedded in exports have risen by about 90 per cent over that period. Considering the carbon content of global trade, corrected for the size of trade flows, it is observed that CO2 emissions per unit of exports are considerably higher for the EMEs, while their imports emit comparatively less CO2 (Chart 1). An in-depth analysis of the sources of trade-related emissions and their evolution can help in devising efficacious emission-abatement policies. Net CO2 emission of exports are calculated as the difference between domestic CO2 emissions embedded in a country’s exports (EEE) and foreign CO2 emissions embedded in its imports (EEI) (Kim and Tromp, 2021). Further, a comparison between CO2 emissions and value-added in India’s trade can indicate the environmental costs and economic benefits of trade (Table 1). Net value-added is the difference between domestic value-added in the country’s exports (VAX) and foreign value-added in the country’s imports (VAM). 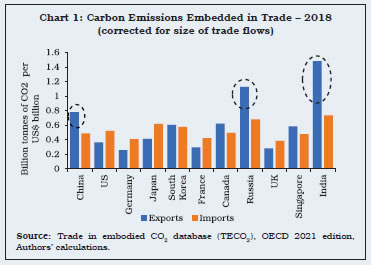

| Table 1: Implications of Net Emissions of Exports and Net Value Added | | Net emissions exports | Net value- added | Exporter/Importer | Implication | | NE > 0 | NV > 0 | Net emissions exporter, net value-added exporter | Incurring environmental costs but earning economic benefits from trade | | NE > 0 | NV < 0 | Net emissions exporter, net value-added importer | Incurring environmental as well as economic costs | | NE < 0 | NV > 0 | Net emissions importer, net value-added exporter | Earning environmental and economic benefits | | NE < 0 | NV < 0 | Net emissions importer, net value-added importer | Earning environmental benefits but incurring economic costs | | Source: Kim and Tromp (2021). | For most periods, EEEI > EEII implying NEI >0, i.e., India’s net exports add to carbon emissions. On the other hand, VAXI < VAMI implying NVI <0, i.e., India’s net value-added through trade is negative. Thus, India incurs both environmental and economic costs in its trade (Chart 2). Following Kim and Tromp (2021), emission intensity of value-added on exports (EIE) is assessed as a ratio of domestic emissions embodied in exports to domestic value-added of exports, and the emission intensity of value-added on imports (EIM) as a ratio of foreign emissions embedded in imports to foreign value-added of imports. EIEI = EEEI/ VAXI EIMI = EEII/VAMI. Net emissions intensity NEII = EIEI - EIMI If NEII > 0, India’s CO2 emissions generated by one unit of value-added on exports are more than the foreign CO2 emissions generated by one unit of India’s value-added on imports and vice versa. Both EIE and EIM have witnessed a downward trend, suggesting improvements in carbon emissions through net exports, but NEI still remains positive, indicating scope for further improvement (Chart 3). Trade policies in India, therefore, should consider encouraging exports in sectors with scope for improvement in domestic value addition and relatively lower embedded carbon emissions. References: Kim, T.-J., & Tromp, N. (2021). Analysis of carbon emissions embodied in South Korea’s international trade: Production-based and consumption-based perspectives. Journal of Cleaner Production, 320, 128839. https://doi.org/10.1016/j.jclepro.2021.128839 | IV.71 The current global tariff and non-tariff barriers are skewed in favour of dirty industries, thereby implicitly subsidising carbon emissions (Shapiro, 2021). Greening of trade would require focused attention on factors such as a review of country tariffs, removing biases favouring dirty sectors, reducing restrictions on access to environmental goods and services and environmentally preferable products; collective efforts for developing standards on carbon emissions embedded in products; promoting access to low-carbon technologies; international cooperation to ensure a coherent and predictable policy environment; and, mobilising adequate financial and technical assistance (WTO, 2022b). Environmental Quality / Eco-labelling IV.72 Environmental quality/eco-labelling is a market-based tool to encourage demand for and supply of products and services, which in turn could have a lower harmful impact on the environment over a product’s life cycle (WTO, 2003). Eco-labels can change consumer behaviour by guiding them towards more environment-friendly purchase decisions (Marrucci et al., 2019). For producers, labelling schemes can provide incentives to improve the environmental performance of products (Harris et al, 2021). They influence R&D activities for cleaner production methods and thereby promote innovation. IV.73 A large number of environmental labelling and information schemes (ELIS) have been introduced globally over the past few decades. For instance, the Ecolabel Index is the largest global directory of ecolabels that currently tracks 456 ecolabels in 199 countries across 25 sectors. In India, to increase the acceptance of environment friendly and sustainable products and services, the Bureau of Energy Efficiency (BEE) has been tasked with enhancing the energy efficiency of appliances, and the Bureau of Indian Standards (BIS) for setting safety, quality and performance parameters of products. IV.74 A growing number of such schemes globally tends to increase compliance costs for producers and thus affects their competitiveness (OECD, 2021c). Multiple schemes may also create confusion and loss of credibility for consumers. Such measures sometimes create a hindrance to free trade by effectively acting as a non-tariff barrier. Therefore, there is a need for promoting an internationally harmonised ecolabelling system to promote sustainable development without putting an unnecessary burden on producers and consumers. IV.75 The available literature also suggests that multiplicity of standards, complexity of the certification process and its costs, regulatory compliance costs, and the lack of certainty about financial benefits exclude small-scale producers in EMEs from accessing standards-compliant markets (UNCTAD 2022). Therefore, small or medium scale producers should be provided with sufficient handholding while pursuing the sustainable growth objective through the instrument of eco-labelling. 5. Regulatory Measures IV.76 Even as fiscal resources are expected to be at the forefront for meeting the financing requirements of the national green transition strategies, with the growing investor appetite for contributing to the private sector green initiatives/ projects, financial sector regulatory realignments have become essential to provide a congenial environment to facilitate higher flow of resources for a greener economy. In this vein, eight institutions from four continents started the Network of Central Banks and Supervisors for Greening the Financial System (NGFS) in December 2017. The NGFS has 125 members as of March 2023. IV.77 Addressing climate-related risks entails four main building blocks – disclosures, data, vulnerability analysis and regulatory/supervisory practices and tools (RBI, 2022a). The fourth block is where the regulators and supervisors have a role, transcending the work of the prior three blocks. Regulations and supervision aim at making the industry future-ready to: (i) bear the climate events resiliently without upending financial stability; and (ii) become the main purveyor of financing for adoption of technologies that can lead to a low carbon economy and help meet the national commitments. A major aspect of the regulatory realignment is sensitisation and cognisance of climate-related risks in the organisational strategy, governance, risk management and assurance functions of the financial services firms and integrating those risks into the existing prudential frameworks. IV.78 The Reserve Bank had in December 2007 advised banks to put in place a Board-approved plan of action towards helping the cause of sustainable development. It brought out a discussion paper on climate risk and sustainable finance in July 2022, which was preceded by a survey of banks in January 2022. The feedback received on the discussion paper has been examined. On April 11, 2023, the Reserve Bank announced a framework for acceptance of green deposits11 to foster and develop the green finance ecosystem in the country. Guidelines on: (a) disclosure framework on climate-related financial risks; and (b) guidance on climate scenario analysis and stress testing, are expected in due course. The Reserve Bank is setting up a dedicated webpage on its website to host all instructions, press releases, publications, speeches and communication on climate risk and sustainable finance. IV.79 Corporate social responsibility (CSR), which had its genesis in the voluntary approach of “doing good” is also a part of the regulatory toolkit since the Government has legislated it as a mandatory compliance. The CSR legislation is a tool to hasten the green transition as it guides the corporate sector to undertake activities that generate positive externalities. Green Finance IV.80 Green finance comprises financing of green investments and policies that promote mitigation or adaptation (Lindenberg, 2014). The cumulative total expenditure for adapting to climate change in India is estimated to be ₹85.6 lakh crore (at 2011-12 prices) by the year 2030 (MoEFCC, 2022). IV.81 Central banks as financial regulators have several policy instruments at their disposal to influence investment decisions and the allocation of resources and credit to achieve the sustainability targets (Dikau and Volz, 2018). Central banks can mandate banks and other financial institutions to consider climate and environmental risks through regulation which could be in the form of: (i) disclosure requirements – as mandatory disclosure requirements pertaining to climate-related risks of banks may prevent misallocation and mispricing of assets and sharp price corrections in the future; (ii) environment risk management – mandating financial institutions to incorporate environment risk factors in their risk management process; and (iii) green asset ratio (GAR), i.e., the proportion of total assets invested in sustainable projects or economic activities – prescribing financial institutions to maintain a minimum threshold level. These may help divert the flow of finance from carbon-intensive sectors to green projects. A study finds significant reduction in fossil fuel holdings of financial institutions in France following the imposition of detailed reporting requirements of climate-related risk exposure and efforts to mitigate climate change (Nguyen and Mésonnier, 2021). IV.82 A taxonomy of green finance can help the funding institutions in analysing better the climate risk in their loan portfolios, enhancing green financing while lowering the risk of greenwashing12. A more robust network of third-party verification, impact assessment and rating the green credentials of businesses, projects and instruments could mitigate greenwashing concerns, while also facilating increased funding at lower cost. IV.83 In this regard, recent regulatory measures related to green bonds in India assume significance. The Securities and Exchange Board of India (SEBI) has issued guidelines that objectively define the purposes for which funds can be raised through ‘green debt security’ and the scope has been enhanced to include pollution prevention and control; circular economy; and eco-efficient products (SEBI, 2023a). Within the ambit of green debt security, sub-categories have been introduced: (a) blue bonds, related to water management and the marine sector; (b) yellow bonds, related to solar energy; and (c) transition bonds, related to transitioning to a more sustainable form of operations, in line with India’s Nationally Determined Contribution (NDC). The SEBI has also outlined dos and don’ts to address concerns related to greenwashing (SEBI, 2023b). IV.84 The regulations governing issuance of green debt securities have been tightened. An issuer desirous of issuing green debt security is required to make additional disclosures in the offer document, such as details about the decision-making process followed to determine the eligibility of projects/assets for which funds are being raised; systems/procedures to be employed for tracking the deployment of the proceeds of the issue; intended types of temporary placement of the unallocated and unutilised net proceeds from the issue of green debt securities; details on alignment of the objective with India’s NDC in case of the proceeds raised through the issuance of transition bonds, among several others. Further, an issuer with listed green debt securities is required to make additional disclosures related to the utilisation of the proceeds of the issue, details of unutilised proceeds, qualitative performance indicators and, where feasible, quantitative performance measures of the environmental impact of the projects/assets (SEBI, 2023c). These additional disclosures are expected to improve the sustainable finance landscape in the country by enhancing public trust in the utilisation of funds for their intended uses. Macroprudential Norms IV.85 Macroprudential regulation aims at mitigating systemic risks in the financial system. One method to achieve this is through expanding the stress testing framework of banks to include the potential impact of climate-related events on their balance sheets. IV.86 The main objective of bank capital regulation is to safeguard a bank’s balance sheet in scenarios of unforeseen adverse shocks and reduce the overall risks to financial stability13. As a regulatory policy instrument, several regulatory institutions have advocated relaxing risk weights for sectors with low carbon footprints to incentivise banks to extend more credit to those sectors (Gelzinis, 2021). A few studies have also suggested introducing an ‘environment coefficient’ which would help to internalise the pollution risk of the borrower. Therein, a bank’s asset is weighted by the extant prudential regulation weight and then multiplied by an environment coefficient, thus determining an environment-risk weighted asset (Esposito et al., 2019). A coefficient value of 1 is considered the benchmark between the green and brown sectors – the green sector takes a value between 0.5 and 1 and the brown sector takes a value between 1 and 1.5. This can incentivise banks, particularly those facing a higher cost of regulatory capital, to allocate more loans to green sectors. This loan adjustment towards the green sector can help in accelerating the pace of transition to a low-carbon economy. IV.87 There are, however, certain issues with capital regulations. A few studies argue that these are short-term risk management tools to absorb unforeseen losses. These losses are based on the Value-at-Risk approach that uses high-frequency historical data whereas climate events are not as frequent to estimate the Value-at- Risk associated with adverse climatic situations (Coelho and Restoy, 2022). Moreover, it has not been fully established that low-carbon projects are less risky. Reducing weights for these projects might deteriorate the asset quality of banks’ loan portfolios and increase their fragility. Therefore, Pillar I capital regulation may not be appropriate to manage both financial stability and financing green sectors. IV.88 Another possible policy instrument could be the green supporting factor (GSF). The GSF relaxes the capital requirement for investments in the green sector. It, however, suffers from the same limitation that green investments may not be less risky. Another risk that banks face is downgrade of ratings due to investment in environmentally risky assets. That could raise the external risk-premium of both equity and debt. As a result, it may reduce the profitability of banks. Since retained earnings form a part of reserves, which, in turn, constitute tier-1 capital of banks, GSF may alter the adequacy of capital base to mitigate short-term credit losses. As an example of this policy design, the European Commission introduced a ‘Small to Medium Enterprise (SME) supporting factor’ tool to increase lending to SMEs, but there is little evidence that it fulfilled the objective. The same argument also holds for GSF, whose design is based on unproven previous policy tools and limits its appeal as an instrument to incentivise banks to lend to the green sectors. IV.89 Less capitalised banks that face a relatively higher cost of raising external regulatory capital could get an incentive to invest in green projects to abide by the capital requirement. Although these banks could help the economy to transit to a low-carbon equilibrium, it may also amplify their fragility and increase systemic risk. Hence, environment-adjusted risk-weighted assets and GSF can only be implemented if the green projects are relatively less risky. Capital regulation and GSF can be complemented with close monitoring and supervision to attenuate the financial risks that are generated in loan portfolio adjustment (Baranovi et al., 2021). The Prudential Regulation Authority (PRA) of the Bank of England (BoE) recommends further work on the design and calibration of the regulatory capital to reduce the unintended consequences of green bank capital regulation (PRA, 2021). The PRA requires entities to provide details on their adapted stress testing calculations and methodologies to assess whether assumptions, judgements, and factoring of output in firms’ decision-making are appropriate. IV.90 Prior to the implementation of the green capital regulation, the non-performing assets (NPAs) in the banking system need to be reduced to alleviate potential financial risk. If green capital regulation amplifies NPAs, it could impede monetary policy transmission (John et al., 2016; Muduli and Behera, 2021). Hence, comprehensive disclosure of information related to climate risks and incorporating these risks in banks’ Internal Capital Adequacy Assessment Process (ICAAP) under Pillar 2 are a few policy tools that may incentivise regulated entities to extend credit to sectors with lower climate risk. IV.91 Another method is to prescribe exposure limits. Imposing a ceiling on the exposure of banks to carbon-intensive industries to limit the flow of resources to the polluting sectors could free up resources for the green sectors. Corporate Social Responsibility (CSR) Norms IV.92 The Ministry of Corporate Affairs had issued the ‘Voluntary Guidelines on Corporate Social Responsibility’ in 2009 which were further refined as ‘National Voluntary Guidelines on Social, Environmental and Economic Responsibilities of Business’, 2011. The voluntary guidelines were subsequently converted into mandatory CSR provisions in Section 13514 of the Companies Act, 2013. IV.93 The total CSR expenditure at ₹26,190 crore in 2020-21 was more than double the value in 2014-15, registering a compound annual growth rate of 17.3 per cent. While education and health care have attracted a significant share of the CSR expenditure, flow of funds towards environmental sustainability has also increased, albeit at a slower pace (Chart IV.12). IV.94 A major chunk of the CSR expenditure is concentrated in a few states such as Maharashtra, Gujarat, Karnataka and Tamil Nadu. States like Bihar have received a minuscule amount in direct CSR expenditure. While the concentration of industries and corporate houses in a few States is the likely reason for the lopsided nature of CSR expenditure, a higher geographical diversification is desirable.
IV.95 The top ten companies, in terms of CSR expenditure incurred, account for around one-fifth of the total (Chart IV.13a). An encouraging trend is the rise in the share of companies reporting higher CSR expenditure than prescribed for statutory compliance (Chart IV.13b). IV.96 While developments in the CSR space have been encouraging; there is scope for further improvement. First, since industries and corporate houses are concentrated in a few States, there is an inequitable geographical spread of CSR spending. Section 135 of the Companies Act recommends that “the company shall give preference to the local area and areas around it where it operates, for spending the amount earmarked for CSR activities”. It is proposed that geographical diversification in CSR spending for companies with large CSR budgets may be mandated by law. Second, the current CSR rules do not allow CSR in activities undertaken by companies in pursuance of their normal course of business, which restricts them from using their natural expertise in conducting socially responsible business. It is proposed that companies may be allowed to pursue CSR activities in their business operation domains. Third, while the entries in Schedule VII, Section 135 of the Companies Act (activities that companies may include in their CSR policies) are to be interpreted liberally, it is proposed that the list be rationalised to a few broad areas, as certain companies may find the current list prohibitive (Sinha, 2021). Fourth, CSR rules allow multi-year projects with timelines not exceeding three years, excluding the financial year in which the project commenced. This incentivises companies to avoid long-term projects (say afforestation), which may require a more extended period of regular funding. Fifth, firms/companies operating in relatively polluting sectors may be encouraged to use a part of their CSR obligations to adopt climate-friendly technologies/processes. CSR – the First Mover Group IV.97 A firm that invests in socially responsible activities ahead of its competitors can reap the benefits of the first-mover advantage. As per the available literature, firms in a duopoly with horizontally differentiated products can influence the willingness of the consumers to pay a higher price by investing in socially responsible activities. If the CSR investment spills over to the follower, the latter can benefit from the second-mover advantage through increase in sales (Kopel, 2021). IV.98 Through CSR activities, a profit-maximising firm can achieve competitive advantage by focusing on customers with social preferences and a higher willingness to pay. Thus, the market itself offers incentives to make the economy green. The first-mover advantage, however, dissipates with every firm turning green, making winners out of companies that have the best execution (The Economist, 2008). Strict environmental regulations force companies to develop greener technologies, and thus promote innovations that may offset or even exceed the costs of regulatory compliance (Porter and Linde, 1995). Strict regulations lead to technological learning and trigger innovations that generate new areas of specialisation (Brandi et al., 2020). IV.99 India was the first country in the world to make CSR mandatory (Samantara and Dhawan, 2020). The inclusion of the CSR mandate in the Companies Act, 2013 was a major step in engaging the corporate sector in the equitable development of the country. CSR results in fulfilling the triple objectives of profits, protection of the environment and fight for social justice or what is known as the triple bottom line. To make CSR meaningful, there is a need to internalise such activities and make them part of a company’s development strategy. In India, the primary challenge in assessing the success of CSR lies in the lack of reliable indicators of progress (Kumar and Ruhela, 2021). Further, there is a need to publicise the gains that can accrue to companies in terms of the first mover advantage. Energy and Climate Ranking of States by NITI Aayog IV.100 In 2022, the NITI Aayog released the State Energy and Climate Index (SECI) to track the efforts made by the States and UTs in the climate and energy domains. The index has been designed to assess and identify the scope for improving the performance of States and to help them efficiently manage their energy resources. IV.101 Besides high dependence on imports, especially for crude oil, the energy sector accounts for a dominant share of the total GHG emissions of India. Therefore, a paradigm shift is required towards clean energy, with the twin objectives of ensuring affordable and reliable energy to all and reducing dependence on fossil-based energy by accelerating the clean energy transition. To achieve these two goals, the Government is focusing on downstream delivery to improve the transmission and distribution infrastructure and the financial position of the electricity distribution companies (DISCOMs); enhance access to clean and affordable cooking fuel; and ensure 24*7 supply of electricity. All these efforts require differential planning and execution. In the spirit of cooperative and competitive federalism, awarding ranks to measure a State’s initiatives can play an important role in improving the country’s performance in green transition. This will also be useful for the policymakers and the state authorities in identifying the leaders and the laggards in the energy sector and in fine-tuning policies by benchmarking against the best. The index consists of 6 parameters which are built from 27 indicators (Table IV.8). | Table IV.8: Composition of State Energy and Climate Index (SECI) | | Parameters | Weightage (Per cent) | Sub- indicators | | DISCOMs’ performance | 40 | 9 | | Access, affordability, and reliability of energy | 15 | 5 | | Clean energy initiatives | 15 | 3 | | Energy efficiency | 6 | 3 | | Environmental sustainability | 12 | 4 | | New initiatives | 12 | 3 | | Source: NITI Aayog, 2022b. | IV.102 The scores and ranks are presented separately for large States, smaller States, and UTs (Chart IV.14). The top performers like Gujarat, Punjab and Goa have done well in DISCOMs’ performance parameter by addressing the issues of reducing the debt-equity ratio, aggregate technical and commercial losses, and complexity of tariffs. In terms of clean energy initiatives, Chandigarh, Delhi and Goa have performed well as they have been able to pivot towards clean cooking fuel supply, renewable energy generation and CNG vehicles. Tamil Nadu and Maharashtra have done well in terms of energy efficiency by pushing for adoption of the Energy Conservation Building Code and nudging for industrial energy savings. Tripura and Delhi have higher scores in the new initiatives parameter on account of higher EV penetration and shifting consumers to smart meters. 6. Market-based Solutions IV.103 With ‘abatement’ as the new catchphrase, there is a movement afoot to lower carbon footprints, even by the traditionally large emitters. The market is also actively adopting sustainability, guided not just by altruism but also in search of higher return. This has sparked a trend towards decarbonisation and digitalisation, nudging the market to come out with tools like environmental, social and governance (ESG) ratings for corporates and debt/equity funds guided by ESG principles. Moreover, in recent years, private equity (PE) firms – the bedrock of capitalism – have become sensitive to ESG factors in allocating their investment. ESG Rating of Financial Instruments and Entities IV.104 There is a growing recognition that companies do not function in isolation; they are both affected by, and, in turn, affect environmental and societal factors. These factors impact firms’ performance and sustainability. Therefore, there is a need to measure and evaluate a company’s performance on ESG parameters, in addition to financial performance. A heartening development is that Indian companies are increasingly matching their growing ESG concerns with actions to support green transition (Box IV.5). Box IV.5
Do Indian Companies Walk the Talk on ESG? The importance of Environmental, Social and Governance (ESG) factors has grown rapidly over the last decade, becoming a prominent agenda item at company board meetings and in corporate communications. The rising focus on sustainability by customers and growing investor preference towards ESG-compliant investment products have ensured that companies are increasingly vocal about ESG-related aspects in their management commentary, as evident from several studies which have gauged this trend using text-mining techniques (Kiriu and Nozaki, 2020; Castellanos et al., 2015; Ho et al., 2021). Nevertheless, critics have pointed out the scope for divergence between the words of corporates and their actions. As corporates try to establish goodwill, their communication may emphasize ESG, without corresponding changes in their activities and performance, akin to greenwashing. An exercise was carried out to assess whether the evolution of Indian companies’ ESG communication over the years has been accompanied by an improvement in their ESG scores. The evolving ESG focus of Indian companies is examined by analysing the annual reports of 50 large-cap companies since 2012-13. These companies are mostly part of the NIFTY-50 index15. The 491-word ESG dictionary compiled by Baier et al. (2020) is used to compute the share of such words in companies’ annual reports. The historical ESG scores from Refinitiv16 are used to proxy companies’ actual performance on ESG parameters. The average ESG scores of Indian companies have improved over the last decade, especially for the Environmental and the Social pillars, while the score for the Governance pillar has fluctuated (Chart 1). The rise in the share of ESG-related words in the companies’ annual reports has corresponded with the encouraging trend of improvement in performance-based metrics. 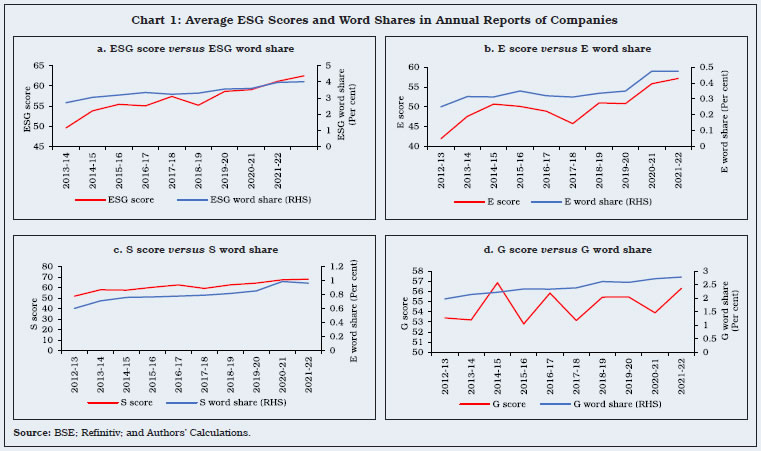 To examine whether companies that talk more about ESG show better ESG performance, the following panel data regression model (with time- and industry-fixed effects) is estimated covering data for the period 2012-13 to 2021-22: where, ESG is the ESG score, W is the ESG word share (in per cent) in the annual report, M is the market capitalisation (proxy for the firm’s size) and D and S are indicators for the year and the industry of operation, respectively. It is found that with higher usage of ESG-related terms, the ESG scores also increase (Table 1). This result holds even after controlling for market capitalisation, industry-specific dummies, and different model specifications. The empirical evidence shows that firms placing greater emphasis on ESG in their communication also tend to be better ESG performers. In this context, it would be interesting to see how the new reporting requirements introduced by SEBI, in conjunction with the law on CSR, would impact the companies’ ESG performance. | Table 1: Regression Results Dependent Variable: ESG Score | | | (1) | (2) | (3) | (4) | (5) | (6) | | ESG Word Share | 3.779** | 3.762** | 3.491** | 3.369*** | 3.737*** | 3.838** | | | (1.598) | (1.602) | (1.619) | (0.935) | (1.166) | (1.916) | | Log of Latest Market Capitalisation | | 3.677* | 3.390 | | | | | | | (2.231) | (2.337) | | | | | Log of Market Capitalisation | | | | | 1.125 | 0.945 | | | | | | | (1.174) | (1.830) | | Intercept | 37.751*** | -50.065 | -51.036 | 39.629*** | 21.809 | 19.194 | | | (5.971) | (53.204) | (57.166) | (2.882) | (15.935) | (24.888) | | Sample Size | 431 | 431 | 431 | 431 | 306 | 306 | | No. of Firms | 50 | 50 | 50 | 50 | 35 | 35 | | Individual-specific Effects | Random | Random | Random | Fixed | Fixed | Random | | Year Fixed Effects | Yes | Yes | Yes | Yes | Yes | Yes | | Sector Fixed Effects | No | No | Yes | No | No | Yes | | Errors | Robust | Robust | Robust | Clustered | Clustered | Robust | Notes: 1. Hausman test lends support to random effects specification.
2. ***: significant at 1 per cent, **: significant at 5 per cent, *: significant at 1 per cent.
3. Standard errors in parentheses. | References: Baier, Philipp, Marc Berninger, and Florian Kiesel (2020) “Environmental, Social and Governance Reporting in Annual Reports: A Textual Analysis”, Financial Markets, Institutions & Instruments 29, No. 3. Castellanos, Arturo; Parra, Carlos; and Tremblay, Monica, “Corporate Social Responsibility Reports: Understanding Topics via Text Mining” (2015). AMCIS 2015 Proceedings. Ho, Jerry C., Ting-Hsuan Chen, and Jia-Jin Wu (2021) “Are Corporate Social Responsibility Reports Informative? Evidence from Textual Analysis of Banks in China” China Finance Review International 12, no. 1. Kiriu, Takuya, and Masatoshi Nozaki (2020) “A Text Mining Model to Evaluate Firms’ ESG Activities: An Application for Japanese Firms” Asia-Pacific Financial Markets 27, No. 4. | IV.105 The ESG rating agencies assess companies across geographies/industries on their custom-defined templates to evaluate a firm across the ESG pillars and assign a rating to it. The coverage of Indian companies by the major global ESG rating providers (ERPs) is limited. The India ESG leadership summit report, however, covered 586 companies (CRISIL, 2022). An analysis of the ESG scores for Indian companies in major sectors reveals that information technology (IT) companies expectedly have the highest average ESG scores, while transport infrastructure companies have the lowest scores (Chart IV.15). Component-wise analysis of ESG scores found the highest degree of variation in the environmental score, both within and across sectors. IV.106 On the relationship between firm-specific characteristics and ESG performance, it is found that firms with higher market capitalisation have higher ESG scores (Chart IV.16a). When the sample is reduced to include only large firms, the relationship between market capitalisation and ESG score becomes even more prominent (Chart IV.16b). This shows that a firm’s growth and perceived valuation by the investors is inherently correlated with its performance on the ESG parameters. A good performance on the ESG parameters is a reflection that the firm can minimise its risks on the ESG front, enabling it to grow and also get rewarded by the investors. Also, a large company has more resources at hand to improve its performance on the ESG front, and has greater stakes, driving it to make investment that mitigates risk from ESG-related events. 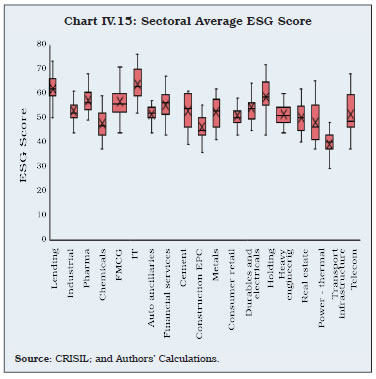
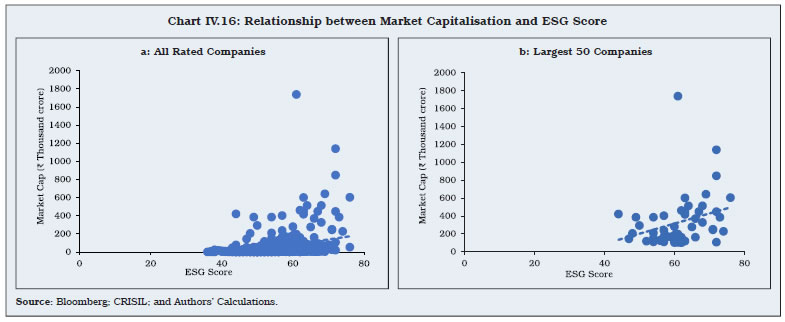 IV.107 As financial market participants become increasingly interested in ESG-related aspects, the role and influence of ESG ratings and data providers is growing. These entities have, however, come under increased scrutiny in recent times. The International Organization of Securities Commissions (IOSCO) in its report on ESG Ratings and Data Products Providers has highlighted issues such as: (a) lack of clarity/ alignment on definitions, including on what exactly the ratings measure; (b) lack of transparency about the methodologies behind the ratings/data products; (c) uneven coverage of rating products offered; and (d) concerns about the management of conflicts of interest when the ratings and data product providers, or their closely associated entities, perform consulting services17 for the client companies (IOSCO, 2021). IV.108 Two major concerns on the methodology employed for computation of the ESG scores are: (i) Most ESG ratings include too many parameters leading, at times, to a convoluted picture making it tough for the average investor to understand what the aggregate ESG score stands for; and (ii) The arithmetic average is mostly employed for aggregation of different parameters to compute the ESG rating. It corresponds to viewing E, S and G scores as perfect substitutes, allowing a company the flexibility to mask its poor performance in one parameter by focusing on good performance in others. IV.109 With each ERP using its own proprietary system, algorithms, metrics, definitions, and sources of non-financial information, there is scope for wide variations in the ESG ratings of the same firm by different providers (Chatterji et al., 2016). An analysis by Bloomberg found that an ESG rating upgrade for many companies was rarely accompanied by their record on sustainability (Simpson et al., 2021). IV.110 Further, research has shown that an ESG rating agency’s underlying bias or the overall view of a firm has an influence on the ESG rating provided to the firm (Berg et al., 2019). Also, the precision and efficiency of ESG ratings cannot be evaluated by commonly used procedures like back-testing, due to the absence of simple observable outcome variables such as default events (Erhart, 2022). These issues and the absence of an appropriate regulatory regime to oversee the methodology or data collection process, further undermine the credibility of ESG ratings. IV.111 The ESG scores of firms located in EMEs are found to be systematically lower than those in AEs (IMF, 2022b). This is partly explained by the treatment of missing data on certain parameters. The absence of a globally agreed reporting format makes ERPs adopt parameters which are most widely reported and relevant for the AEs, thus putting the firms in the EMEs at a disadvantage. IV.112 The IOSCO has recommended that regulators should focus their attention on ESG ratings and data products providers. Standardised definitions of the terminologies and written policies and procedures would enable the ESG ratings and data products providers to generate high quality data. Public disclosures of their methodologies and processes would help achieve transparency. The entities being assessed should streamline their disclosure processes for sustainability-related information in accordance with the applicable regulatory and other legal requirements (IOSCO, 2021). IV.113 Following the nudge from the IOSCO, several securities market regulators are updating their guidelines on ESG ratings and data products providers. An ESG rating/score is only as good as the data used to arrive at it. Standardised and regular company disclosures are, therefore, of utmost importance. SEBI took the first step towards making ESG reporting a part of regulatory reporting in 2012, when it mandated the top 100 listed entities by market capitalisation to file Business Responsibility Reports as part of their annual reports. This requirement was progressively extended to the top 500 listed entities in 2015 and to the top 1000 in 2019. IV.114 SEBI has now introduced a revamped disclosure framework, titled the Business Responsibility and Sustainability Report (BRSR), which aims to put more emphasis on quantifiable metrics (SEBI, 2021). This, in turn, would allow easier measurement and comparability across companies, sectors and time. The BRSR seeks disclosures from listed entities on their performance against nine principles of the ‘National Guidelines on Responsible Business Conduct’. Reporting under each principle is divided into essential and leadership indicators. The essential indicators are required to be reported on a mandatory basis, while the reporting of leadership indicators is voluntary. Filing of BRSR is compulsory for the top 1000 companies by market capitalisation from 2022-23. This should result in better data quality on ESG parameters. IV.115 Further, SEBI has introduced a framework of BRSR core which consists of select key performance indicators under each of the E, S and G attributes aimed at enhancing credibility and investor confidence in the ESG-related disclosures. This is to be achieved by verification of the reported data by an assurance provider. The BRSR core will have to be filed by the top 150 listed entities from 2023-24 and will be progressively extended to the top 1000 by 2026- 27. Further, based on disclosures in the BRSR core framework, the ERPs will publish a core ESG rating based on assured/verified data. To curb greenwashing at the scheme level by mutual funds (MFs), the regulator has mandated that an ESG scheme shall invest at least 65 per cent of its assets under management (AUM) in companies, where assurance on BRSR core is undertaken. Further, to get a complete picture and account for ESG footprints associated with the value chain of a company, SEBI has introduced ESG disclosures and assurance as per BRSR core, for the supply chain of top 250 companies on a “comply-or-explain” basis from 2024-25 and 2025- 26, respectively (SEBI, 2023d). IV.116 Regulators can identify the ESG leaders and standardise some of the practices and processes adopted by them as mandated regulations over time. This can allow the regulation formulation process in the ESG space to be well-tested and have wider acceptability. IV.117 A framework after incorporating recommendations from all the stakeholders including relevant ministries, industry associations, environmental policy advocacy groups, and other regulators including the Reserve Bank will help address the major issues plaguing ESG ratings. SEBI is establishing a regulatory framework and a code of conduct for ERPs which covers a range of pertinent concerns related to business models, accountability and transparency in the rating process (SEBI 2023e; SEBI 2023f). ESG Funds IV.118 The first ESG Fund in India was launched by the SBI Mutual Fund in 201718. The onset of the pandemic gave a major impetus to ESG funds across the world, including India. While it led to the launch of 8 new funds with the ESG theme, the AUM of ESG funds more than quadrupled in less than two years to ₹13,146 crore as on December 31, 2021. There was, however, stagnation in asset growth thereafter, driven not just by decline in valuation but also net outflow of ₹1,393 crore in 2022-23. As a result, the AUM of ESG funds declined to ₹10,427 crore as on March 31, 2023 (Chart IV.17a). IV.119 An analysis of the net inflows data shows large inflows in some months followed by negligible inflows in subsequent months (Chart IV.17b). The large inflow months are typically those which had new funds launched. This pattern reflects that while investors lap up the new fund offers in the ESG domain, subsequent investment remains tepid. Post the delta wave of COVID-19 in India, not only have the new fund offers for ESG funds stopped, but there have also been outflows. IV.120 ESG funds and indices have been criticised for various reasons. First, is their stock selection, with some questionable inclusions and exclusions. The 20 largest ESG funds globally have, on average, investment in 17 fossil fuel producers each, thereby undermining the environmental dimension of ESG investing (The Economist, 2021). Second, a considerable portion of funds labelled as ESG don’t select stocks based on ESG ratings or performance on ESG parameters but use ESG ratings as one among many risk management tools for their usual portfolios. This is analogous to non-ESG themed funds being labelled as ESG. 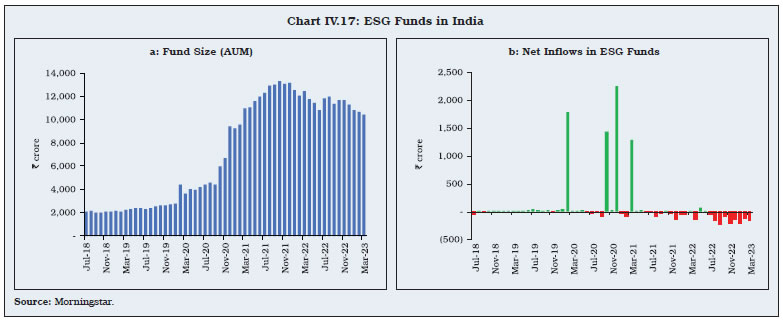 IV.121 In order to provide better clarity on the ESG strategies of MFs, the regulator has proposed new sub-categories of ESG funds based on underlying strategies. A more active stewardship role for asset management companies has been envisioned mandating enhanced disclosures on voting decisions with specific focus on ESG factors. For ESG-related funds, a separate section on ‘fund manager commentary’ and case studies detailing issues like the application of the ESG strategy in the fund has also been introduced (SEBI, 2023d). IV.122 The absence of dedicated ERPs of global repute for EMEs, including India, is a factor contributing to the limited inflow of ESG funds to them. Allocations to EMEs (equities and bonds) by ESG funds are lower than those by non-ESG funds. ESG is a new trend, and regulators worldwide are trying to understand the market before developing detailed guidelines. This is a prudent thing to do as over-regulation may stifle innovation. The Role of Private Equity IV.123 The global climate finance currently stands at about US$ 630 billion annually, which is about one-fifth of the estimated requirement (Climate Policy Initiative, 2021). The share of private equity (PE) is less than 4 per cent (The City UK, 2022). With their high-risk appetite, PE and venture capital (VC) funds should increasingly fill the gap, guided by the returns that the investment generates. IV.124 In 2021, PE had US$ 6.3 trillion in AUM, projected to exceed US$ 11 trillion by 2026 (Eccles et al., 2022). The number of PE and VC signatories to Principles of Responsible Investment (PRI)19 has quadrupled to 1090 by 2021. PE is uniquely positioned to support the green transformation as its longer investment horizon positions it to undertake investments in projects with long gestation periods. A major limitation of PE/VC funding, however, is that it is mainly restricted to small-sized private companies that potentially have large commercial value but not necessarily projects that have the most significant social and climate benefits. IV.125 There is considerable opportunity to accelerate the deployment of PE/VC capital, especially in emerging markets. In Asia, just 24 per cent of private assets are committed to ESG, compared with Europe’s 80 per cent (Chart IV.18). IV.126 India too has seen the entry of private investment groups in the climate financing landscape. Eversource Capital, a joint venture between Everstone (one of India’s leading private investment groups) and Lightsource BP (BP’s renewable energy platform) started India’s first dedicated climate change fund – the Green Growth Equity Fund (GGEF) in 2018. The CGEF targets raising equity capital up to US$ 940 million for India’s green infrastructure sectors such as renewable energy, transport, resource efficiency and energy services (Eversource Capital, 2021). 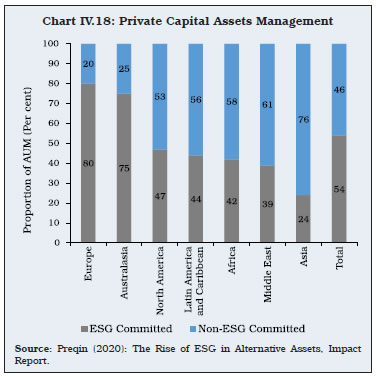 IV.127 With a deal value of US$ 7.9 billion, the share of ESG in total PE investment in India increased from 5 per cent in 2021 to 13 per cent in 2022 (Bain & Company, 2023). About 90 per cent of the cumulative investment of US$ 19.2 billion between 2018 and 2022 has been in clean energy and electric mobility. This is driven by increased cost competitiveness on the back of improved efficiency, growing climate awareness as also Government policies including regulatory policies that provide the tailwind. 7. Monetary Policy IV.128 While several central banks remain cautious20 on incorporating climate concerns directly in their monetary policy framework and operations to avoid potential dilution of accountability in relation to their principal mandate(s), the European Central Bank (ECB) and the BoE are the two major central banks that have adopted climate change considerations explicitly into their monetary policy operations. It is estimated that the emission reduction through a carbon tax is four times the maximum reduction possible through green quantitative easing (Abiry et al., 2022). The latter can, however, serve as an effective complementary policy instrument. Monetary Policy Transmission IV.129 Climate change could alter the speed, role and nature of monetary policy transmission. For instance, sectors that are more exposed to climate-induced physical risks may face a higher risk premium due to greater credit risk and lower asset valuation. As a result, the credit channel and the interest rate channel of monetary transmission may get impeded. This section delineates the monetary policy tweaks that can encourage green transition. Green Quantitative Easing IV.130 In the wake of the global financial crisis, quantitative easing (QE) or large-scale asset purchases, emerged as one of the primary monetary policy tools of central banks in major AEs. With the outbreak of the pandemic, QE was widely adopted by both AEs and EMEs. IV.131 When central banks purchase corporate debt, they drive down risk premium, thereby improving the ability of the corporates to finance their activities at lower costs. Asset purchases are mostly carried out on the principle of “market neutrality” – bonds are purchased in proportion to their outstanding quantity in the market to minimise the impact of the purchase on the relative borrowing cost across sectors (Papoutsi et al., 2021; Zielińska-Lont, 2019). The presence of externalities, however, often drives a wedge between market prices and efficient asset values. The market neutrality principle is, thus, suboptimal as it results in a pro-carbon bias by benefiting large firms in carbon-intensive industries (Schnabel, 2021). As per one estimate, over 70 per cent of the ECB’s corporate bond holdings belonged to sectors associated with high or very high impact on nature (Kedward et. al., 2021). IV.132 The ECB began decarbonising its corporate bond holdings in October 2022 (ECB, 2022). Purchases for re-investment purpose are tilted towards issuers with a higher climate score, which, in turn, is compiled from the backward-looking emissions sub-score, forward-looking target sub-score and climate disclosure sub-score. This is helping the ECB in improving the weighted average climate score of its holdings over time. In line with the UK’s commitment to net zero GHG emissions by 2050, the BoE started greening its corporate bond portfolio in November 2021, with an intermediate target of reducing the weighted average carbon intensity of the corporate bond purchase scheme portfolio by 25 per cent by 2025 (BoE, 2021). IV.133 Further, some central banks have introduced new monetary policy tools to provide low-cost funds to financial institutions for channelising them to private firms in sectors such as clean energy, energy conservation and carbon reduction technologies (BoJ, 2021; Abiry et al., 2022). The Bank of Japan (BoJ) started funds-supplying operations to support financing for climate change responses in 2021. Under this, the BoJ provides 1-year loan at 0 per cent interest matching the investment or loans by banks in projects that contribute to Japan’s actions to address climate change. The total outstanding loans under this scheme was ¥4.4 trillion as of January 2023 (BoJ, 2023). The People’s Bank of China (PBoC) launched the carbon emission reduction facility in November 2021. Under this, it provides commercial banks with funds worth 60 per cent of the principal amount lent by them for emissions-reducing projects at an annual interest rate of 1.75 per cent. The total outstanding loans under this scheme was US$ 43.6 billion as of December 2022, supporting about 0.1 gigatonne of reduction in CO2 emissions (Central Banking, 2023). IV.134 Under the extant rules in India, commercial banks are required to invest 40 per cent of their adjusted net bank credit in priority sectors, which include renewable energy21. While this policy helps channelise credit towards the renewable energy sector, it could be complemented with a targeted new scheme to provide low-cost funds to banks for onward lending and thereby, lowering the borrowing costs of firms operating in the renewable energy space. Collateral Policy for Access to Liquidity IV.135 The ECB has enunciated plans to green the collateral for its liquidity operations. It will restrict the share of assets issued by high carbon footprint entities that can be pledged as collateral for borrowing from the Eurosystem. The new limits would initially apply to marketable debt instruments issued by non-financial corporations and extended to other instruments with improvement in climate-related data. The limit is expected to kick in before end-2024. Further, climate change risks are also set to become a factor for determining haircuts on corporate bonds used as collateral. The ECB is also working on bringing to fruition climate-related disclosure requirements for assets that can be pledged as collateral with a timeline of 2026. IV.136 In India, the only eligible collateral for availing funding from the Reserve Bank is Government securities, issued by the Centre or the States. Currently, the margin requirements on the collateral for availing central bank liquidity increase in line with the residual maturity of the collateral. Further, the margin requirement for unrated State Government securities (SGS) is 1 per cent higher than rated SGS of same residual maturity bucket. A possible revamped collateral policy could help in enhancing flexibility for the Reserve Bank to allow relatively higher relaxation in margin requirements for accepting SGBs, under the Liquidity Adjustment Facility/Marginal Standing Facility to provide liquidity. CRR Exemptions on Green Credit IV.137 To enhance credit flows to the low carbon (or green) sectors or industries in transition, reserve requirement could be a possible policy instrument. Among EMEs, Banque du Liban, the central bank of Lebanon, follows a differentiated reserve requirement policy based on the carbon footprint in the loan portfolios of banks (Dikau and Volz, 2018). Banks that have a higher share of green assets in their portfolio are mandated lower reserve requirements. This increases the availability of loanable funds for banks to earn a higher return. Implementation of this policy requires a verifying authority/institution that certifies the utilisation of a loan in green projects. For instance, in Lebanon, the Lebanese Centre for Energy Conservation – a government agency – verifies a project after which a loan becomes eligible for preferential reserve relaxation. IV.138 In India, since the Reserve Bank is the regulator and supervisor of banks in addition to being the monetary authority, it may not require an additional institutional arrangement for supervising the loan portfolios of the banks. A third-party verification would, however, be required to validate the carbon footprint of projects and determine eligibility for reserve requirement relaxation. Targeted reserve requirement relaxations were adopted by the Reserve Bank in the past to direct lending to certain productive sectors that have multiplier effects. In 2020, during a 6-month period, incremental retail credit to automobiles and residential housing and loans to the Micro, Small and Medium Enterprises (MSMEs) were made eligible for deduction from the net demand and time liabilities for computing the reserve requirement for the tenure of the loan/five years, whichever was lower. After the reserve requirement relaxation, credit offtake to MSMEs improved during the COVID-19 pandemic (RBI, 2022c). Also, to give a fillip to financing of infrastructure, the Union Budget for 2014-15 had announced that banks would be “permitted to raise long-term funds for lending to infrastructure sector with minimum regulatory pre-emption such as CRR….”. The Reserve Bank issued necessary guidelines in this regard in July 2014. As per sectoral deployment of credit data, the total outstanding credit to infrastructure increased by 62.6 per cent between March 2014 and March 2023. Central Bank Digital Currency (CBDC) IV.139 The Indian CBDC or e₹ is in the pilot stage for both wholesale and retail uses and is expected to be more environment friendly compared with cash. CBDC helps curb emissions by nullifying operations such as printing, storage, transportation, and replacement of physical currency. The total expenditure on printing of banknotes in 2021-22 was ₹4,985 crore and it does not account for the ESG costs of printing money (RBI, 2022d). At the outset, instituting a CBDC may entail significant fixed infrastructure costs but subsequent marginal operating costs are estimated to be very low (RBI 2022d). IV.140 If designed with ESG objectives in mind, a CBDC could be more environment friendly compared to alternative cashless methods. Payments effected through CBDC would be instantaneous and final, and reduced reliance on clearing corporations and other settlement infrastructure could cut down energy consumption. The energy requirement of a digital currency depends on its underlying technological stack. Central banks may issue CBDCs based on energy-efficient algorithm-driven processes as against mining by numerous agents working under competitive reward structures. This can help CBDCs have higher transaction throughput compared to crypto currencies for the same energy input. Further, contingent on specific details of how they are configured, CBDCs can be more energy efficient than much of the current payment landscape, including credit and debit cards (Agur et al., 2022). Estimates indicate that non-Proof of Work permissioned22 networks – what CBDCs are likely to be – are significantly more energy efficient than current credit card processing centres, in part because the latter involve energy-inefficient legacy systems. 8. Nudging Behavioural Change IV.141 Mission LiFE introduced by India at COP 26 aims to nudge individuals and communities to adopt environmentally sustainable lifestyles. Behavioral changes that are required to mitigate climate change include responsible consumption, a circular economy i.e., reuse and regeneration of materials or products, living in harmony with nature, sustainable resource management, co-existence and cooperation (PIB, 2022b). Two measurable objectives of the mission are to: (a) mobilise at least one billion Indians/other global citizens to take individual and collective action for protecting and conserving the environment during 2022–28; and (b) make at least 80 per cent of India’s villages and urban local bodies environment-friendly by 2028 (NITI Aayog, 2022c). The transition process may involve distinct shifts in demand, supply and policies – a shift in demand patterns of individuals preferring environment-friendly goods and services; a shift in supply in response to anticipated changes in demand pattern and also following a large number of firms voluntarily embracing greener business practices; and a shift in policy stance to support sustainable consumption and production. IV.142 Mission LiFE 2022-23 enlisted 75 specific, easy-to-practice actions across seven categories – saving energy; saving water; reducing single-use plastic; adopting sustainable food systems; reducing waste generation; adopting healthy lifestyles; and reducing e-waste. A Government programme to provide individuals with an informed choice about one of the actions – energy saving – is the “Standards & Labelling Program” by the BEE. Star labelling of appliances is a cost-effective policy tool for improving energy efficiency and lowering the energy cost of appliances for the consumers. This programme aims to foster a sustainable “market transformation” by shifting the market towards increased sales of energy-efficient star-labelled products. The Government’s zero subsidy domestic lighting programme, Unnat Jyoti by Affordable LEDs for All (UJALA), launched in 2015, enhanced consumer awareness on financial and environmental benefits associated with energy efficiency. The scheme makes affordable energy accessible and has successfully reduced the retail price of LED bulbs from ₹300-350 per bulb to ₹70-80 per bulb (PIB, 2022c). IV.143 GOBARdhan is another multi-stakeholder driven Government scheme. Under the Swachh Bharat Mission Grameen – Phase II, GOBARdhan scheme is being pursued with the objective of supporting villages in managing their cattle, agro residues and biodegradable waste effectively. The Department of Drinking Water and Sanitation is providing technical assistance and financial support of up to ₹50 lakh per district, aiding villages in converting their waste into wealth, improving environmental sanitation, curbing vector-borne diseases, and converting organic waste to biogas and organic manure for use in rural areas. IV.144 A voluntary energy saving plan introduced by the EU in 2022 in the backdrop of tight natural gas supplies following the Russia-Ukraine war – “Save Gas for a Safe Winter” – proposed a voluntary gas demand reduction target of 15 per cent from August 2022 to March 2023. It suggested various measures such as norms for use of air conditioning, street lighting, air drying laundry, switching off lights when not required, and improving home insulation to reduce the demand for gas across the economy from the public sector, businesses, as well as households (European Commission, 2022). Similar voluntary norms could also be envisaged for reducing food wastage – estimated at around 14 per cent of total production – between harvesting and retail, to reduced GHG emissions (Singh and Chaudhary, 2023). IV.145 Nudging behavioural changes would be the least cost yet effective way to pursue the green transition agenda. Interventions such as awareness creation through advertising, labelling and certifications (carbon labels on the lines of food labelling), legislation (such as the recent ban on single-use plastic), incentivising purchase of sustainable products (such as subsidies by the Government for EV adoption), could empower consumers with information required for adoption of low carbon products (Rajan and Vani, 2023). 9. Impact of Policy Interventions on Reducing Carbon Emissions: A Scenario Analysis IV.146 While all policy options covered in this chapter need to form a part of a comprehensive strategy for reducing carbon emissions in India, fiscal, regulatory, and non-fossil fuel related policies would be particularly important to achieving the intended ultimate net zero goal. Globally, carbon taxes are reckoned as one of the most efficient instruments for reducing carbon emissions, particularly in hard-to-abate sectors such as iron and steel, non-ferrous metals, non-metallic minerals and chemicals (Paltsev et al., 2022; IMF, 2019). ETS – the auction or allocation of emission permits – may also help curb emissions by similar level if applied to a wider canvas of economic activities. Standards for carbon emission rates and energy efficiency prescribed as part of regulatory policies, and feebates/rebates for technologies that emit higher/lower than average emissions could also help in reducing the overall CO2 emission level in an economy. IV.147 Recognising that most of the available estimates on the impact of any policy intervention in reducing carbon emissions are not precise and conditional on the validity of assumptions, an attempt is made to generate scenarios of the likely CO2 emission reduction in India under various policy interventions discussed above. Two broad scenarios relate to imposing a carbon tax of US$ 25 per tonne and US$ 50 per tonne, respectively, of CO2 emission. Along with the carbon tax, other policies such as feebate, regulatory policies and ETS have been considered. These scenarios mostly use the estimated parameters projected by the IMF (2019). The impact of progress on green hydrogen and EVs has also been considered, as they can help reduce the demand for fossil fuels (Niti Aayog, 2022d). IV.148 Estimates suggest that a carbon tax of US$ 25 per tonne (US$ 50 per tonne in the second scenario) can reduce carbon emissions by 25 per cent (36 per cent) compared with the baseline scenario of “business as usual” projected for 2030 by the IMF (2019). A combination of other policies such as ETS, feebate and regulatory measures could reduce the CO2 emissions by nearly 93 per cent of the reduction achieved through carbon taxes. For the hard-to-abate sectors, the adoption of green hydrogen could cumulatively reduce CO2 emissions by 3.6 gigatonnes between 2020 and 2050 (Niti Aayog, 2022). Similarly, as per the Announced Policies Scenario (APS) of the IEA, the oil (or fossil fuel) displacement as a result of EV adoption in buses, trucks, vans and cars stands at 0.22 million barrels per day by 2030 (IEA, 2023a). Both, the adoption of green hydrogen and the displacement of fossil fuels together can reduce nearly 1.1 gigatonnes of CO2 emissions between 2021 to 203023. IV.149 As of 2021, India’s total CO2 emissions stood at 2.7 gigatonnes (Our World in Data, based on Global Carbon Project, 2022). In the baseline scenario of no policy intervention, the emission level may rise to 3.9 gigatonnes in 2030 (please refer to Chapter 2). With the implementation of carbon taxes, i.e., US$ 25 per tonne and US$ 50 per tonne under the two scenarios, accompanied by other measures mentioned above, CO2 emissions can be reduced to about 0.9 and 0.1 gigatonne, respectively (Chart IV.19). The scenario analysis highlights the critical significance of a multi-pronged policy approach to achieving the updated NDC committed in 2022. Besides the current policy thrust on incentivising renewables and EVs, innovative technologies such as green hydrogen, energy efficiency, carbon sink and lifestyle changes, it may be necessary to introduce explicit carbon taxes to reduce carbon emissions from the hard-to-abate sectors. 10. Concluding Observations IV.150 Climate policies hold the key to disaster risk reduction and protecting people and the planet. A comprehensive climate action plan, building on growing public and political will, has three broad dimensions – design, implementation, and a constant review to assess what works and what does not. The strategic action plan covers both mitigation – reducing CO2 emissions, and adaptation – learning to adapt, while pursuing climate resilient economic development. As the scale of the challenge is enormous and still growing, the battle against the climate crisis has to be sustained, notwithstanding misinformation and greenwashing tendencies that may occasionally disrupt the process. In 2022, the world population crossed the 8 billion mark, while the global growth outlook has remained subdued since the COVID-19 pandemic with rising concerns about possible moderation in trend growth (World Bank, 2023). Climate action plans of countries, therefore, may have to balance the trade-off costs of green transition. The unavoidable preference for fossil fuel in several countries since the start of the Russia-Ukraine war highlights the need for flexibility in implementing the climate action plan. India already has in place a well-designed action plan, with specific policy interventions aimed at collectively pursuing the overall net zero target. This chapter reviews all feasible policy actions – existing and more – with an assessment of their likely contribution to reducing carbon emissions relative to India’s updated NDC commitments. 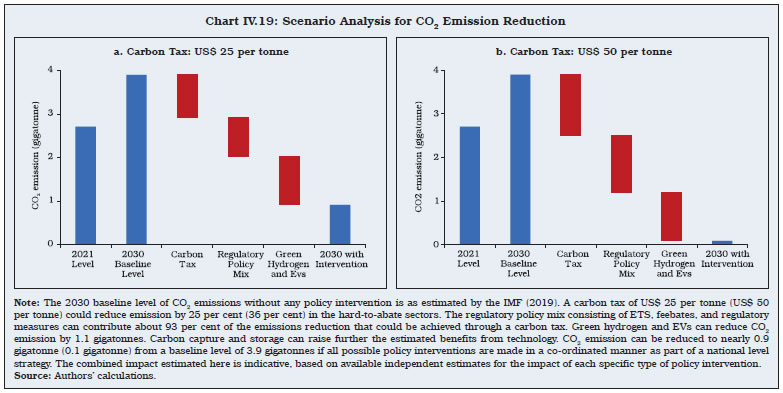 IV.151 Fiscal policy has a prominent role in driving green transition given its high potential effectiveness and the trust of the public in the Government’s actions being in the broader national interest. Under fiscal policy, the various instruments available are carbon pricing using carbon taxes or ETS; green bonds issued by the Government and public sector enterprises for deployment of resources in green projects; feebates; and public green investment. First, India needs to introduce a broad-based carbon pricing system in line with emerging global best practices to meet its climate goals. Second, a carbon tax may need to be accompanied by complementary redistributive policies due to its regressive nature, in view of the inability of the weaker sections of the society to move to eco-friendly modes of production and patterns of consumption. Third, an ETS, linked to green taxonomy, covering all sectors of the economy may be introduced, which can partly balance subsidy (less polluting industries getting carbon credits for trading) and tax (more polluting industries that should have to buy carbon certificates). While a carbon tax may be more effective, an ETS may be less politically contentious. Fourth, there is a need for an effective green taxonomy to identify sustainable green assets and activities and limit the potential risk of greenwashing. Finally, once a green taxonomy is in place, there is a need to properly record public spending on climate change and related issues and report them in a climate budget report as a supplement to the annual budget. IV.152 The role of new technology and supportive policies for innovation is critical for progress on both mitigation and adaptation fronts. The spurt in technological progress seen recently in renewable (solar and wind) energy, EVs, green hydrogen, carbon capture and storage, and energy-efficient appliances would require a global framework to ensure easy access to technology for all, and an efficient global supply chain with access to key minerals to make the green transition cost affordable. First, India needs to acknowledge that the technological advances and the associated fall in prices of key inputs have been driven by targeted policies and R&D investments by Governments the world over, and the same should be sustained, while exploiting ways to improve access to technology and critical mineral resources through multilateral, regional and bilateral strategic partnerships. Second, India has achieved significant progress in renewable energy generation capacity, and efforts need to be stepped up in addressing the variability in wind and solar power supply through appropriate energy storage technology and demand management mechanisms using smart grids. Third, for enhancing domestic energy security given the risks from ongoing global geo-economic shifts, current policies focussing on developing an indigenous renewables supply chain would require ramping up of domestic capacity to mine lithium, cobalt and rare earth elements and/or procure them through long-term contracts and outward FDI; and domestic manufacturing of critical equipment such as batteries, electrolysers, PV cells, EVs, and other associated components. Fourth, continuing advances in application of AI and ML present an opportunity to tackle climate change through better resource management. In the transport sector, the concept of MaaS and ITS may be explored in India’s smart cities. Further, green building standards may be complemented with IoT based monitoring and AI and ML driven optimisation to manage and reduce energy demand. Fifth, climate resilient agriculture is the need of the hour for a sustainable future, and climate-smart agriculture practices such as integrated pest management, conservation tillage and enhanced nutrition management may be promoted, in addition to the development of a climate-resilient infrastructure network. The production of green hydrogen using renewable energy and investment in carbon capture and storage technologies would provide further impetus to sustainable energy security for the nation. IV.153 While carbon emissions could originate from any country, climate disaster risk is a global concern. Trade policies have the potential to contribute to risk mitigation. Liberalisation of cross-border trade could provide gains to developing countries in terms of economic growth and enhanced productivity; however, its impact on environment remains debatable. India needs to recognise that protectionist policies of countries are increasingly becoming sensitive to the carbon content of imports, which could affect India’s medium-term export outlook unless Indian exports meet green standards of importing nations. At the global level, various steps also need to be taken to facilitate the diffusion of green technologies and improve the carbon efficiency of international trade. First, RTAs should increase their focus on green and clean energy products. Second, concerted efforts should be made to increase the export share of climate-friendly goods across India’s key trading partners. Third, active steps may be taken towards reducing the carbon content of international trade. Fourth, expertise in negotiating trade agreements needs to be developed so that effective environmental provisions can be incorporated while retaining autonomy in formulating domestic trade policy. Fifth, a level playing field may be created for clean and dirty industries in the domestic market so that inefficiencies in resource allocation through policy biases may be avoided. Sixth, eco-labelling – a market-based tool – may be used to encourage the demand for and supply of environment-friendly goods. Also, small or medium scale producers need to be provided with sufficient handholding for making progress towards sustainable growth through eco-labelling. IV.154 In India, the SEBI and the Reserve Bank are taking steps to facilitate green transition by enhancing disclosure requirements and strengthening risk assessment and management of regulated entities. The Reserve Bank is expected to set out the disclosure framework on climate-related financial risks and guidance on climate scenario analysis and stress testing shortly. Central banks are still exploring ways to speed up the flow of finance to green projects and prevent misallocation/mispricing of assets through appropriate regulatory policies, including green capital regulation, prescribing exposure limits to brown sectors and lowering risk weights for green sectors. To increase green lending, banks would need to invest in upskilling human resources for the entire gamut of the credit appraisal system. While green finance has grown in prominence, it thus far has had limited regulatory guidance. The Reserve Bank announced the framework for acceptance of green deposits in April 2023 to spur the green finance ecosystem in India. As mentioned earlier, there is however, an urgent need for a “green taxonomy” in India – clearly spelling out what constitutes green can, inter alia, help direct investment through better-designed policies and improve the monitoring of progress. The SEBI’s recent move to objectively specify the end-uses of a green debt security is an important development. IV.155 The CSR Act is an important supplementary tool for achieving, inter alia, climate goals. To incentivise and strengthen the corporates’ green transition efforts, the CSR Act could be tweaked to widen the scope of geographies, businesses and timelines over which green projects are adopted and undertaken by companies. If the gains from the first-mover advantage for any industry are communicated effectively, it could further enhance the green agenda. The Government could also prescribe regulations for entities operating in certain domains to contribute to green transition. For instance, the Union Budget for 2023-24 announced that in due course a 5 per cent compressed biogas mandate will be introduced for all organisations marketing natural and biogas. The NITI Aayog’s initiative to rank states on the basis of performance in green transition, besides working as a gentle nudge to improve performance, also aids in fine-tuning policies in the energy sector, leveraging both co-operative and competitive federalism. IV.156 Recent regulatory measures taken in the country make India a front-runner in developing a robust regulatory framework for ESG-themed investments. There is, however, a need to move cohesively to prevent the emergence of a multitude of disconnected regional standards for ESG-fund classification across the world. The mandated BRSR in India is expected to generate better data on ESG parameters, which would, in turn, help creation of standardised rating products and enhance credibility of companies’ disclosures. The recent steps taken by SEBI regarding the framework for ERPs and other aspects of sustainable finance would help address several issues plaguing ESG ratings of financial instruments and entities – definition, methodology and possible conflict of interest. PE investment in ESG assets can be enhanced by continuing with the fiscal and regulatory push towards green transition that helps fetch higher returns as firms with a sustainability focus, inter alia, enjoy cost savings on account of greenium, lower regulatory risk and decarbonisation-related efficiency gains while also achieving higher realisation from sale of products marketed as climate-friendly. IV.157 Along with its primary mandate on price stability, monetary policy can play a complementary role in promoting green transition, taking into account the emerging new initiatives in the sphere of monetary and liquidity management policies in other central banks. A few policies that could be explored include lower margin requirements for SGBs when used as collateral for availing liquidity from the Reserve Bank, and reserve requirement relaxation for green credit. Higher use of CBDCs by the general public can help lower the carbon footprint through a less-cash economy. In the Fintech Benchmarks 2023 survey by centralbanking.com, all 29 institutions polled said that CBDC is a greener option compared with cash. IV.158 The Union Budget for 2023-24 announced that for encouraging behavioural change, a Green Credit Programme will be notified under the Environment (Protection) Act. This will incentivise environmentally sustainable and responsive actions by companies, individuals and local bodies, and help mobilise additional resources for such activities. Nudging households and business establishments for adopting environment friendly lifestyles and business practices such as energy conservation through prudent use of air conditioning and heating systems, avoiding wastages of food and water, and preferring green products, services and financial assets, could make the net zero goal more attainable. IV.159 The scale of green transition challenge is both enormous and complex, and only a multi-pronged action plan with a monitorable implementation strategy covering all major carbon emitting sectors can help accelerate India’s progress towards the net zero goal. Without any policy action, India’s CO2 emission level may rise from 2.7 gigatonnes (in 2021) to 3.9 gigatonnes by 2030. A policy mix comprising a carbon tax of rupee equivalent of US$ 25 per tonne, current plans on progressively increasing the share of non-fossil (solar, wind) fuel in the energy mix, production and use of EVs and green hydrogen, and regulatory measures to incentivise resource allocation for green projects, could reduce CO2 emissions to 0.9 gigatonne by 2030. Higher rates of carbon tax can reduce the emission level further. Action on all fronts, to be sustained over decades, however, would invariably require a people’s movement, proposing feasible solutions, adapting to green lifestyles, and supporting Government initiatives. References: Abiry, R., Ferdinandusse, M., Ludwig, A., & Nerlich, C. (2022). Climate Change Mitigation: How Effective is Green Quantitative Easing? ZEW-Centre for European Economic Research Discussion Paper, (22-027). Abman, R., & Lundberg, C. (2020). Does free trade increase deforestation? The effects of regional trade agreements. Journal of the Association of Environmental and Resource Economists, 7(1), 35-72. Agur, I., Deodoro, J., Lavayssière, X., Peria, S. M., Sandri, D., Tourpe, H., & Bauer, G. V. (2022). Digital Currencies and Energy Consumption. International Monetary Fund FinTech Notes No. 2022/006. Ambec, S., Cohen, M. A., Elgie, S., & Lanoie, P. (2013). The Porter Hypothesis at 20: Can Environmental Regulation Enhance Innovation and Competitiveness? Review of Environmental Economics and Policy, 7(1), 2-22. Andersson, J. J. (2019). Carbon taxes and CO2 emissions: Sweden as a case study. American Economic Journal: Economic Policy, 11(4), 1–30. Ando, S., Fu, C., Roch, F., & Wiriadinata, U. (2022). Sovereign Climate Debt Instruments: An Overview of the Green and Catastrophe Bond Markets. IMF Staff Climate Note. No.4. July. Bain & Company. (2023). India Private Equity Report 2023. https://www.bain.com/insights/india-private-equity-report-2023/ Baranović, I., Busies, I., Coussens, W., Grill, M., & Hempell, H. S. (2021). The challenge of capturing climate risks in the banking regulatory framework: Is there a need for a macroprudential response? Macroprudential Bulletin, 15, ECB. Baur, M., Bruchez, P.-A., & Nicol, S. (2021). Climate change and long-term financial risks: Challenges for central banks and financial regulators. Journal of Financial Stability, 54, Article 100857. Beiser-McGrath, L. F., & Bernauer, T. (2019). Could revenue recycling make effective carbon taxation politically feasible? Science Advances, 5(9), eaax3323. Berg, F., Kolbel, J. F., & Rigobon, R. (2019). Aggregate Confusion: The Divergence of ESG Ratings. SSRN Electronic Journal, May, 1–30. https://doi.org/10.2139/ssrn.3438533 BoE (2021). Bank of England publishes its approach to greening the Corporate Bond Purchase Scheme. News Release. November 5. https://www.bankofengland.co.uk/news/2021/november/boe-publishes-its-approach-to-greening-the-corporate-bond-purchase-scheme. BoJ (2021). The Bank of Japan’s Strategy on Climate Change. Bank of Japan, July 16. https://www.boj.or.jp/en/announcements/release_2021/rel210716b.pdf BoJ (2023). Loan Disbursement under the Funds- Supplying Operations to Support Financing for Climate Change Responses. January 27. https://www.boj.or.jp/en/mopo/mpmdeci/mpr_2023/mpr230127a.pdf Bongiovanni R. & Lowenberg-Debor J. (2004). Precision Agriculture and Sustainability, Precision Agriculture 5, 359-387 Brandi, C., Schwab, J., Berger, A., & Morin, J.- F. (2020). Do environmental provisions in trade agreements make exports from developing countries greener? World Development, 129, Article 104860. Brenton, P., & Chemutai, V. (2021). The Trade and Climate Change Nexus: The Urgency and Opportunities for Developing Countries. Washington, DC: World Bank. Bruvoll, A., & Larsen, B. M. (2004). Greenhouse gas emissions in Norway: do carbon taxes work? Energy Policy, 32(4), 493–505. Central Banking (2023). PBoC has lent banks $44 billion for ‘green projects’ https://www.centralbanking.com/central-banks/financial-stability/7957212/pboc-has-lent-banks-44-billion-for-green-projects Ceres and Sustainability Institute. (2021). The Changing Climate for Private Equity. Chatterji, A. K., Durand, R., Levine, D. I., & Touboul, S. (2016). Do ratings of firms converge? Implications for managers, investors and strategy researchers. Strategic Management Journal, 37(8), 1597–1614. https://doi.org/10.1002/smj.2407 Climate Policy Initiative. (2021). Global Landscape of Climate Finance 2021. Coady, D. M., Parry, I., Le, N. P., & Shang, B. (2019). Global fossil fuel subsidies remain large: An update based on country-level estimates. International Monetary Fund. Coelho, R., & Restoy, F. (2022). The regulatory response to climate risks: Some challenges (BIS FSI Briefs No. 16). CRISIL. (2022). CRISIL Sustainability Yearbook, 2022. Dabla-Norris, M. E., Daniel, M. J., Nozaki, M. M., Alonso, C., Balasundharam, V., Bellon, M., Chen, C., Corvino, D., and Kilpatrick, J. (2021). Fiscal Policies to Address Climate Change in Asia and the Pacific: Opportunities and Challenges. Asia and Pacific Department Fiscal Affairs Department No. 21/07. International Monetary Fund. Darvas, Z., & Wolff, G. B. (2022). How to reconcile increased green public investment needs with fiscal consolidation. Bruegel-Blogs. Das, S. (2023). South Asia’s Current Macroeconomic Challenges and Policy Priorities. Speech presented at the high-level Conference co-organised by the International Monetary Fund (IMF) Asia and Pacific Department (APD) and the IMF South Asia Regional Training and Technical Assistance Centre (SARTTAC), New Delhi. January 6. Samant, M. D., & Singh, R. S. P. (2022). Post Covid Surge in ESG Mutual Funds in India: Is It A Structural Break? Journal of Positive School Psychology, 6(8), 600–609. Dikau, S., & Volz, U. (2018). Central banking, climate change and green finance (ADB Institute Working Paper No. 867). Doronzo, R., Siracusa, V., & Antonelli, S. (2021). Green Bonds: The Sovereign Issuer’s Perspective. Bank of Italy. Markets, Infrastructures, Payment Systems Working Paper No. 3. Duenwald, C., Abdih, Y., Gerling, K., & Stepanyan, V. (2022). Feeling the Heat: Adapting to Climate Change in the Middle East and Central Asia. Departmental Paper. International Monetary Fund. ECB (2022). ECB provides details on how it aims to decarbonise its corporate bond holdings. Press Release. European Central Bank. September 19. Eccles, R. G., Shandal, V., Young, D., & Montgomery, B. (2022). Private Equity Should Take the Lead in Sustainability. Harvard Business Review. August. EEIST. (2022). Ten Principles for Policy Making in the Energy Transition. Economics of Energy Innovation System Transition. Enerdata. (2018). Between 10 and 20% of electricity consumption from the ICT* sector in 2030? Executive Brief. Energy Transitions Commission. (2020). Making Mission Possible: Delivering a Net-Zero Economy. EPIC India. (2019). The Surat Emissions Trading Scheme. Retrieved from https://epic.uchicago.edu/research/the-surat-emissions-trading-scheme-a-first-look-at-the-worlds-first-particulate-trading-system Erhart, S. (2022). Take it with a pinch of salt—ESG rating of stocks and stock indices. International Review of Financial Analysis, 102308. ISSN 1057- 5219. Esposito, L., Mastromatteo, G., & Molocchi, A. (2019). Environment risk-weighted assets: allowing banking supervision and green economy to meet for good. Journal of Sustainable Finance and Investment, 9(1), 68–86. European Commission. (2022). Q&A: Sustainable Finance: EU Taxonomy and Green Bond Standard. Retrieved from https://ec.europa.eu/commission/presscorner/detail/en/QANDA_22_4609 Eversource Capital. (2021). GCF approves USD 137 million FMO investment in India’s Green Growth Equity Fund - EverSource Capital. https://www.eversourcecapital.com/gcf-approves-usd-137-million-fmo-investment-indias-green-growth-equity-fund/ EY (2018). Discussion Paper on Carbon Tax Structure for India. Ernst & Young LLP. Fawley, B. W., & Neely, C. J. (2013). Four stories of quantitative easing. Federal Reserve Bank of St. Louis Review, 95(1), 51-88. Ferdinandusse, M., Nerlich, C., & Téllez, M. D. (2022). Fiscal policies to mitigate climate change in the euro area. ECB Economic Bulletin, Issue 6. Fernandez-Kranz, D., & Santalo, J. (2010). When necessity becomes a virtue: The effect of product market competition on corporate social responsibility. Journal of Economics & Management Strategy, 19(2), 453-487. Ferrante, J. (2016). ‘Greening RTAs – Roundtable discussion and next steps’ in Report on the OECD Workshop on Greening Regional Trade Agreements. Document- COM/TAD/ENV/JWPTE(2016)7/FINAL. Financial Times. (2023). EU carbon price tops 100 a tonne for first time. February 21. Fried, S., Novan, K., & Peterman, W. B. (2020). How Should Carbon Tax Revenue be Recycled? Working Paper. Federal Reserve Bank of San Francisco. Fullerton, D., & Metcalf, G. E. (1997). Environmental taxes and the double-dividend hypothesis: did you really expect something for nothing?. Journal of Economic Perspectives, 11(4), 171-182. Gelzinis, G. (2021). Addressing climate-related financial risk through bank capital requirements. Center for American Progress. Ghosh, A. (2023). India’s net zero ambition – The critical finance factor. Times of India. March 9. Retrieved from https://timesofindia.indiatimes.com/blogs/voices/indias-net-zero-ambition-the-critical-finance-factor/?source=app&frmapp=yes Gramkow, C. (2020). Green fiscal policies: An armoury of instruments to recover growth sustainably. United Nations. Grossman, G. M., & Krueger, A. B. (1995). Economic growth and the environment. The quarterly journal of economics, 110(2), 353-377. IEA (2017). Digitalisation and energy. https://www.iea.org/reports/digitalisation-and-energy IEA (2021). Net zero by 2050: A roadmap for the global energy sector. IEA (2021b). Better energy efficiency policy with digital tools. https://www.iea.org/articles/better-energy-efficiency-policy-with-digital-tools IEA (2022a). Renewable power is set to break another global record in 2022 despite headwinds from higher costs and supply chain bottlenecks. Press release. IEA (2022b). India’s clean energy transition is rapidly underway, benefiting the entire world. https://www.iea.org/commentaries/india-s-clean-energy-transition-is-rapidly-underway-benefiting-the-entire-world IEA (2022c). Global EV Outlook 2022. IEA (2022d). Securing clean energy technology supply chains. IEA (2022e). Buildings. Paris: IEA. https://www.iea.org/reports/buildings IEA (2022f). Industry. Paris: IEA. https://www.iea.org/reports/industry IEA (2023a). Fossil Fuels Consumption Subsidies 2022, IEA, Paris https://www.iea.org/reports/fossil-fuels-consumption-subsidies-2022. IEA (2023b). Global EV Data Explorer. https://www.iea.org/data-and-statistics/data-tools/global-ev-data-explorer IEA (2023c). Global EV Outlook 2023. IMF. (2019). How to mitigate climate change? Fiscal monitor. Washington, DC. October. IMF (2022a). Carbon Taxes or Emissions Trading Systems: Instrument Choice and Design. IMF Staff Climate Note No. 22/07. Retrieved from https://www.imf.org/en/Publications/staff-climate-notes/Issues/2022/07/14/Carbon-Taxes-or-Emissions-Trading-Systems-Instrument-Choice-and-Design-519101 IMF (2022b). Global Financial Stability Report. October International Monetary Fund Staff Climate Notes. (2022). Carbon taxes or emissions trading systems? Instrument choice and design. ISGF (2019). Energy storage system roadmap for India: 2019-2032. India Smart Grid Forum. IOSCO (2021). Environmental, Social and Governance (ESG) Ratings and Data Products Providers. https://www.iosco.org/library/pubdocs/pdf/IOSCOPD690.pdf John, J., Mitra, A., Raj, J., & Rath, D. (2016). Asset quality and monetary transmission in India. Reserve Bank of India Occasional Papers, 37(1– 2), 35–62. Joselaw, M. and Montalbano, V. (2022). Why the Inflation Reduction Act passed the Senate but cap-and-trade didn’t. The Washington Post. August 10. https://www.washingtonpost.com/politics/2022/08/10/why-inflation-reduction-act-passed-senate-cap-and-trade-didnt/ Kedward, K., Ryan-Collins, J., & Buller, A. (2021). Quantitative easing and nature loss: Exploring nature-related financial risks and impacts in the European Central Bank’s corporate bond portfolio. SSRN 3922913. Khastar, M., Aslani, A., & Nejati, M. (2020). How does carbon tax affect social welfare and emission reduction in Finland? Energy Reports, 6, 736–744. Kim, T.-J., & Tromp, N. (2021). Analysis of carbon emissions embodied in South Korea’s international trade: Production-based and consumption-based perspectives. Journal of Cleaner Production, 320, 128839. https://doi.org/10.1016/j.jclepro.2021.128839 Kopel, M. (2021). CSR leadership, spillovers, and first-mover advantage. Decisions in Economics and Finance. Kumar, R., & Ruhela, P. (2021). Corporate Social Responsibility in India: Issues and Challenges. Palarch’s Journal of Archaeology of Egypt/ Egyptology, 18(4). Lindenberg, N. (2014). Definition of Green Finance. German Development Institute. Manda, V. K., & Polisetty, A. (2022). Market Competition In Indian ESG Mutual Funds. October 19. https://www.sumc.lt/index.php/se/article/view/227/221. Marten, M., & van Dender, K. (2019). The use of revenues from carbon pricing. OECD Taxation Working Papers No. 43. Marrucci, L., Daddi, T. & Iraldo, F. (2019). The integration of circular economy with sustainable consumption and production tools: Systematic review and future research agenda. Journal of Cleaner Production, Volume 240, https://doi.org/10.1016/j.jclepro.2019.118268. McKinsey & Company (2022). Now the IPCC has recognized that carbon removals are critical to addressing climate change, it’s time to act. Sustainability Blog. June 10. Meis-Harris, J., Klemm, C., Kaufman, S., Curtis, J., Borg, K. & Bragge, P. (2021). What is the role of eco-labels for a circular economy? A rapid review of the literature. Journal of Cleaner Production, Volume 306, https://doi.org/10.1016/j.jclepro.2021.127134. MoEFCC. (2022). India’s long-term low-carbon development strategy. Ministry of Environment, Forest and Climate Change, Government of India. Mony, S. (2022). Decoding caveats in carbon trading policy. The Hindu Business Line. August 30. https://www.thehindubusinessline.com/opinion/decoding-caveats-in-carbon-trading-policy/article65827388.ece Muduli, S., & Behera, H. (2021). Bank capital and monetary policy transmission in India. Macroeconomics and Finance in Emerging Market Economies, 1–25. Rajan, M., & Vani, S. (2023). Net Zero: The consumer angle. The Hindu BusinessLine. March 21. Retrieved from https://www.thehindubusinessline.com/opinion/net-zero-the-consumer-angle/article66646827.ece National Voluntary Guidelines. (2011). National Voluntary Guidelines (NVGs) on Social, Environmental and Economic Responsibilities of Business. Retrieved from https://www.mca.gov.in/Ministry/latestnews/National_Voluntary_Guidelines_2011_12jul2011.pdf Nguyen, B., & Mésonnier, J. S. (2021). Do mandatory climate-related disclosures by financial institutions speed up fossil fuel divestment?. Blog post. PRI. July 31. Retrieved from https://www.unpri.org/pri-blog/do-mandatory-climate-related-disclosures-by-financial-institutions-speed-up-fossil-fuel-divestment/8139.article NITI Aayog (2022a). Carbon Capture, Utilisation and Storage (CCUS) Policy Frameworks and its Deployment Mechanism in India. NITI Aayog (2022b). State Energy and Climate Index: Round-I. https://doi.org/10.31219/osf.io/8ec6q NITI Aayog (2022c) LiFE Lifestyle for Environment Mission document. Retrieved from https://www.niti.gov.in/sites/default/files/2022-10/Brochure-10-pages-op-2-print-file-20102022.pdf NITI Aayog (2022d). Harnessing Green Hydrogen Opportunities for Deep Decarbonisation in India. Retrieved from https://www.niti.gov.in/sites/default/files/2022-06/Harnessing_Green_Hydrogen_V21_DIGITAL_29062022.pdf OECD (2018). Climate-resilient Infrastructure. Policy Perspectives. OECD Environment Policy No. 14. OECD (2021a). Effective Carbon Rates 2021: Pricing Carbon Emissions through Taxes and Emissions Trading. Retrieved from https://www.oecd-ilibrary.org/sites/0e8e24f5-en/index.html?itemId=/content/publication/0e8e24f5-en OECD (2021b). OECD Sovereign Borrowing Outlook, OECD Publishing, Paris, https://doi.org/10.1787/48828791-en OECD (2021c). Towards a more resource-efficient and circular economy- The role of the G20. A background report prepared for the 2021 G20 Presidency of Italy. https://www.oecd.org/environment/waste/OECD-G20-Towards-a-more-Resource-Efficient-and-Circular-Economy.pdf OECD (2022). Pricing Greenhouse Gas Emissions: Key Findings for India. ORF Occasional Paper (2022). To Price or not to Price? Making a Case for a Carbon Pricing Mechanism for India. Retrieved from https://www.orfonline.org/wpcontent/uploads/2022/09/ORF_OccasionalPaper_368_Carbon-Pricing_26Sept.pdf Paltsev, S., Gurgel, A., Morris, J., Chen, H., Dey, S., & Marwah, S. (2022). Economic analysis of the hard-to-abate sectors in India. Energy Economics, 112, 106149. https://doi.org/10.1016/j.eneco.2021.106149 Pandey, R., Bali, S., & Mongia, N. (2013). Promoting Effective Utilisation of National Clean Energy Fund. National Institute of Public Finance and Policy. Parry, I., Black, S. & Zhunussova, K. (2022). Carbon taxes or emissions trading systems? Instrument choice and design. IMF Staff Climate Note 2022/006. International Monetary Fund. Papoutsi, M., Piazzesi, M., & Schneider, M. (2021). How unconventional is green monetary policy? JEEA-FBBVA Lecture at the ASSA. January. Parry, Ian; Black, Simon; Vernon, Nate. (2021). Still Not Getting Energy Prices Right: A Global and Country Update of Fossil Fuel Subsidies. International Monetary Fund. Peters, G. P., Minx, J. C., Weber, C. L., and Edenhofer, O. (2011), “Growth in emission transfers via international trade from 1990 to 2008”, Proceedings of the national academy of sciences, 108(21), 8903-8908. Petrie, M. (2021). Environmental governance and the greening of fiscal policy. In Environmental Governance and Greening Fiscal Policy (pp. 109- 142). Palgrave Macmillan. PIB (2022a). Renewable energy in India. Ministry of New and Renewable Energy. Press Information Bureau. September 9. https://pib.gov.in/FeaturesDeatils.aspx?NoteId=151141&ModuleId%20=%202 PIB (2022b). “Understanding the Concept of LiFE” side event held at India Pavilion at COP 27, Sharm El-Sheikh. Ministry of Environment, Forest and Climate Change. Press Information Bureau. November 14. https://pib.gov.in/PressReleasePage.aspx?PRID=1875810 PIB (2022c). UJALA completes 7 years of energy-efficient and affordable LED distribution. Ministry of Power. January 5. Press Information Bureau. https://pib.gov.in/PressReleasePage.aspx?PRID=1787594 PIB (2023). Activities finalised to be considered for trading of carbon credits under Article 6.2 mechanism to facilitate transfer of emerging technologies and mobilise international finance in India. Ministry of Environment, Forest and Climate Change. February 17. Pomerleau, K., & Asen, E. (2019). Carbon tax and revenue recycling: Revenue, economic, and distributional implications (Fiscal Fact No. 674). Tax Foundation. Porter, M., & van der Linde, C. (1995). Toward a new conception of the environment-competitiveness relationship. Journal of Economic Perspectives, 9(4), 97-118. Prudential Regulation Authority. (2021). Climate-related financial risk management and the role of capital requirements. Bank of England Climate Change Adaptation Report. RBI (2022a). Challenges and opportunities in scaling up green finance. Speech. Reserve Bank of India. December 22. https://www.rbi.org.in/scripts/BS_SpeechesView.aspx?Id=1233 RBI (2022b). Financial stability report. Reserve Bank of India. June. RBI (2022c). Annual Report 2021-22. Reserve Bank of India. RBI (2022d). Concept note on central bank digital currency. Reserve Bank of India. October 7. RBI (2023). G20 for a Better Global Economic Order during India’s Presidency. Speech. Reserve Bank of India. March 17. https://rbi.org.in/Scripts/BS_SpeechesView.aspx?Id=1356 Rolnick, D., Donti, P. L., Kaack, L. H., Kochanski, K., Lacoste, A., Sankaran, K., Ross, A. S., Milojevic-Dupont, N., Jaques, N., Waldman-Brown, A., Luccioni, A. S., Maharaj, T., Sherwin, E. D., Mukkavilli, S. K., Kording, K. P., Gomes, C. P., Ng, A. Y., Hassabis, D., Platt, J. C., Creutzig, F., Chayes, J., & Bengio, Y. (2023). Tackling climate change with machine learning. ACM Computing Surveys, 55(2). Samant, M. D., & Singh, R. S. P. (2022). Post Covid Surge in ESG Mutual Funds in India: Is It A Structural Break? Journal of Positive School Psychology, 6(8), 600–609. Samantara, R., & Dhawan, S. (2020). Corporate social responsibility in India: Issues and challenges. IIMS Journal of Management Science, 11. Sareen, S., & Shankar, S. (2022). The state of climate finance in India: Ideas and trends for 2022. Aspen Network of Development Entrepreneurs. Schnabel, I. (2021). From market neutrality to market efficiency. International Monetary Review, 8(3), 1030003. Seth, R., Gupta, S., & Gupta, H. (2021). ESG investing: A critical overview. Hans Shodh Sudha, 2(2), 69-80. https://hansshodhsudha.com/volume2-issue2/October_December%202021_%20article%207.pdf SEBI (2021). Business responsibility and sustainability reporting by listed entities. May 10. SEBI (2023a). Securities and Exchange Board of India (Issue and Listing of Non-Convertible Securities) (Amendment) Regulations, 2023. February 3. (SEBI, 2023b). Dos and don’ts relating to green debt securities to avoid occurrences of greenwashing. February 3. SEBI (2023c). Revised Disclosure Requirements for Issuance and Listing of Green Debt Securities. February 6. SEBI (2023d). SEBI Board Meeting. Press Release. March 29. SEBI (2023e). Consultation Paper on ESG Disclosures, Ratings and Investing. Consultation Paper. February 20. SEBI (2023f). Consultation Paper on Regulatory Framework for ESG Rating Providers (ERPs) in Securities Market. Consultation Paper. February 22. Shah, M. S. (2018). A Study of Essence of Socially Responsible Investment and Environmental, Social and Governance (ESG)-linked Investment Market in India. International Journal for Research Trends and Innovation, 2(9), 14-24. Shapiro, J. S. (2021). The environmental bias of trade policy. The Quarterly Journal of Economics, 136(2), 831-886. Simpson, C., Rathi, A., & Kishan, S. (2021). The ESG Mirage. Bloomberg. https://www.bloomberg.com/graphics/2021-what-is-esg-investing-msci-ratings-focus-on-corporate-bottom-line/ Singh, R. and Chaudhary, A. (2023). Save the planet by slashing food waste. The Hindu Business Line. April 22. Sinha, S. N. (2021). Corporate Social Responsibility in India A Case of Government Overregulation? Economic & Political Weekly, 77(26), 77-83. TERI. (2022). Towards a Clean Hydrogen Ecosystem: Opportunities for Indo-Dutch Cooperation. The Energy and Resources Institute. The City UK (2022). Green finance: A quantitative assessment of market trends. March. The Companies Act (2013). https://www.mca.gov.in/content/mca/global/en/acts-rules/companies-act/companies-act-2013.html The Economist (2008). Do it right. January 19. https://www.economist.com/special-report/2008/01/19/do-it-right The Economist. (2019). Climate Change and Trade Agreements: Friends or Foes?. May 22. https://pages.eiu.com/March-19-ICC-Public-Policy-webinar-USEMEA-MKT_.html The Economist. (2021). Sustainable finance is rife with greenwash. Time for more disclosure. May 22. https://www.economist.com/leaders/2021/05/22/sustainable-finance-is-rife-with-greenwash-time-for-more-disclosure The Hindu Business Line. (2022). Oil & gas sector contributed ₹3.57 lakh crore to govt exchequer in H1 FY22. https://www.thehindubusinessline.com/economy/oil-gas-sector-contributed-357-lakh-crore-to-govt-exchequer-in-h1-fy22/article66281861.ece UNCTAD (2022). Reflecting on Sustainability Standards: Trade and the Sustainability Crisis. UNCTAD/DITC/TAB/2022/4. UNDP (2022). Human Development Report 2021- 22: Uncertain Times, Unsettled Lives: Shaping our Future in a Transforming World. United Nations Development Programme. US EPA (2023). Greenhouse Gases Equivalencies Calculator - Calculations and References. United States Environmental Protection Agency. https://www.epa.gov/energy/greenhouse-gases-equivalencies-calculator-calculations-and-references Way, J. C., Juarez, A. G., Carter, E. A., & Frei, C. W. (2022). Sustainable solar fuels: A new frontier in clean energy. Joule, 6(4), 481-483. World Bank (2019). Using carbon revenues. The World Bank Technical Note 16. https://openknowledge.worldbank.org/handle/10986/31605 World Bank (2022a). Carbon pricing dashboard. https://carbonpricingdashboard.worldbank.org/ World Bank (2022b). State and Trends of Carbon Pricing, World Bank Publications. World Bank (2023). Falling long-term growth prospects – Trends, expectations and policies. Advance edition. WTO (2003). Ecolabelling: Trade Opportunities & Challenges. At WTO Public Symposium- Challenges Ahead on the Road to Cancun. Chair Polak, J. World Trade Organisation. https://www.wto.org/english/tratop_e/dda_e/symp03_gen_ecolab_e.doc WTO (2021). The carbon content of international trade. Information brief n° 4. World Trade Organization. https://www.wto.org/English/tratop_e/envir_e/igo_ib_carboncontent_e.pdf WTO (2022a). Trade and Climate Change. Information brief n° 2. World Trade Organization. https://www.wto.org/english/news_e/news21_e/clim_03nov21-2_e.pdf WTO (2022b). Climate change and international trade. World Trade Report. World Trade Organization. https://www.wto.org/2022wtr Zhang, S., Huang, G., Zhang, Y., Huang, L., Yang, Z., Jiang, Y., ... Chen, X. (2023). Sustained productivity and agronomic potential of perennial rice. Nature Sustainability, 6(1), 28-38. https://doi.org/10.1038/s41893-022-00997-3 Zhao, Y., Wang, C., & Cai, W. (2022). Carbon pricing policy, revenue recycling schemes, and income inequality: A multi-regional dynamic CGE assessment for China. Resources, Conservation and Recycling, 181, 106246. Zielińska-Lont, K. (2019). Quantitative easing and green bonds–Should a central bank be involved in fostering transition towards low-carbon economy? In The International Conference Finance and Sustainability (pp. 201-211). Springer. https://doi.org/10.1007/978-3-030-23508-4_19
|