The financial sector faces the dual challenge of recalibrating its operations and business strategies to support the green transition process while also strengthening resilience to rising vulnerability to adverse climate events so as to safeguard financial stability. On the first challenge, estimates suggest that the green financing requirement in India could be at least 2.5 per cent of GDP annually to address the infrastructure gap caused by climate events, and the financial system may have to mobilise adequate resources and also reallocate current resources to contribute effectively to the country’s net-zero target. On the second challenge, results of a climate stress-test reveal that public sector banks (PSBs) may be more vulnerable than private sector banks (PVBs) in India. Globally, however, measurement of climate related financial risks remains a work in progress. A pilot survey of key stakeholders in the financial system in India suggests that notwithstanding rising awareness about climate risks and their potential impact on the financial health of entities, risk mitigation plans are largely at the discussion stage and yet to be widely implemented. 1. Introduction III.1 There is a broad consensus in the literature that financial systems are exposed to both physical and transition risks from climate change, which propagate through both macroeconomic and microeconomic channels (Basel Committee on Banking Supervision, 2021). Physical risks arise from extreme/acute weather events such as floods, storms, rising sea levels or increasing temperatures which may damage properties and impact lives and livelihoods. On the other hand, transition risks ensue due to economic and societal costs associated with the process of transitioning to a low-carbon economy. Such risks arise due to public policy changes aimed at containing green transition costs, innovation that results in new technology, trade policy restrictions impacting the availability and affordability of existing as well as new technologies, and changes in investor and consumer sentiment impacting the demand pattern of the economy. III.2 The impact of these risks may materialise with uncertain time lags; their frequency and severity may vary considerably over geographies and over time; and they may become increasingly difficult to predict. As the frequency of tail events increases, estimation of default probabilities would become more difficult and uncertain, resulting in higher interest rates and insurance premiums (Basel Committee on Banking Supervision, 2021). In view of higher expected credit loss, lending institutions may turn risk averse, with higher provisions and risk capital, which may adversely impact credit growth, although the economy may need higher, not lower, credit to support successful green transition. The amplification of financial risks, i.e., ‘credit risk’, ‘market risk’, ‘liquidity risk’, and ‘operational risk’ – through macroeconomic and microeconomic channels may pose a serious threat to financial stability, via losses to levered financial intermediaries, disruptions in the functioning of financial markets, sudden and large repricing of assets, and distorting policy transmission channels. III.3 The IMF’s INFORM climate risk index1 indicates that among BRICS countries and major advanced economies (AEs), India is most vulnerable to climate-induced physical risks (Chart III.1.a). In terms of preparedness and resilience to transition risks, the indicator developed by Peszko et al. (2020)2 suggests that while most AEs have high resilience and low exposure, BRICS countries are less resilient and highly exposed. India is the least resilient among BRICS countries but is also less exposed than many in the same group (Chart III.1.b). III.4 While the financial sector would be at the receiving end of the climate risk on the one hand, it also has the potential to catalyse risk mitigation on the other. It is, therefore, important to evaluate both these dimensions to design policies that could enhance the contribution of the sector to green transition while preserving financial stability. In this vein, the remainder of the chapter is organised as follows: in order to better understand the channels through which environmental shocks are transmitted to the financial sector, Section 2 provides a brief summary of the major risks. In Section 3, a dynamic stochastic general equilibrium (DSGE) model is developed to estimate the likely impact of climate shocks on the Indian financial system. The findings of a pilot stakeholder survey conducted to gauge participants’ awareness of the challenges associated with climate change and their level of preparedness are summarised in Section 4. The findings of a climate stress test applied to the current asset portfolio of Indian banks are covered in Section 5. Section 6 is devoted to estimation of green finance requirements for India. Section 7 brings out the debates surrounding effectiveness of some of the risk mitigation techniques in the financial sector that are used internationally, with an analysis of India’s progress in this regard. Section 8 concludes by offering some future directions. 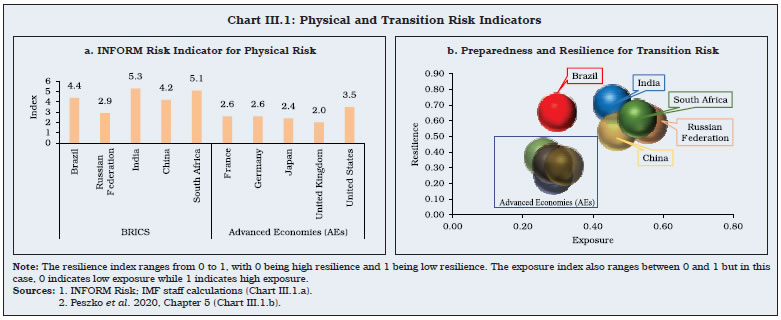 2. Financial Risks due to Climate Change III.5 Attempts to understand, measure and model financial risks associated with climate change are of recent origin. Although the conventional risk management tools may serve as a springboard, climate risk drivers contain unique features that could challenge the incorporation of these risks into existing processes (BCBS, 2021). This section is devoted to a granular analysis of these risks with a special focus on India. Credit Risk III.6 Both physical and transition risk drivers from climate events can reduce a borrower’s capacity to service or repay debt and erode a lender’s ability to fully recover losses if the pledged collateral values are insufficient. Banks, that are highly exposed to sectors more dependent on fossil fuels, or sectors which contribute highly to emissions due to the nature of their products, such as automobile and thermal power, are more exposed to transition risks. III.7 In the absence of a full-fledged taxonomy, an appropriate approach could be adopted to classify industries into green and brown for the purpose of analysis. This may be done on the basis of a sector’s energy intensity, measured by the ratio of energy input cost to the value of the sector’s gross output. A higher ratio indicates that the sector is more energy intensive and thus less green3. A granular analysis of data suggests that Indian banks’ exposure to high energy intensive sectors like generation and distribution of energy (utility sector4) and metals is relatively high (Box III.1). III.8 Another metric for classification of industries into green and brown is the ratio of sectoral energy consumption to its gross value added (GVA), which is gross output minus the cost of intermediate inputs. An analysis employing this classification suggests that hearteningly, in the recent years, bank credit to green industries has accelerated at a pace faster than that to brown industries, which is a sign of improved recognition of climate risks. The acceleration has primarily been driven by PVBs (Chart III.2.a and b). The GNPA ratio of green industrial loans, however, has been higher during the same period, especially for PSBs (Chart III.3.a and b). 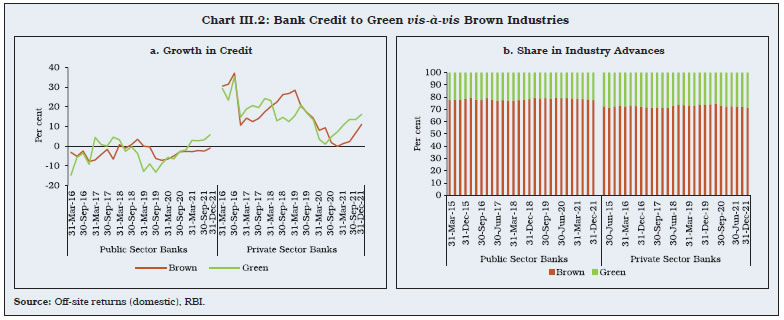
Box III.1
Measuring Indian Banks’ Transition Risk using Energy Intensity Metrics The energy use intensity of the utility sector, transport and storage operations, metal and metal products, manufacturing of non-metallic mineral products, paper products and production of automobiles, as estimated from the KLEMS5 data for India, are higher than other activities in the economy. Mapping of energy intensities with sectoral deployment of bank credit (at end March 2022) suggests that banks’ exposure is relatively higher in utilities, metal industries, and transport and storage operators (Charts 1 a and b).  Although at the aggregate level, the exposure of the banking sector to climate change risks appears moderate, a spatial analysis highlights sharp contrasts in exposures across bank groups and across states. While the transition risk for the PSBs stems largely from their exposure to the conventional energy sector, especially in West Bengal and NCT of Delhi, their private sector counterparts are exposed more to the transport operators’ sector, most notably in Jharkhand and Odisha (Chart 2.a and b). Both the bank groups are exposed to the metal industries. Except for PVBs’ exposure to automobile sector in Haryana, Punjab, Maharashtra and Tamil Nadu, the aggregate exposure of banking sector to the automobile production is limited. Basic metals and utilities are sectors with low interest-coverage ratio as well as comparatively high GNPA ratio (Ghosh et al., 2022). Their higher transition risk suggests that, going forward, these sectors may pose higher climate credit risk for the Indian banking system. Reference: Ghosh, S., S. Nath, A. Narayanan, and S. Das (2022). Green Transition Risks to Indian Banks. Reserve Bank of India Bulletin, March. | III.9 The Non-Banking Financial Companies (NBFCs) complement and supplement the banking sector in India through their grassroot level presence and ability to deliver tailor-made products to meet varied needs of the customers. On the liabilities side, while NBFCs have been the largest net borrowers of funds from the financial system, on the asset side, the highest chunk of their lending is directed to the industrial sector (Chart III.4). 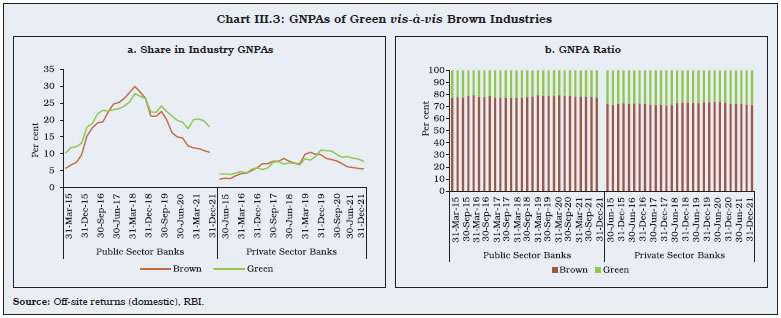
 III.10 NBFCs extend about half of their gross credit to the power and vehicle/auto segments, which have high carbon footprints. Moreover, around six per cent of NBFC credit is directed to micro, small and medium enterprises (MSMEs), which typically depend on conventional fuel to operate. Given that NBFCs have strong backward and forward linkages with rest of the financial system and the real sector, any large-scale default arising on account of physical or transition risk in any of these segments might translate into macro-financial instability. Therefore, in addition to the banking sector, there is a need to closely monitor NBFCs for their transition risks, both direct and indirect (Box III.2). Box III.2
Role of NBFCs in Propagating Climate Change Impact A stylised partial equilibrium model to analyse real sector outcomes in response to a climate shock to NBFCs is developed in line with Ghosh and Mazumder (2023). The interrelationship between banks and NBFCs is the backbone of this model. While NBFCs are assumed to be non-deposit taking, scheduled commercial banks (SCBs) are deposit-taking financial institutions that extend loans to NBFCs. By assumption, SCBs lend to the large firms, and NBFCs fill-in the funding gap for small borrowers albeit by charging higher interest rates than SCBs (Chart 1). 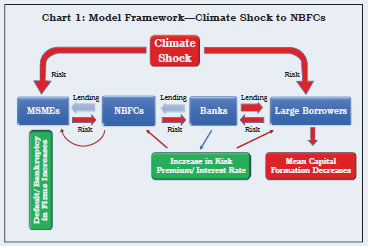 In the model, climate change impacts large as well as small firms. The direct impact on SCBs is due to their stressed lending to large borrowers. In addition, the indirect channel works through climate change impact on small firms, which produce intermediate goods. Some of these firms may turn bankrupt, and default on their NBFC obligations. Although NBFCs by themselves are considered relatively small, the simulation results of the model show that the impact of a climate event could propagate to other sectors of the economy, given the NBFC-SCB borrowing interlinkages. When a climate shock first increases the riskiness of a small firm and then gets transmitted to a large firm, economy wide delinquency increases. Model simulation results indicate that faced with an adverse weather event and increase in risk, the distribution of capital stock shifts to the left (shift from blue distribution to orange in Chart 2) indicating its adverse effects on capital formation. 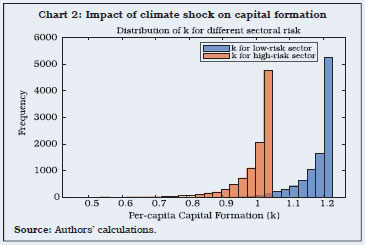 To sum up, notwithstanding a low share in total credit, any large-scale default in loans extended by NBFCs on account of weather events amplify delinquencies, given NBFCs’ backward and forward linkages. Multiple propagation channels could increase the severity of a climate shock. Therefore, a careful vigil on NBFC sector is necessary during the process of transitioning towards a greener economy. Reference: Ghosh, S., and D. Mazumder (2023). Do NBFCs propagate real shocks?. Journal of Asian Economics: 101590. | Market Risk III.11 Market risk captures the change in value of financial assets due to changes in interest rates, exchange rates, asset prices, and their volatility. Climate transition risks can reduce financial asset values, leading to a breakdown in correlations and resultant dilution in the effectiveness of hedges. A study on the relationship between climate change and Asian stock markets suggests that the former has a statistically significant negative impact on long term return volatility of about 20 per cent of stocks (Oloko et al., 2022). III.12 In addition, transition risk may result in higher risk premiums for carbon-intensive borrowers, thereby lowering valuations of financial assets that are used as collateral. Some studies argue that the securities accepted as a guarantee under the Euro system collateral framework are not “aligned” with the climate targets of the Paris Agreement, and are, therefore, exposed to transition risks (Weber et al., 2021). Liquidity Risk III.13 Climate risks can raise the liquidity risk of banks by impacting their capacity to raise funds and their ability to liquidate assets to meet their obligations. One of the main routes through which liquidity risk can transmit is through the credit channel. Credit lines, such as cash credit and overdrafts offered by banks to firms, are considered as liquidity insurance. In times of crisis, competing claims on liquidity from firms and the lenders may give rise to a tension between the two. Such tensions generally manifest as higher spreads on credit, higher charges for covenant violations, and barriers to drawdown of credit lines (Acharya et al. 2020, 2021). Such situations may follow severe climate events in which firms may ask for significant liquidity support while banks may be constrained to provide that support due to a degradation of their asset quality (Schu¨wer et al., 2019 and Rauf, 2023). Rauf further finds that affected banks are expected to face liquidity shortage and may restrict drawdowns of credit lines in the future. Operational Risk III.14 Operational risk arises mainly from inadequate controls within a bank, employee mistakes, and breakdowns in internal processes and systems, which in turn impact a bank’s reputation. Climate events may exacerbate operational and reputational risks as corporations and banks could be subject to legal and regulatory compliance risk, especially from climate-related lawsuits. Further, extreme weather events may impact the financial sector by forcing office closures or damaging crucial resources such as data centres. Stronger enforcement of regulatory and disclosure requirements by the regulator coupled with a competitive market structure may help mitigate the adverse impact of climate change. For instance, a natural disaster could have a greater impact on the financial stability if the market for insurance of a particular vulnerable sector is concentrated. If, however, the market has many strong and active participants, the resulting higher shock-absorbing capacity of the insurance market may support smoother adjustments to adverse climate events (Alvarez et al., 2020). 3. Modelling the Macro-Financial Transmission of Climate Risk III.15 To understand how physical shocks or a transition towards a greener economy may impact capital formation, interest rates and real output, central banks widely use the ‘Environment-DSGE Models’. Specific examples include the ‘Economic Projection and Policy Analysis (EPPA) Model’ developed by the ‘MIT Joint Program on the Science and Policy of Global Change’ and the quarterly National Institute Global Econometric Model (NiGEM) (NGFS 2021). These models can help analyse the transition risks to financial stability arising from adopting a net-zero strategy, and the dual role of central banks, who, on the one hand, contribute to the net-zero goal and on the other, strive to preserve financial stability. III.16 A workhorse DSGE model which is calibrated for India, where climate risks percolate through the stock of capital, shows that natural disasters impact consumption more than income (Box III.3). The results highlight the role of economic and financial policies to smoothen consumption and thereby help the economy to converge to its steady-state. Box III.3
Climate Risk Impact Assessment in a DSGE Model for India A parsimonious DSGE model is constructed where the economy consists of a high risk-averse representative household, a final good sector, a continuum of intermediate goods producers, and a policy authority. The policy authority meets the requirement of its spending through lump-sum tax revenues and bond issuances. The policy authority is also guided by a standard Taylor Rule where the monetary policy rate (and also by assumption, the bond yield) is a function of the output gap and inflation gap. This model closely follows Christiano et al. (2005) and Smets and Wouters (2007). In this model, climate risks percolate into the real sector via physical damage to capital. The main objective of this exercise is to evaluate whether the damaged capital stock replenishes itself through forces in the capital markets in a short horizon or if there is a need for policy intervention. This is modelled based on the following capital law of motion faced by the representative jth intermediate firm:
Output contracts instantaneously by more than 0.5 per cent and continues to fall by more than 1 per cent up to 5 quarters. This instantaneous fall in output translates into lower incomes, thereby resulting in a fall in consumption. The impact on consumption is more pronounced than output as the household is highly risk averse. These developments are likely to get translated into an increase in the financial sector vulnerability. A deterioration of capital, due to an adverse climate shock, results in a lagged increase in the price of capital and a contraction in output. To recover from the damage to the capital stock due to the climate shock, investment demand expands significantly. On the whole, this pushes up the aggregate demand, which, along with the increase in the price of capital, pushes up inflation. Moreover, given the inflation targeting framework and resultant higher weight to inflation in the Taylor rule, the policy authority tightens the interest rates, increasing losses for firms. A contraction in capital stock due to the climate shock also deteriorates the value of borrowers’ collateral (Gertler and Karadi, 2011). Consequently, delinquencies may increase, and this may affect bank profitability. Increase in interest rates and pressures on market and funding liquidity may exacerbate the financial stability risks. Reference: Christiano, L. J., M. Eichenbaum, and C. L. Evans (2005). Nominal rigidities and the dynamic effects of a shock to monetary policy. Journal of political Economy, 113(1), 1-45. Gertler, M., and P. Karadi (2011). A model of unconventional monetary policy. Journal of monetary Economics, 58(1), 17-34. Ghosh, S., S. Nath, and P. Gopalakrishnan (2022). Distributional Impact of Cyclones on Indian Households’ Income and Consumption. Forthcoming, RBI Working Paper. Smets, F., and R. Wouters (2007). Shocks and frictions in US business cycles: A Bayesian DSGE approach. American economic review, 97(3), 586-606. | Measurement of Climate Risk III.17 Measurement of financial risks associated with climate change invariably involves strong assumptions, given the high uncertainty about physical and transition risk drivers, data gaps, and model uncertainty. The unique features of climate-related financial risks necessitate granular and forward-looking measurement methodologies to account for these uncertainties. While the need for such methodologies and multiple scenarios for stress testing is increasingly recognised by banks and supervisors, frameworks to systematically translate climate change scenarios into standard financial risk analysis are still a work in progress (NGFS, 2019). Due to sectoral, jurisdictional and geographical heterogeneities, granular data on exposure to climate change are needed to incorporate these risks in analysis spanning three areas: translating climate risk drivers into economic risk factors; linking climate-adjusted economic risk factors to exposures; and measuring financial risk from climate-adjusted economic risk (BCBS, 2021). III.18 By their very nature, forward-looking climate risk estimation methods are required to span a longer time frame as compared with traditional macroeconomic exercises. This requires conditioning assumptions about balance sheet adjustment options. As a result, banks and supervisors often base their scenario analyses, or stress tests, on scenarios developed by third parties. III.19 To date, progress in capturing banks’ exposures to physical risks empirically has been less tangible, and the focus has been on mapping the near-term transition risk drivers to counterparty and portfolio exposures. Further, supervisors and banks have laid more emphasis on credit risk modelling, with relatively lesser focus on market risk, and very limited attention to operational and liquidity risk, while reputational risk assessment has remained predominantly qualitative (BCBS, 2021). Although work related to translating climate risks into robustly quantifiable financial risk is currently at a nascent stage, it is gathering momentum. 4. Stakeholders’ Survey on Climate Risks III.20 A major factor that influences the effectiveness of policies and their transmission is market perception. An anonymous survey of various financial institutions in India was undertaken in December 2022 to assess the market perception of climate risks, their awareness about the same and policies implemented/ being contemplated by these institutions to hedge against them. The informal survey was conducted among major banks, NBFCs, brokerage institutions and other financial firms. The analysis in this section pertains to twenty responses received and is, thus, indicative in nature (Chart III.5).
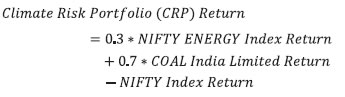
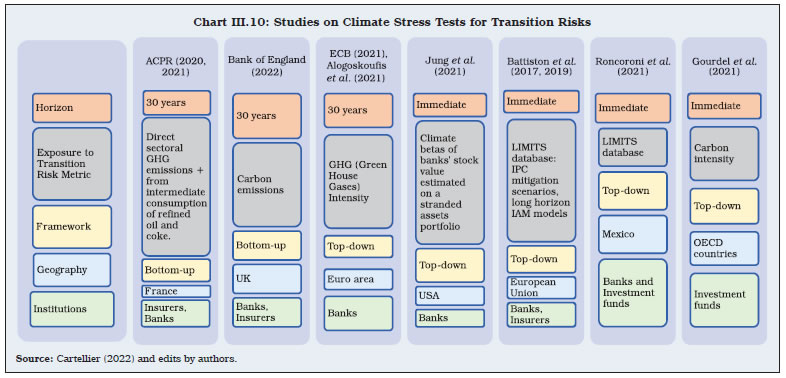
Perception of Exposures III.21 Almost 90 per cent of the respondents considered climate risk as a material threat to the institution’s business. When asked to rank the climate risks, about half of them identified transition risk as the prime concern for their business. Another 26 per cent respondents identified it as the second biggest risk (Chart III.6). III.22 According to the respondents, energy and mining sector was identified as the most exposed to climate risk, followed by automobiles, agriculture, infrastructure, and construction. Sectors like textiles and engineering were not expected to have significant exposure (Chart III.7). Interconnected exposures and risks III.23 Sixty per cent of the institutions surveyed claimed to have incorporated climate risk in their risk management framework and 80 per cent respondents confirmed that their board has discussed climate related risks in the recent financial year. However, most of these institutions are yet to develop specific mechanisms to identify and deal with such risks. Among those surveyed, 65 per cent responded that there is no existing division which specifically deals with climate related assessment. In the absence of an official taxonomy, only 45 per cent respondents had developed their own norms to explicitly classify counterparties into ‘green’ and ‘brown’ and a similar percentage of respondents considered climate sustainability while selecting projects for financing. The deficiency in the assessment of climate risks is also reflected in the lack of hedging against such risks. Only 40 per cent of those surveyed had mobilised new capital for scaling up green lending or have set any target for such lending. Forty-five per cent have introduced new financial products which can take advantage of the new opportunities arising out of green finance. III.24 Some of the respondents confirmed having developed certain mechanisms to assess and hedge against risks pertaining to climate change. Two respondents said that they categorise climate risk under the ICAAP Pillar –II risk category. One of them further elaborated that it has allocated additional capital under Pillar-II category for loans made to high emission sectors. Challenges III.25 The lack of capacity and data seem to be the biggest impediments to assess climate risk and implementing policies to mitigate them. Almost 95 per cent of the respondents said that they lack appropriate data to robustly assess climate risks. Consequently, only 25 per cent of respondents use scenario analysis to assess climate change risks. III.26 Regarding expectation of policy support, many respondents suggested implementing mandatory disclosures from borrowers under Scopes 1, 2, and 3 emission categories. Some respondents also asked for a national database on climate scenarios at a disaggregated geographic level to assess physical risks from climate events. Respondents also opined that a well-defined taxonomy will help in clearly assessing and preparing for transition risks. 5. Climate Stress Test for Indian Banks III.27 While it is important to quantify the impact of climate change risks on financial system and its constituents, it is difficult to rely on traditional risk quantification techniques. This is because these methods rely on past data, but extant data may no longer be sufficiently representative of extreme climate events that may occur in the future. Climate stress tests are scenario-based exercises that assess the loss to the financial system/entities due to climate related risks by adapting the methodology of traditional stress tests to climate-related exigencies. III.28 The key differences between climate and non-climate stress tests lie in scenario horizons, as the former are usually for longer periods (30 to 80 years) (Chart III.8). III.29 Climate stress tests have been implemented by central banks and regulators for testing system-wide and entity-specific resilience to climate-related risks. A significant amount of recent academic research has also been devoted to developing climate stress testing methodologies. Exercises have been carried out by the French supervisor (ACPR) in conjunction with Banque de France (ACPR, 2020) and Bank of England (BOE) using a bottom-up framework with a direct participation of banks and insurance companies. Other top-down exercises have been undertaken by the European Central Bank (ECB) (Alogoskoufis et al., 2021) among others. So far, these methodologies are applied to measure physical risks (Chart III.9) and transition risks (Chart III.10) and significant differences exist across them. Macro stress tests and banks’ internal assessment of climate related risks have not resulted in additional capital requirements, so far. III.30 Transition risk associated with climate change remains a major concern of most financial market stakeholders, all over the world. One approach to measure the risk involves estimating a climate risk factor based on ‘stranded’ assets portfolio returns (Jung et al., 2021). The approach relies on the idea that a transition to a less carbon-intensive environment may result in underutilisation of existing fossil fuel reserves, which could be viewed as stranded assets. A lower return on a stranded asset portfolio as compared to market-wide benchmark indices, thus, could be indicative of a higher transition risk. A stranded assets portfolio similar to the one in Jung et al. (2021) is constructed for India, with 30 per cent weight to NIFTY Energy Index and 70 per cent weight to Coal India Limited. In other words, the returns on the stranded assets portfolio calculated below are used as a climate risk factor; it rises when fossil fuel stock prices rise relative to the market and vice versa.
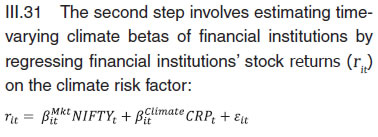
 The climate betas for the Indian banking institutions were estimated on a daily frequency by running 252-day rolling regressions to capture the dynamic time-varying nature of the exposure. Daily climate betas were estimated separately for NIFTY Public Sector Banks Index and NIFTY Private Banks Index starting from November 2011 up to February 2023. Climate betas for public sector banks are mostly positive and have been rising consistently since 2018, with a slight moderation beginning 2022 (Chart III.11.a). Climate betas for private banks largely remained in the negative territory and were much lower than those for public sector banks (Chart III.11.b). This alludes to the greater sensitivity, and therefore higher risk of public sector banks to climate related risks as compared to private sector banks. III.32 The third step involves estimation of expected capital shortfall on account of aggregate climate related stress using a CRISK framework following Jung et. al. (2021) which defines the bank’s capital shortfall as the amount of capital reserves a bank needs to hold minus its equity as estimated by  Where CRISKit represents the capital shortfall of bank i at time t, k represents the prudential ratio of equity to assets, Dit represents the book value of debt and Eit represents the market value of equity and θ is the climate stress level. In terms of the above equation, a negative capital shortfall (CRISK) represents no stress, while a positive CRISK represents stress in the bank’s balance sheet, as it may not be able to meet its regulatory obligations. Several alternatives were evaluated for the above equation. For instance, when only borrowings of the bank were included in ‘D’, there was no shortfall for any bank (Chart III.12.a). However, when total deposits and borrowings were used, many banks were found to face shortfalls (Chart III.12.b). Thus, when the repayment obligations of the bank cover only its borrowings, banks remain solvent and can meet regulatory capital requirements even in the face of sudden adverse climate shock. However, if the banks are obliged to repay their borrowings as well as deposits, larger capital shortfalls may be expected. In the second case, the amount of capital shortfall as well as their density is higher for PSBs than PVBs, highlighting greater risks faced by the former. 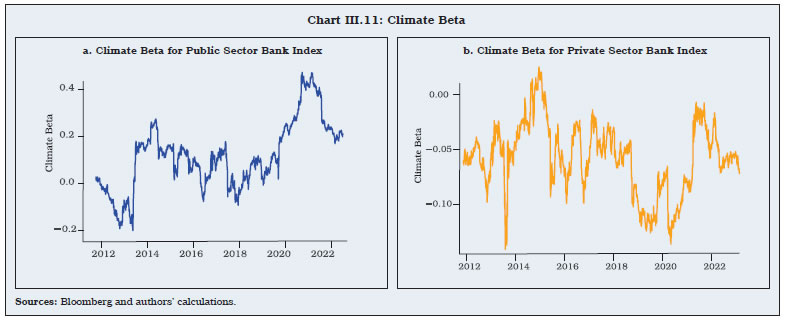
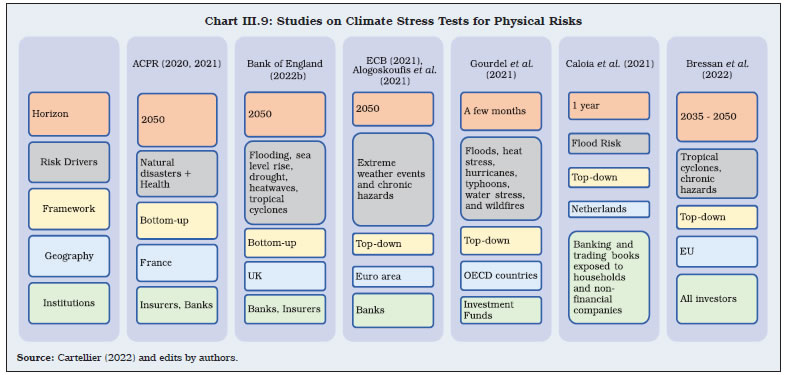
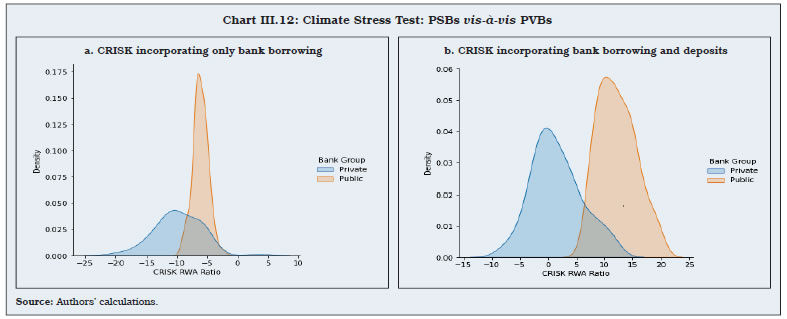 III.33 The stress test results depend crucially on the assumptions relating to the severity of climate events and banks’ short-term credit and deposit compositions and as such, are indicative in nature. Further, the CRISK framework projections are not baseline forecasts but shed light on low probability extreme climate events and serve as a useful tool for monitoring risks to financial stability. 6. Green Financing Requirement III.34 Apart from the requirements of higher banking capital, a successful green transition plan would also entail a large new investment in an array of socio-economic infrastructures. A large number of estimates by various institutions suggest that the total financing requirements by India could be approximately 5 to 6 per cent of the annual GDP at the lower end6 (Table III.1). | Table III.1: Projected Estimates of Green Finance Requirements | | Organisation | Target | India | | Climate Policy Initiative, 2022 | Till 2030 for NDC | USD 170 billion per year till 2030 | | International Energy Agency, 2022 | To reach net zero emissions by 2070 on average between now and 2030 | USD 160 billion per year | | Council on Energy, Environment, and Water-Center for Energy Finance, 2021 | To achieve net-zero carbon emission by 2070 | USD 202 billion per year | | McCollum et al., 2018 | Below 1.5 degree Celsius from 2016-2050 | USD 288 billion per year | | McKinsey, 2022 | Net zero emissions by 2070 | USD 44 billion per year increased by 3.5 times by 2030 and by 10 times by 2040 | Note: Most of the reports mentioned above do not specify the methodology used in their estimation. Given the possibility of differences in their underlying assumptions, scenarios and coverage, estimates may not be strictly comparable across the board.
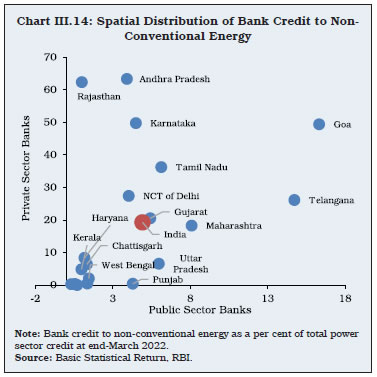
Source: Reports of respective organisations/ authors as specified in the reference list. | The required investment amount would rise if the horizon to achieve the net zero target is shortened. III.35 An innovative estimate of climate finance requirement is developed following Hughes et al., 2010. This framework estimates a gap between available infrastructure and what would have been achieved in the absence of climate change. Under this framework, regressions are estimated for more than 10 indicators separately using cross-country data since early 1960’s. Details of the model and underlying assumptions for India are presented in Annex III.1. III.36 The estimates suggest that, in India, the gap between current infrastructure and the level of infrastructure which could have been achieved in the absence of climate events would be about 5.2 per cent. This, in turn, suggests that an additional annual investment of about 2.5 per cent of GDP would be required to replenish this infrastructure gap by 2030. As these estimates do not explicitly take into account any investment required for mitigation and adaptation due to climate change, the actual funding requirements are likely to be higher. 7. Mitigation of Financial Risks III.37 To mitigate climate change risks and their macro-financial consequences, it is necessary to have a financial system in place that can support sustainable initiatives and ringfence the financial sector from climate risks. The options for mitigation are plenty but each has its own pros and cons. The debate about best strategies remains complex, multi-layered, and not yet settled. Ringfencing Financial Sector from Climate Risks under Basel Norms III.38 Basel III, the third set of international banking regulations defined by BCBS operates under three pillars: 1) capital adequacy requirements; 2) supervisory review; and 3) market discipline (including rules on public disclosures). Which of these three pillars is most suitable to ensure that banks have adequate capital to manage climate risk and uses better risk management techniques in monitoring and managing these risks, is a subject of intense policy debate. Advocates of Pillar 1 suggest that it cannot be completely ignored as many of the Pillar 2 measures that are already available to supervisors are not being utilised optimally. Also, Pillar 3 measures on disclosures and reporting are necessary but insufficient to drive the policy and behavioural changes required (Climate Safe Lending Network, 2022). III.39 On the other hand, the focus of supervisors world over, has increasingly shifted to Pillar 2 measures as the time horizon of climate-related financial risks is usually considered long, with a high degree of uncertainty. Standard Pillar 1 instruments of regulating minimum capital requirements might be suboptimal in addressing such risks as these measures are not developed for longer time periods. For climate-related financial risks, the historical loss data is not available, and a more forward-looking approach is required (FSB, 2022). As uncertainty increases with accumulated assumptions and longer time span, it is difficult to do capital planning for 20-30 years (EBF Staff, 2022). Moreover, as climate risks become evident, banks may change their lending strategies proactively. Requiring banks to set aside capital today to cover losses for risks that may only materialise long after the maturity of most of their current exposures may be inconsistent with the construction of the prudential framework in a scenario where the investment strategy changes substantially (FSB, 2022). III.40 In contrast, the intrinsic flexibility of the supervisory review is a better fit for ensuring that banks effectively manage such risks and have sufficient loss-absorbing capacity. For instance, supervisors may require banks to submit a timeline to mitigate their exposures to climate risk and improve their risk management framework. In case of persistent and unjustified deviations, the findings may be factored into regular Pillar 2 assessments for capital. Additionally, improved Pillar 3 disclosures may aid in attaining the transparency required for market incentives to operate effectively (Coelho and Restoy, 2022). Green Credit and Priority Sector Norms in India III.41 The early efforts of the Reserve Bank—for example its December 2007 notification—were directed at creating awareness and nudging the banks towards climate sensitive policies. In the recent decade, however, the Reserve Bank has initiated a more direct approach. The inclusion of renewable energy sector under priority sector lending (PSL) scheme in 2015 was one such direct measure. Under this scheme, firms in renewable energy sector are eligible for loans upto ₹ 30 crore (increased from ₹15 crore since September 4, 2020) while the households are eligible for loans upto ₹10 lakh for investing in renewable energy. A preliminary data analysis suggests that this approach was successful in channelising more resources to the renewable energy sector. As a result of the first policy intervention in 2015, share of non-conventional energy sector in credit, especially by PVBs, increased during 2015-2018. The subsequent decline in share was arrested by the second policy intervention in 2020 (Chart III.13.a and b). III.42 There is a significant regional and bank-group wise variation in the deployment of credit to the non-conventional energy sector. Both PSBs and PVBs extended higher than national average credit to the sector in Goa, Telangana, Tamil Nadu and Gujarat. On the other hand, states like Kerala, Haryana, Chhattisgarh and West Bengal received lower than national average credit to the sector, by both PSBs and PVBs (Chart III.14). Green Taxonomy and Disclosures III.43 Reliable and standardised information dissemination and disclosure is the backbone of efficient financial intermediation. A uniformly accepted ‘green taxonomy’, therefore, plays a major role in the identification, standardisation, disclosure and awareness regarding climate change (Chart III.15). While available definitions include general statements, market-led standards, and broad criteria for policy, regulatory, or statistical purposes, a globally accepted single definition for green or sustainable finance is largely missing. 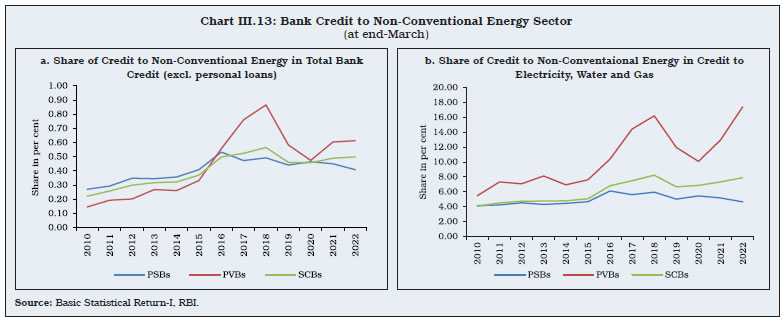
 III.44 As a principle, any financial instrument whose proceeds are used for environmentally sustainable projects, initiatives, and policies under the single goal of promoting a green economic transformation could be referred to as green finance. A good taxonomy provides a strong signal to investors and other stakeholders and assists in their decision-making by identifying the non-financial benefits of a given asset. Taxonomies can be classified depending on four key characteristics: a) objective: which sustainability goals are supported? b) scope: which activities/ industries/entities are included? c) target: how is the purpose translated into a measurable target? d) output: what type of information is provided? (Ehler et al., 2021). While countries like China, Russia, Japan, South Africa, Sri Lanka, Indonesia and Bangladesh already have their taxonomies approved or in use, most of the countries are still developing their taxonomies (IPSF, 2022). 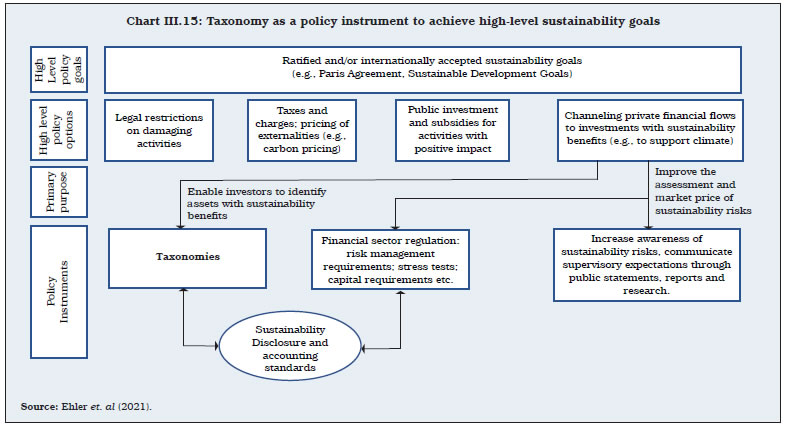 III.45 India is yet to publish a formal taxonomy, although SEBI and the Central Government have issued some guidelines which are covered in detail in Chapter IV of the Report. ESG stock indices, which were adopted across the globe as part of the Sustainable Stock Exchange initiative, are effective instruments for quantification of exposure and management of sustainability risks. Available cross-country data suggest that companies which adopted ESG related disclosures reported excess market adjusted stock returns during the pandemic period for many countries (Ghosh and Nath et al., 2023). A similar trend was observed in the case of India as well during the COVID-19 period (Box III.4). The findings may also hint that companies that reported to have undertaken ESG initiatives are possibly among the financially stronger companies, that weathered the pandemic crisis better than other players. Blended Finance III.46 The term ‘blended finance’ refers to the strategic use of public and philanthropic resources to mobilise private capital for development purposes. In addition to facilitating the flow of new capital into high-impact sectors, blended finance can be used to effectively leverage the expertise of the private sector in identifying and executing developmental investment opportunities and strategies. Typically, grant funding is blended with other sources of capital such as debt or equity to maximise funding and social impact capacity. III.47 Blended finance initiatives are usually oriented towards developing economies through different forms of intervention. These include, inter alia, concessional debt or equity, guarantees for credit enhancement to particular initiatives, and technical assistance funds (TAFs). A report that captured around 600 blended finance transactions till 2020, representing an aggregate financing of nearly USD 144 billion, found that funds such as TAFs have consistently accounted for the largest share of blended finance transactions, while there was a notable uptick in the prevalence of bonds from 2017-2019 (Convergence, 2020). Further, there has been a decrease in the concurrent use of multiple blending approaches indicating less complexity as structures become streamlined. Sub-Saharan Africa remains the most targeted region for blended finance with a gradual shift towards Asia. Box III.4
Performance of ESG Indices vis-à-vis Broad Market Indices ESG Leaders’ index, published by Morgar Stanley Capital International (MSCI), consists of market capitalisation weighted stock prices of corporates that make greater environment, social and governance related disclosures as compared to their peers. Where ut represents the error term of the regression. The estimated coefficient β1 captures the sensitivity of ESG returns to the broad market movements. The difference between actual and estimated returns on ESG Leader’s index is an indicator of their excess returns. Out-of-sample estimates for India suggest that average excess returns were positive during the COVID-shock (Ghosh and Nath, 2023) (Chart 1). Reference Ghosh, S., and S. Nath (2023). ESG Disclosures and Performances: Cross-Country Evidence. Reserve Bank of India Bulletin, February. MacKinlay, A. C. (1997). Event Studies in Economics and Finance. Journal of Economic Literature, 35(1), 13–39. | III.48 Due to the potentially higher impact of climate change and lesser per-capita consumption of energy in Sub-Saharan Africa and South Asia, investment in renewable energy through blended finance has a greater opportunity in these regions. Within these, India represents 80 per cent of total renewable energy investment potential, followed by Kenya and South Africa (Tonkonogy et al., 2018). There have been several successful examples of blended finance being used in India to enable additional investment in social and developmental sectors. The recently launched healthcare blended finance facility, for instance, was supported by USAID and addressed the COVID-19 pandemic response in India (Chakraborty and Rao, 2022). The case study of a climate-smart agriculture project, the Integrated Fish Farming in Odisha, however, demonstrated that actors have some reservations regarding blended finance implementation. While local banks were hesitant to embrace blended finance due to procedural restrictions, the implementing agency found the incentive structure unappealing and overloaded due to frequent monitoring (Dey and Mishra, 2022). Green Bonds III.49 Green bonds are instruments that can help finance long-term investments into projects which can mitigate climate change. China has the highest amount of green bond issuances till date (since 2007) (Chart III.16). III.50 As on April 28, 2023, 63 green bonds were issued in India. Issuer-wise break up shows that corporates and PSUs have issued the highest number of these bonds (Chart III.17). (A detailed discussion on green bonds is covered in Chapter IV). Non-Life Insurance III.51 Insurance can help households and firms hedge against climate risks and consequently, can reduce risks for banks which are lenders to such households and firms. However, non-life insurance penetration remains low in India with total premium being just around 1 per cent of GDP in 2021 while the global average was about 4 per cent. Non-life insurance density measured as per-capita insurance premium was just USD 22 in India in 2021 while global average was USD 492 (IRDA, 2021). IMF ranked India at 131st place in a list of 168 countries in terms of non-life insurance coverage. On the positive side, both insurance penetration and insurance density have been rising fast in India and their growth trajectories have been much higher than global growth rate for the past 15 years (Chart III.18.a and b).  III.52 One of the challenges to increasing insurance penetration, especially as a climate risk management tool, may be the low claim-settlement ratio in case of climate catastrophes. The ratio for climate events in 2019-20 and 2020-21 was 28 per cent and 29 per cent, respectively. Even though IRDA has issued guidelines to ensure that claims related to natural disasters are attended promptly, many claims remained unresolved several months after the incidents (IRDA, 2021 and 2022). This can potentially discourage households and businesses from buying insurance protection against climate risks. Insurance underwriting risk III.53 In the case of large and concentrated insured losses, insurance companies face the risk of insolvency. More frequent and severe weather events have resulted, and could continue to result, in underwriting risks: that is, higher-than-expected claims against insurance for physical risks. Claims faced by non-life insurers with respect to certain weather-related catastrophes have increased in recent decades. While part of this increase may be due to increases in exposure (i.e. increasing value of property insured in areas prone to physical risks), it may also be due to increase in severity of weather events. In the USA, destruction caused by hurricane Andrew resulted in some insurance companies going insolvent in 1992 (McChristian, 2012). Failure and distress in the insurance sector can potentially destabilise the financial system. III.54 One of the ways to mitigate underwriting risks is diversification. Insurance companies which operate over varied geographical locations will have lower exposure to any particular severe weather event as each such event will affect only a small portion of its counterparties. With global cooperation, an innovative financial risk transfer solution called Index Based Flood Insurance (IBFI) has been developed, particularly suitable for states with many small holding farming communities, against flood losses. Re-insurance is another tool which can help diversify risk by allowing insurance companies to share some of the physical risks with financial institutions that are not directly exposed to them. Commodity Futures III.55 Environmental futures are the latest innovation in the financial market for commodities. Beginning 1995, a programme in the United States established tradable allowances for the emission of sulphur dioxide. Efforts are on to develop comparable tradable permits for other air pollutants, particularly carbon dioxide, in several other countries. In order to establish a carbon market, a nation must first set an upper limit on its emissions and then distribute an equivalent number of tradable permits or credits to emitters. A corporation has the option to increase its emissions by purchasing additional credits at the market rate, but it will also weigh the potential financial benefits of limiting or even reducing its emissions. The International Petroleum Exchange started trading futures on the price of carbon-dioxide emission rights in April 2005, following the European Union’s imposition of limitations on companies’ emissions of carbon dioxide and emission of greenhouse gases by others. The success of the policy can be gauged by the fact that within three months, it was conducting daily trades on more than 500 contracts (Levinson, 2005). III.56 The Government of India has initiated actions to create a market for carbon credits which will help India achieve its NDC goals. Between 2010 and June 2022, India issued 35.94 million carbon credits (Yarlagadda, 2022). For details, please refer to Chapters II and IV. Greening of Central Bank Balance Sheet III.57 Sovereign debt issued by reserve currency countries generally forms part of a central bank’s forex reserves. Given the differences in carbon footprints across countries, the ‘greenness’ of sovereign bonds issued by them varies drastically. The composition of sovereign debt held by a central bank in its reserve portfolio determines the carbon intensity of such portfolio. If countries with higher carbon footprints have more weightage in the portfolio, it leads to higher carbon intensity of the reserves. In some central banks, the asset portfolio may also consist of corporate bonds and other private securities. Greening of central bank balance sheet involves re-adjustment of these portfolios to increase the weightage of green bonds. III.58 So far, the international experience in greening of central bank balance sheets is limited. BoE is the first central bank to issue climate related financial disclosures annually since 2020. The report consists of a review of carbon emission intensity of the BoE’s assets. As part of the quantitative easing strategy during COVID-19, the BoE had bought over GBP 20 billion worth of corporate bonds (Milliken, 2022). The BoE declared in 2021 that it will try to reduce the carbon intensity of its corporate bond portfolio and their latest financial disclosure shows that the weighted average carbon intensity of the portfolio has declined by 18 per cent from 2020 (Bank of England, 2022a). The ECB had also undertaken quantitative easing during COVID-19 in which it bought corporate bonds. An assessment by the ECB in 2020 found that 8.4 per cent of its asset portfolio consisted of debt instruments of fossil fuel related companies, while only 1 per cent was ESG securities (Oil Change International, 2021). The ECB has since undertaken policy measures to green its balance sheet. In 2021, it announced that certain ESG bonds will be accepted by the ECB as collateral. The Swiss National Bank and Banque de France have also announced that they will not have corporate bonds of companies which use coal in their portfolios (Oil Change International). III.59 In case of India, as the Reserve Bank does not hold corporate bonds in its portfolio, the above measures are not applicable. If the Reserve Bank keeps some of the recently issued sovereign green bonds in its portfolio, it may serve the objective of greening the balance sheet. However, greater greening of the central bank balance sheet will require development of a functional secondary market, so that green bonds, like other government securities, can be bought or sold in the secondary market. 8. Concluding Observations III.60 Central banks and the financial sector regulators have increasingly recognised the rising risks to financial stability from climate change and have been exploring ways to support the net zero transition goals while preserving financial stability. Financial markets have already become aware and are driving capital reallocation to facilitate adaptation, risk pricing and mitigation. The non-linear and multidimensional assignment problem involving all key stakeholders has no easy solution. The success of any financial sector risk mitigation strategy will also depend on dynamic recalibration of policies, growth in the pro-green investors and their appetite for green financial investment. III.61 An assessment based on energy intensity of borrowing sectors to gauge transition risks of Indian banks suggests that risks may emanate from banks’ exposures to basic metals, and generation and distribution of energy. Hearteningly, in the recent years, bank credit to green industries has accelerated at a pace faster than that to other industries. This may be a sign of rising climate risk awareness driving credit allocation pattern in the economy. III.62 Estimates suggest that annual green financing requirement could be about 2.5 per cent of GDP to address the infrastructure gap caused by climate events, which could increase if faster carbon emission reducing goal has to be pursued than what is committed under the NDC. III.63 A stylised partial equilibrium model based on the interrelationship between banks and NBFCs suggests that any large-scale default by NBFCs arising on account of physical or transition risk may spill over and adversely affect the overall macro-financial stability. III.64 To ascertain the transmission channels of climate shocks to the financial sector, a DSGE model calibrated for Indian parameters is employed. The simulation results highlight that climate events could lead to destruction of capital stock, impacting consumption and output. The adverse impact on inflation could also harden interest rates, amplifying the initial impact on capital stock. Loss of collateral value and higher pressure on market and funding liquidity in the banking sector can potentially become a source of financial vulnerability. III.65 A climate stress test conducted for India suggests that PSBs are more prone to climate risks than their private sector counterparts and may face capital shortfalls in case of extreme adverse climate shocks, particularly in the rarest event of banks being necessitated to repay their borrowings and deposit liabilities simultaneously. III.66 The proper functioning of a regulatory framework requires a robust statistical infrastructure to evaluate climate risks. India currently uses platforms such as PAT (perform, achieve, trade) and RPO (renewable purchase obligations) for tracking GHG emissions. The implementation of national MRV (measurement, reporting, and verification) to track both domestic and international climate finance is under consideration. In this vein, there is a need for a unified statistical framework, including a consistent and comparable taxonomy, regular disclosures, and monitoring. Though an expert committee has been set up, India is yet to publish its taxonomy, which would require a significant amount of work relating to standardisation and interoperability. An internationally harmonised taxonomy will be essential for the development of the green bond market and other mitigation tools. References Acharya, V., H. Almeida, F. Ippolito, and A. Perez (2014). Credit lines as monitored liquidity insurance: Theory and evidence. Journal of financial economics, 112(3), 287-319. Acharya, V., H. Almeida, F. Ippolito, and A. Perez-Orive (2020). Bank lines of credit as contingent liquidity: Covenant violations and their implications. Journal of Financial Intermediation, 44. Acharya, V., H. Almeida, F. Ippolito, and A. Perez-Orive (2021). Credit Lines and the Liquidity Insurance Channel. Journal of Money, Credit and Banking, 901-938. ACPR (2020). Scenarios and main assumptions of the ACPR pilot climate exercise. Technical Report, Autorité de contrôle prudentiel et de résolution. ACPR (2021). A first assessment of financial risks stemming from climate change: The main results of the 2020 climate pilot exercise. Technical Report, Autorité de contrôle prudentiel et de résolution. Aglietta, M., and E. Espagne (2016). Climate and finance systemic risks, more than an analogy? The climate fragility hypothesis. CEPII, Centre d’etudes prospectives et d’informations internationales. Alogoskoufis, S., N. Dunz, T. Emambakhsh, T. Hennig, M. Kaijser, C. Kouratzoglou, and C. Salleo (2021). ECB economy-wide climate stress test: Methodology and results (No. 281). ECB Occasional Paper. Alvarez, N., A. Cocco, and K. B. Patel (2020). A New Framework for Assessing Climate Change Risk in Financial Markets. Chicago Fed Letter. Annicchiarico, B., and F. Di Dio (2017). GHG emissions control and monetary policy. Environmental and Resource Economics, 67(4), 823-851. Banco Central do Brasil (2011). Circular 3, 547 of July 7, 2011: Establishes Procedures and Parameters Related to the Internal Capital Adequacy Assessment Process (ICAAP). Bank of England (2019a). Enhancing banks’ and insurers’ approaches to managing the financial risks from climate change, Supervisory Statement SS3/19, April. Bank of England (2019b). Insurance Stress Test 2019, June 18. Bank of England (2019c). New economy, new finance, new Bank: The Bank of England’s response to the van Steenis review on the Future of Finance, Bank of England Report, June. Bank of England (2019d). Bank of England to disclose assessment of how it manages climate-related financial risk in the 2019/20 annual report, Bank of England News Release, April. Bank of England (2022a, June 23). The Bank of England’s climate-related financial disclosure 2022. Retrieved from Bank of England: https://www.bankofengland.co.uk/prudential-regulation/publication/2022/june/the-bank-of-englands-climate-related-financial-disclosure-2022. Bank of England (2022b). Results of the 2021 climate biennial exploratory scenario (cbes). Technical Report, Bank of England. Banque du Liban (2010). Intermediate Circular 236. Baranović, I., I. Busies, W. Coussens, M. Grill, and H. S. Hempell (2021). The challenge of capturing climate risks in the banking regulatory framework: is there a need for a macroprudential response?. Macroprudential Bulletin, 15. Basel Committee on Banking Supervision (2021). Climate-related risk drivers and their transmission channels, BIS. Basel Committee on Banking Supervision (2021). Climate-related financial risks-measurement methodologies, BIS. Battiston, S., A. Mandel, I. Monasterolo, F. Schütze, and G. Visentin (2017). A climate stress-test of the financial system. Nature Climate Change, 7(4):283–288. Battiston, S., P. Jakubik, I. Monasterolo, K. Riahi, and B. Van Ruijven (2019). Climate risk assessment of the sovereign bond portfolio of European insurers. Financial Stability Report, 69–89. Boffo, R., and R. Patalano (2020). ESG Investing: Practices, Progress and Challenges, OECD Paris. Bressan, G., A. Duranovic, I. Monasterolo, and S. Battiston (2022). Asset-level climate physical risk assessment and cascading financial losses. Available at SSRN. Caloia, F., and D.J. Jansen (2021). Flood risk and financial stability: Evidence from a stress test for the Netherlands., SSRN working paper. Campiglio, E., Y. Dafermos, P. Monnin, J. Ryan-Collins, G. Schotten, and M. Tanaka (2018). Climate change challenges for central banks and financial regulators, Nature Climate Change 8(6):462–468. Carattini, S., G. Heutel and G. Melkadze (2021). Climate policy, financial frictions, and transition risk (No. w28525). National Bureau of Economic Research. Carney, M. (2015). Breaking the tragedy of the horizon – climate change and financial stability. Bank of England, London. September. Cartellier, F. (2022). Climate Stress Testing, an Answer to the Challenge of Assessing Climate-Related Risks to the Financial System?. Available at SSRN 4179311. Cerutti, E., S. Claessens, and L. Laeven (2017). The use and effectiveness of macroprudential policies: New evidence, Journal of Financial Stability 28:203–224. Chakraborty, G., and N. Rao (2022). Attaining Sustainable Development Outcomes Through Blended Financing of Social Enterprises. IBIS - International Conference on Business and Integral Security. Chandra, R. K., N. Jayakumar, K. M. Neelima, A. Harsh, and P. Brijesh (2022). A Steady Ship in Choppy Waters: An Analysis of the NBFC Sector in Recent Times. RBI Bulletin, pp. 87-102, August. Chandrasekhar, C. P. (2020). Revisiting the NBFC Crisis. Economic and Political Weekly, 55(2), 10-11. Chong, Y. J., A. Khan, P. Scheelbeek, A. Butler, D. Bowers, and P. Vineis (2014), Climate change and salinity in drinking water as a global problem: using remote-sensing methods to monitor surface water salinity. International Journal of Remote Sensing, 1585-1599. Climate Safe Lending Network (2022). CSLN Response to BCBS Consultation. Coelho, R., and F. Restoy (2022). The regulatory response to climate risks: some Challenges. FSI Briefs. Convergence (2020). The State of Blended Finance. Corrigan, P., H. Desgagnés, J. Dorich, V. Lepetyuk, W. Miyamoto, and Y. Zhang (2021). ToTEM III: The Bank of Canada’s Main DSGE Model for Projection and Policy Analysis, Bank of Canada Technical Report No. 119. Dafermos, Y., M. Nikolaidi, and G. Galanis (2018). Climate Change, Financial Stability and Monetary Policy. Ecological Economics, 219-234. De Resende, C., and R. Lalonde (2011). The BoC-GEM-Fin: Banking in the Global Economy, Bank of Canada Review: 11–21. Dey, K., and P. K. Mishra (2022). Mainstreaming blended finance in climate-smart agriculture: Complementarity, modality, and proximity. Journal of Rural Studies. Diluiso, F., B. Annicchiarico, M. Kalkuhl, and J. C. Minx (2020). Climate actions and stranded assets: The role of financial regulation and monetary policy. Working Paper 8486, CESifo Group Munich. EBF Staff (2022). Pillar 1 capital charge for climate risk: Wrong tool for the right purpose. European Banking Federation. ECB (2022). Climate risk stress test - ssm stress test 2022. Technical report, European Central Bank. Ehlers, T., D. Gao, and F. Packer (2021). A taxonomy of sustainable finance taxonomies. BIS Papers, (118). ESRB (2021). Climate-related risk and financial stability. EU High-Level Expert Group on Sustainable Finance (2018). Financing a Sustainable European Economy, European Commission. Feyen, E., R. Utz, H. Bogdan O. Zuccardi, and J. Moon (2020). Macro-financial aspects of climate change. The World Bank. Financial Stability Board (2022). The Implications of Climate Change for Financial Stability. Financing green transition (2019). Observer Research Foundation. Galati, G., and R. Moessner (2017). What do we know about the effects of macroprudential policy? Economica 85(340):735–770. Gandhi, R. (2016). Green Finance: Early initiatives, Speech at the launch of the Final UNEP India Inquiry Report titled “Delivering a Sustainable Financial System in India” on April 29. Ghosh, S., and D. Mazumder (2023). Do NBFCs propagate real shocks?. Journal of Asian Economics, 85, 101590. Ghosh, S., S. Kundu, and A. Dilip (2021). Green swans and ensuing economic vagaries: Evidence from Indian coastal states. Reserve Bank of India Occasional Papers, 124(3):515–526. Ghosh, S., and S. Nath (2023). ESG Disclosures and Performances: Cross-Country Evidence. Reserve Bank of India Bulletin. February. Ghosh, S., S. Nath, A. Narayanan, and S. Das (2022). Green Transition Risks to Indian Banks, Reserve Bank of India Bulletin, March. Ghosh, S., S. Nath, and A. Ranjan (2021). Green Finance in India: Progress and Challenges, Reserve Bank of India Bulletin, January. Gillan, S. L., A. Koch, and L. T. Starks (2021). Firms and social responsibility: A review of ESG and CSR research in corporate finance, Journal of Corporate Finance, Elsevier, vol. 66(C), 101889. Girzegorz, P. et al. (2020). Diversification and Cooperation in a Decarbonizing World. Gourdel, R., I. Monasterolo, N. Dunz, A. Mazzocchetti, and L. Parisi (2022). The double materiality of climate physical and transition risks in the Euro area. SSRN working paper. Grippa, P., and S. Mann (2020). Climate-related stress testing: Transition risks in Norway. Working Paper WP/20/232, International Monetary Fund. Heutel, G. (2012). How should environmental policy respond to business cycles? Optimal policy under persistent productivity shocks. Review of Economic Dynamics, 15(2), 244-264. Hughes, G., P. Chinowsky, and K. Strzepek (2010). The costs of adapting to climate change for infrastructure. Economics of Adaptation to Climate Change Discussion Paper, (2). IEA (2022). India’s clean energy transition is rapidly underway, benefiting the entire world, IEA, Paris. IMF (2018). Euro Area Policies: Financial System Stability Assessment: Detailed Assessment of Observance—Basel Core Principles for Effective Banking Supervision, International Monetary Fund, June. Insurance Regulatory Development Authority of India (IRDA), Annual Report, Various issues. International Platform on Sustainable Finance (IPSF) (2022). Common around Taxonomy-Climate Change Mitigation. IRFC (2021-22). Resourceful, Committed, Sustainable 35th Annual Report. Jain, S. (2020). Financing India’s green transition, ORF Issue Brief No. 338, January 2020, Observer Research Foundation. Jung, H., R. F. Engle, and R. Berner (2021). Climate stress testing. FRB of New York Staff Report, (977). Khanna, N., D. Purkayastha, S. Jain (2022). Landscape of Green Finance in India 2022. Climate Policy Initiative. Krogstrup, S., and W. Oman (2019). Macroeconomic and Financial Policies for Climate Change Mitigation: A Review of the Literature, IMF Working Paper WP/19/185. Lalonde, R., and D. Muir (2007). The Bank of Canada’s Version of the Global Economy Model (BoC-GEM), Bank of Canada Technical Report No. 98. Levinson, M. (2005). The Economist Guide to Financial Markets (4th ed.). Profile Books Ltd. Majumdar, S., S. S. Herwadkar, J. Ansari, A. Sinha, R. Verma, J. Jose, S. Dhingra (2021, October). Should Financial Stability be a Monetary Policy Goal? Evidence from India. RBI Bulletin. McChristian, L. (2012). Hurricane Andrew and insurance: The enduring impact of an historic storm. Insurance Information Institute, 16. McCollum, D. L., W. Zhou, C. Bertram, H. S. De Boer, V. Bosetti, S. Busch, and K. Riahi (2018). Energy investment needs for fulfilling the Paris Agreement and achieving the Sustainable Development Goals. Nature Energy, 3(7), 589-599. Milliken, D. (2022). Bank of England projects more than 30 bln pounds of annual QE losses. Retrieved from Reuters: https://www.reuters.com/business/finance/bank-england-projects-more-than-30-bln-pounds-annual-qe-losses-2022-11-22. Nastis, S. A., A. Michailidis, and F. Chatzitheodoridis (2012). Climate change and agricultural productivity. African Journal of Agricultural Research, 4885-4893. NGFS (2019). First comprehensive report- A call for action: Climate change as a source of financial risk, April. NGFS (2021). NGFS Climate Scenarios for central banks and supervisors, June. Oil Change International (2021). Unused Tools: How Central Banks Are Fueling the Climate Crisis. Washington D.C.: Oil Change International. Oloko, T. F., I. A. Adediran, and O. T. Fadiya (2022). Climate Change and Asian Stock Markets: A GARCH-MIDAS Approach. Asian Economics Letters. Peszko, G., D. Van der Mensbrugghe, A. Golub, J. Ward, C. Marijs, A. Schopp,……, and A. Midgley (2020). Diversification and Cooperation in a Decarbonizing World; Diversification and Cooperation in a Decarbonizing World: Climate Strategies for Fossil Fuel-Dependent Countries: Climate Strategies for Fossil Fuel-Dependent Countries. Climate Change and Development. © Washington, DC: World Bank. PFC (2021). Diversifying Growth Consolidating Strengths, 36th Annual Report. Quatrosi, M. (2022). Financial Innovations for Sustainable Finance: an exploratory research. SSRN. Rauf, A. (2023). Bank stability and the price of loan commitments. Journal of Financial Intermediation,54. RBI (2020-21). Report on Trend and Progress of Banking in India. The Reserve Bank of India. RBI (2022). Financial Stability Report. The Reserve Bank of India. Roncoroni, A., S. Battiston, L. O. Escobar-Farfán, and S. Martinez-Jaramillo (2021). Climate risk and financial stability in the network of banks and investment funds. Journal of Financial Stability, 54:100870. Schu¨wer, U., C. Lambert, and F. Noth (2019). How Do Banks React to Catastrophic Events? Evidence from Hurricane Katrina. Review of Finance, 75-116. SEBI (2021), Business Responsibility and Sustainability Reporting by listed entities, PR no. 18/2021, March. Singh, V., G. Sidhu (2021). Investment Sizing India’s 2070 Net-Zero Target. Council on Energy, Environment, and Water-Centre for Energy Finance Tonkonogy, B., J. Brown, V. Micale, X. Wang, and A. Clark (2018). Blended Finance in Clean Energy: Experiences and Opportunities. Retrieved from Climate Policy Initiative. Volz, U. (2018, March). Fostering green finance for sustainable development in Asia, ADBI Working Paper Series (814). Weber, P.F., B. Erkan, A. Oustry, and R. Svartzman (2021). Climate risks and collateral: a methodological experiment. SUERF. Xepapadeas, A., and G. Economides (2018). Monetary policy under climate change. Bank of Greece Working Paper no. 247. Yarlagadda, K. (2022, November 19). Carbon credits and India’s carbon market. Deccan Herald.
Annex III.1: Methodology and Underlying Assumptions for Measurement of Green Finance Requirements Hughes et al. (2010) estimate the following model to estimate infrastructure funding gap due to climate shock: Using annual cross-country data for more than 100 countries, the above relationship is estimated for 10 infrastructure related indicators, viz., electricity generating capacity, number of fixed telephone lines, road length, aircraft movement, container movement, municipal water use per person, industrial water use per person, number of hospital beds, number of teachers in schools and number of post offices. The subscripts i and t represent country and year, respectively. The explanatory variables related to temperature and precipitation measure the extent of climate change, per capita GDP indicates the impact of climate change on aggregate demand and urbanisation measures the demand for infrastructure. φ includes controls which are unrelated to climate change, such as country size and landscape pattern. While the estimated regression coefficients for the explanatory variables in the above model represent the average global relationship, the models are calibrated for India using the following climate change scenarios applicable to India (Table 1). | Table 1: Assumptions on Indian Scenario of Climate Change | | Variable | Impact of Climate Change (Per cent) | | Per Capita GDP loss due to climate change# | -2.0 | | Temperature (Mean)-Population weighted | 2.0 | | Temperature (Mean)-Inverse Population weighted | 0.4 | | Precipitation (Mean) | -2.0 | | Precipitation (Range) | 5.0 | | Urbanisation* | 1.5 | Note: Estimates for temperature and precipitation indicate deviation of the observed values between 2011-12 and 2019-20 from the long-term averages between 1950 and 2020.
Sources: #: Authors’ assumptions. *: World Bank. Indicates annual growth rate in urban population to total population ratio. Other indicators are based on data from India Meteorological Department (IMD). |
|