Climate change is manifesting itself at an alarming scale and pace globally. Emerging and developing economies are the most vulnerable in terms of technological capabilities and access to finance for adaptation and mitigation. There has been a significant increase in climate action, both multilaterally and in individual countries. Alongside fiscal policies, recent years have seen a growing experimentation with regulatory instruments and hence, the role of central banks in combating climate change is coming to the fore. The Reserve Bank of India is actively involved in fortifying India’s climate defence through various policy and research initiatives. 1. Introduction I.1 Climate change is upon us. According to the World Meteorological Organisation (WMO), the period 2015-22 is the warmest on record. Despite the cooling effects of La Nina into its third year, 2022 was the eighth consecutive year in which annual global temperature reached at least 1 degree Celsius above pre-Industrial Revolution levels, fuelled by ever-rising greenhouse gas (GHG) concentrations and accumulated heat. I.2 In the European Alps, glacier melt records were broken in 2022. Switzerland lost about 6 per cent of its glacier ice volume between 2021 and 2022. For the first time in history, there was no accumulation of fresh ice even at the very highest measurement sites (WMO, 2023). Sea levels increased by about 5 millimetres during January 2021 – August 2022 due to increasing ice melt. In 2021, the upper 2000 metres of the ocean continued to warm to record levels. Furthermore, 58 per cent of the ocean surface experienced at least one marine heat wave during 2022 (ibid). There was a drop in the Antarctic sea ice extent to 1.92 million km2, which was the lowest level on record and was almost 1 million km2 below the long-term average. In East Africa, rainfall was below-average in four wet seasons consecutively, the longest in 40 years (WMO, 2023). The persistent drought resulted in the worst levels of food crisis for an estimated 18.4-19.3 million people (WMO, 2022). I.3 Pakistan witnessed record breaking rains in July and August 2022 leading to extensive flooding, taking at least 1,700 lives and affecting 33 million people. The flooding occurred on the heels of an extreme heat wave in March and April in both Pakistan and India. China experienced the most extensive and long-lasting heatwave since national records began. Large parts of Europe sweltered in repeated episodes of extreme heat. More than 15,000 excess deaths associated with extreme heat were reported across Europe (WMO, 2023). European rivers, including the Rhine, Loire and Danube, fell to critically low levels. In the United Kingdom (UK), temperatures rose above 40 degrees Celsius in July 2022 for the first time. Southern Africa was battered by a series of cyclones over two months at the start of 2022. Hurricanes swept across Cuba and Florida, causing extensive damage and loss of life in 2022. During 1970-2019, weather, climate and water hazards claimed 45 per cent of total reported deaths and 74 per cent of total reported economic losses (WMO, 2021). These hazards have undermined livelihoods and infrastructure as well as health, food, energy and water security. Human well-being is endangered and so is the future of the planet. I.4 India has faced its hottest February in 2023 since record-keeping began in 1901 (IMD, 2023). In March, large parts of the country experienced hailstorms and torrents of unseasonal rain, leading to apprehensions of extensive damage to standing crops. According to India’s Centre for Science and Environment (CSE), the country experienced extreme weather events on 314 of 365 days of 2022, which claimed 3,026 lives, affected 1.96 million hectares of crop area and 4,23,249 houses, and killed over 69,899 animals1. Central India witnessed the highest intensity of extreme weather events. Among the states, Madhya Pradesh had the highest number of days with extreme weather, but Himachal Pradesh from the north-west region reported the highest number of deaths. In the eastern and north-eastern regions, Assam suffered from the highest number of damaged houses and animal deaths. In the southern peninsula region, Karnataka experienced extreme weather events on 91 days during the year and accounted for 53 per cent of the total crop area affected across the country. I.5 In 2022, India recorded its seventh wettest January since 19012. March was the third driest and warmest ever in 121 years. Eastern and north-eastern India saw their warmest and driest July in 121 years. These regions also recorded their second warmest August and the fourth warmest September in 2022. India seems to be at the watermark of climate change – rather than single events, it is the increased frequency of extreme weather occurrences that is breaking the back of our capability to cope with natural disasters. There is a definite rising trend; but more than the events themselves, India is grappling with severe losses and damages – the human toll of the impact of climate change. I.6 Awareness of the impact of greenhouse gases on earth’s temperature is not new. Joseph Fourier, a French physicist, had identified the “greenhouse effect” in 1824, which was quantified in 1896 by Svante Arrhenius, a Swedish scientist (Steiner and Fortuna, 2020). Since the 18th century, the impact of climate and environment on the course of human development has drawn attention (Livingstone, 2011)3. While natural factors can contribute to climate change, it is now widely recognised that the current scale and pace of climate change is primarily attributable to the anthropogenic factors (NRC, 2001). In fact, the period from the mid-20th century has been defined as the “Anthropocene” epoch, marking a significant impact of human activity on earth’s climate due to an increased use of oil, coal and other fossil fuels to support economic growth (Subramanian, 2019). I.7 It is only from the late 20th century that there has been an increased interest in the “economics of climate change”, relating to (a) assessing the economic impact of climate change on growth and development; and (b) economic assessment of climate change policies. Seminal work attempting to understand the economics of climate change has been undertaken through the Integrated Assessment Models (IAMs) such as the Dynamic Integrated model of Climate and the Economy (DICE) (Nordhaus, 1992; Stern, 2007). I.8 Affirmative action in pursuit of the climate as a global policy good is of even more recent vintage. The Paris Agreement of 2016 has been a landmark in achieving the first legally binding international treaty on climate change for all signatories, a successor to the Kyoto Protocol of 2005. This Agreement has introduced long-term goals regarding the reduction of GHG emissions, and provision of finance to developing countries by developed countries to adapt to and mitigate climate change. Despite the slow pace of implementation, unfulfilled commitments towards collectively financing climate action and vulnerability/discord/knowledge gaps, the Agreement has offered a glimmer of hope about the transition towards a greener cleaner world. I.9 India’s development strategy since independence has left certain environmental imprints4. This recognition is belatedly spurring investments in environment-friendly alternative sources of energy and in climate science and technology. Today, India is striving to consolidate its position in the ongoing global climate policy discourse with an urgency not seen before as the world races to head off the debilitating effects of climate change. I.10 Against this backdrop, the Report on Currency and Finance for the year 2022-23 adopts “Towards a Greener Cleaner India” as its theme. The following section underscores the need for speed and resolute commitment by analysing the manifestations of climate change through key physical indicators at the global level. The third section reviews the state of play that is leading up to global climate policies. India’s position in global negotiations is set out in the fourth section. Central banks, including the Reserve Bank of India (RBI), have emerged as stakeholders in the global climate change discussions and this forms the subject matter of the fifth section, which is followed by the lay-out of the rest of the Report to conclude this chapter. 2. Global Manifestation of Climate Change I.11 The global mean surface temperature today is about 14.8 degrees Celsius (Chart I.1)5. Although temperature increases have been recorded during the course of earth’s history, the current episode of anthropogenic climate change is qualitatively different from the historical experience in four major ways. First, changes in the earth’s climate that are underway are largely human-induced, as noted earlier, while the earlier incidences were primarily the result of various natural factors (Chart I.2).
I.12 Second, the pace of climate change during the current phase is remarkably rapid – it is unfolding over decades whereas earlier occurrences of climate change happened over centuries and millennia (Krishnan et al., 2020). Third, costs involved in the policy responses for adaptation to and mitigation of climate change-related challenges are unprecedented. Fourth, the current experience with climate change is truly global in nature with accentuated regional implications. I.13 Climate scientists recognise three anthropogenic drivers of climate change: GHG emissions; aerosols; and land use and land cover (LULC) (ibid). While GHGs help to keep the earth warm and habitable, it is the imbalance in GHGs in earth’s atmosphere that leads to global and regional warming. The amount of GHGs in the atmosphere prior to the Industrial Revolution was relatively constant, but their concentration has increased significantly and consistently since then (IPCC, 1990). Among the GHGs, the concentrationof carbon dioxide (CO2) has shown the highest increase since pre-industrial times (Chart I.3a). Atmospheric CO2 gets stored transiently in land or oceans as mineral deposits before it gets removed over centuries or even more, making the mitigation of climate change a daunting task (ibid)6. I.14 Methane (CH4), the second highest GHG in occurrence, has been growing primarily due to agricultural activities7. The concentration of nitrogen oxides and carbon monoxide (CO) is also on the rise, leading to an increase in tropospheric ozone (O3), another GHG (ibid). Chlorofluorocarbons (CFCs), which damage the O3 layer in the stratosphere that is responsible for filtering the sun’s ultraviolet radiation also contribute to global warming8. Among various economic sectors, energy has contributed the most to GHG emissions, followed by agriculture and industry (Chart I.3b). 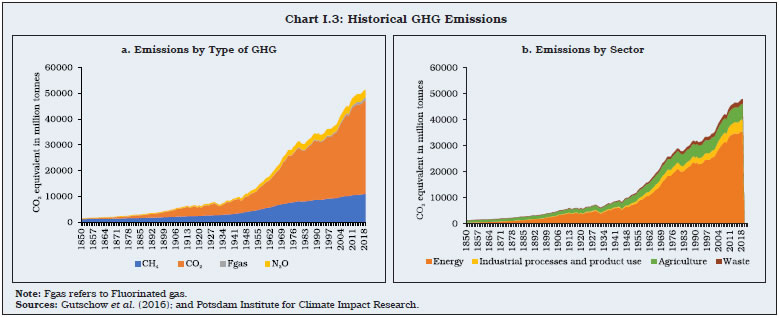 I.15 Aerosols are small, suspended particles or droplets that either scatter solar energy or absorb it or do both. By scattering solar energy, they can offset the warming caused by GHGs but by absorbing it, they contribute to global warming (ibid)9. The common sources of anthropogenic aerosols are urban/industrial emissions and smoke emanating from biomass burning (ibid). The changes in LULC caused by deforestation owing primarily to agricultural and pastoral activities reduce the ability of the earth’s surface to sequestrate (absorb) CO2, thus contributing to climate change (ibid). I.16 Climate scientists use many physical indicators, including atmospheric, oceanic and cryospheric, to assess climate change: -
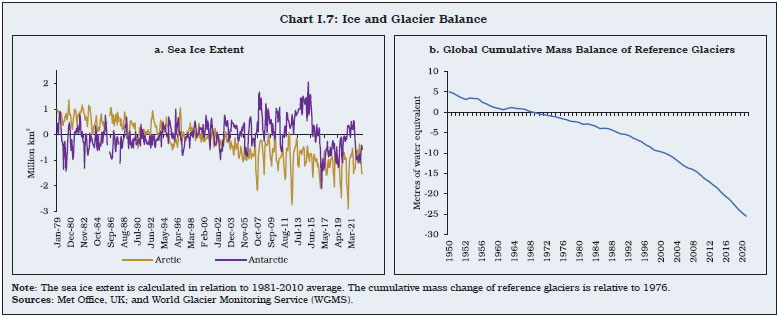
Global mean surface temperature (the average of land surface temperature (LST) and sea surface temperature (SST)): from 2012 onwards, the earth has turned warmer by more than 1 degree Celsius as compared with the 1850-1900 average, with each decade being warmer than the previous one by around 0.2 degree Celsius since the 1980s (Chart I.4). 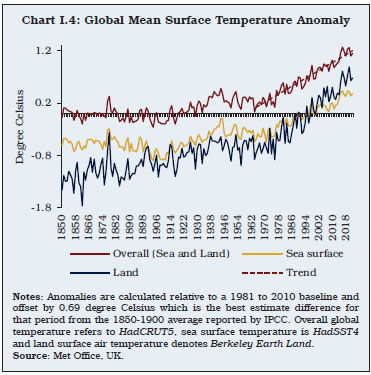
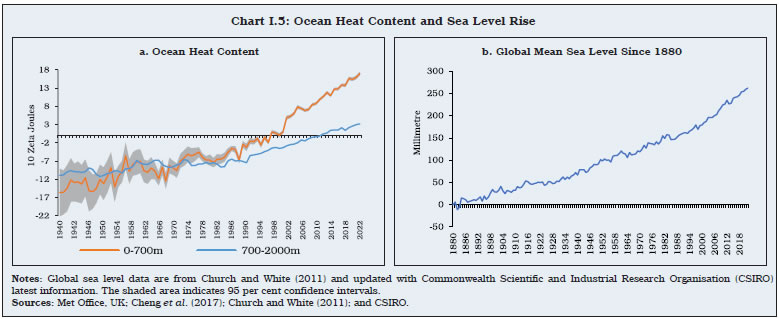 -
Long-term warming and acidification of oceans: more than 90 per cent of the net energy or heat increase in the climate system is stored in oceans and over 60 per cent in the upper ocean (0-700 metres). The heat absorbed in the upper layer of the ocean has increased at an annual average level of 1.9 zeta joules (ZJ)10 during 1940-1970 to 5.2 ZJ during 1971-2022 (Chart I.5)11, causing thermal expansion, melting of glaciers and ice caps, rise in sea level and ocean acidification (Chart I.6)12. -
Changing mass of cryosphere (all regions on and beneath the surface of the earth where water is in solid form): this has resulted in high reflectivity of solar radiation and depletion of fresh water supply, including snow and ice (Sejas et al., 2014) (Chart I.7)13. 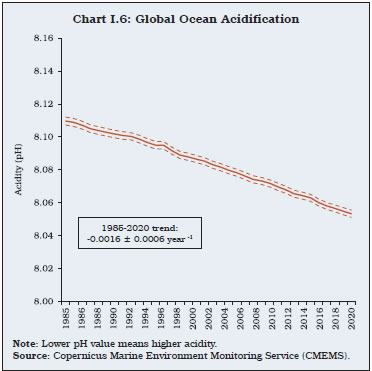
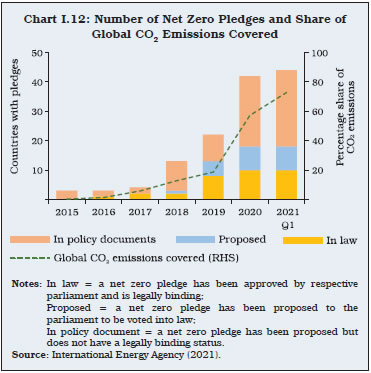
I.17 Using select key physical indicators14 of climate change, a dynamic factor model (DFM) capable of extracting unobserved underlying factors has been developed to create a composite measure of global climate change, namely, the Global Climate Change Index (GCCI). Constructed by taking data from 1850 to 2022, the GCCI shows an upward trend since the late 19th century following the Industrial Revolution (Chart I.9). I.18 The correlation between the GCCI and the total number of extreme weather events is estimated at 0.9. Evidently, the frequency of disaster events has gone up with climate change (Chart I.10). I.19 The Bai-Perron structural break test shows five major statistically significant breaks (1880; 1913; 1938; 1973; and 1998) in the GCCI (Table I.1). As the year 1880 marked the beginning of modern record-keeping for global temperatures, the availability of robust data on global temperatures could explain the first structural break in the GCCI15. The period from 1880 to 1912 is considered as the period of the Second Industrial Revolution involving several technological advances majorly benefitting the advanced countries outside Europe. The period from 1913 to 1937 included the outbreaks of the two World Wars, possibly reflecting increased emissions. The last break in 1998 was marked by a well-known El Nino effect in the tropical Pacific, which resulted in significant climate disruptions in the form of floods in Latin America and Africa, and droughts in south-east Asia. | Table I.1: Bai-Perron Structural Breaks in GCCI | | Variable | Coefficient | Std. Error | t-Statistic | Prob. | | 1850 - 1879 -- 30 obs | | | | | | C | -3.57 | 0.07 | -52.62 | 0.00 | | 1880 - 1912 -- 33 obs | | | | | | C | -4.27 | 0.06 | -66.09 | 0.00 | | 1913 - 1937 -- 25 obs | | | | | | C | -3.41 | 0.07 | -46.00 | 0.00 | | 1938 - 1972 -- 35 obs | | | | | | C | -2.24 | 0.06 | -35.75 | 0.00 | | 1973 - 1997 -- 25 obs | | | | | | C | -1.10 | 0.07 | -14.86 | 0.00 | | 1998 - 2022 -- 25 obs | | | | | | C | 0.80 | 0.07 | 10.75 | 0.00 | | Adj. R2 | 0.95 | | | | | Prob(F-stat) | 0.00 | | | | | Source: Authors’ calculations. | I.20 In sum, climate change is manifesting itself through multiple indicators. Given that most environmental and natural processes are “silent” and “invisible”, they may not be discernible immediately or experienced as intensely (Dasgupta, 2021). Silence and invisibility can no longer be associated with climate change, however, as increasingly frequent and intense extreme weather events take a rising toll on human life and the environment. 3. Climate Policy Action I.21 The global consensus around climate policies has been spearheaded by the United Nations (UN), although originally, its focus was more on the utilisation of the environmental or natural resources for greater economic development (Jackson, 2007). Among the international organisations, it was the WMO which has been instrumental in generating international cooperation on climate matters and strengthening post-second World War advances in climate research (Zillman, 2009). I.22 Environmental conservation engaged the attention of the UN for the first time in the first Earth Summit held in Stockholm in 1972, which led to the creation of the UN Environment Programme (UNEP), the first landmark in global cooperation and consensus on climate change. The second landmark occurred 16 years later in the form of creation of the Inter-Governmental Panel on Climate Change (IPCC) in 1988 by the UNEP and the WMO for regular scientific assessments on climate change and their implications for informed policy making (Annex I.1). Till now, there have been six assessment cycles by the IPCC. I.23 The third landmark was the Paris Agreement in 2016, about three decades later. This agreement bound all signatories to undertake targeted efforts to combat climate change. It was aimed at ensuring that GHG emissions from human activity are maintained at the same levels as can be absorbed by the environment - known as net zero - between 2050 and 2100. This would limit global warming to 1.5 degrees Celsius as compared with pre-Industrial Revolution levels. I.24 The implementation of the Paris Agreement is based on Nationally Determined Contributions (NDCs), which are plans of action for climate change submitted by each signatory, followed by a five-year cycle of increasingly ambitious climate actions16. Countries also have to frame long-term low emission development strategies (LT-LEDS). Unlike NDCs, LT-LEDS are not mandatory. Developed countries have been assigned the added responsibility of providing support to developing countries for adaptation and transition to clean energy through climate finance. There have been numerous global dialogues and interventions leading up to and following the Paris Agreement (Annex I.1). I.25 The achievements of climate policy action can be ascertained using several parameters. First, almost all countries have committed to timelines for the transition to net zero emissions, with the majority committing to achieve this target by 2050 (Chart I.11). 23 per cent of the countries have made the target a legal obligation, 18 per cent have proposed to make it into a legal obligation and remaining 59 per cent have made their pledges in official policy documents. All these countries together account for around 73 per cent of global CO2 emissions (Chart I.12). 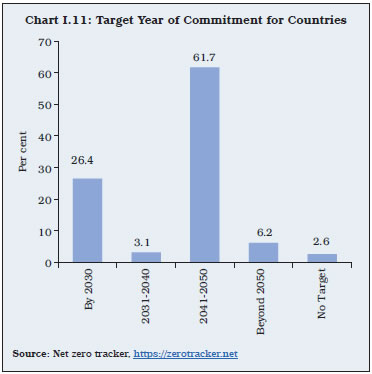
 I.26 Second, the financial commitments made towards providing climate finance for adaptation and mitigation have also grown over time. In COP1517 in Copenhagen in 2009, developed countries committed to US$ 100 billion per year by 2020 for climate action in developing countries. In COP27 in Sharm-El-Sheikh in 2022, the Parties acknowledged that the initial pledge was not sufficient and adapting to climate crisis would require US$ 160-340 billion annually by 2030, accelerating to US$ 565 billion annually by 2050 if climate conditions deteriorated further. Parties have also reached a consensus to establish funding arrangements, including a dedicated fund for loss and damage. The G20 and G7 have jointly launched the Global Shield against Climate Risks to provide vulnerable countries more means to protect themselves from increasingly extreme weather, with Germany providing €170 million in grants. Many of the advanced economies have made financial commitments addressing loss and damage, with the UK also announcing that it will suspend vulnerable nations’ debt repayments for up to two years following a climate disaster. The UN has unveiled a US$ 3.1 billion plan to ensure that everyone is covered by early warning systems in the next five years to bolster countries’ ability to prepare for hazardous weather. I.27 Third, weather-related mortality has declined over the decades as advances in technology and early warning systems across countries have reduced the incidence of death significantly (Chart I.13). I.28 Fourth, NDCs have increased the momentum of emission reduction, resulting in a glide path towards net zero. While relative decoupling of economic growth and emissions is currently underway at the global level, the trends vary significantly across high-income and middle-income countries (Chart I.14; Box I.1). I.29 Notwithstanding the progress, the pace of implementation of climate policy remains far from adequate. There are still considerable gaps in scientific knowledge on informed climate-resilient pathways, strategies, choices and actions that can reduce climate change and its impact (Denton et al., 2014). Delays in current policy action can limit the scope for setting future climate-compatible trajectories. There are also potential trade-offs between adaptation and mitigation policies, resulting in implementation challenges. Cross-country differentials in historical emissions and development priorities make the issue of “equity” central to adaptation and mitigation policies. While climate change is a global phenomenon, it is the emerging and less-developed economies that are most vulnerable in terms of (i) climate science and technological capabilities; and (ii) finance for adaptation and mitigation. Climate change can push them several places down the development ladder as the potential costs of transitioning to a greener path for them could be higher relative to their advanced economy peers. Their contribution to GHG emissions has been relatively limited and they demand a larger slice of the future carbon space as well as compensation for climate change (Box I.2). 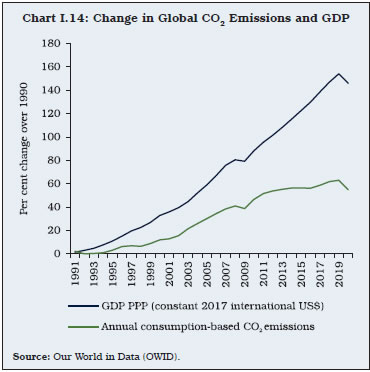
Box I.1
Decoupling of Global Growth and GHG Emissions The carbon-growth nexus is based on the argument that as economies grow, energy usage requirement increases, leading to higher emissions (Torun et al., 2022). The environmental Kuznets curve (EKC) hypothesis argues that this relation is non-linear, with emissions increasing faster at lower stages of economic development and falling at higher stages with the use of energy-efficient resources, ceteris paribus (Stern, 2004). Under relative decoupling, the carbon intensity of GDP declines even though it may still be on a rise in absolute terms. With the various policy interventions for addressing climate change in the last few decades, the decoupling elasticity, defined as the response of emissions to a one per cent change in GDP, has weakened. The changes in the decoupling elasticity can be seen from the response curve of the time varying estimate (βt) in equation (1), controlling for energy intensity of GDP during 1965-2021: CO2: Per capita emissions; GDPPC: Per capita GDP; and EI: Energy intensity of GDP. The results show a non-linear relationship between per capita GDP and emissions over time. After 2000, however, the decoupling elasticity has increased, though moderately (Chart 1). Decomposition of the contributing factors, based on the Logarithmic Mean Divisia Index (LMDI)18 (an extension of the Kaya identity19), brings out the role of declining energy intensity of output which has helped in containing global emissions growth, despite higher per capita economic growth. This is weakening the carbon-growth nexus (Chart 2). The pace of emissions, however, has increased since 2000 and has remained elevated, as the moderation in energy intensity of output has been outweighed by carbon intensity of energy use associated with economic growth, which has shown only a moderate decline. 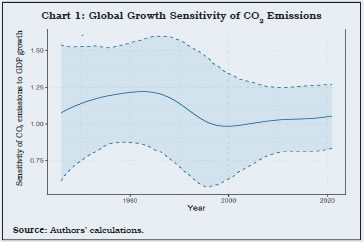 The carbon-growth nexus path has been quite diverse among countries at different income levels. While both relative and absolute decoupling is evident in the high-income countries, the middle-income countries have not been successful in reaching carbon-efficient economic growth in their high growth phase (Charts 3 and 4). Policy interventions, however, have significantly moderated the absolute change in emissions since 2015 for the middle-income countries.
In sum, while the growing recognition of and actions concerning climate change have weakened the correlation between carbon emissions and GDP growth globally, an absolute decoupling is yet to happen. Reduction in energy intensity of GDP and carbon intensity of energy consumption are two important channels for ensuring an absolute decoupling, going forward. References: Kar, A. K. (2022). Environmental Kuznets Curve for CO2 Emissions in Baltic Countries: An Empirical Investigation. Environmental Science and Pollution Research, 29(31), 47189-47208. Kaya, Y. (1989). Impact of Carbon Dioxide Emission Control on GNP growth: Interpretation of Proposed Scenarios. Intergovernmental Panel on Climate Change/Response Strategies Working Group, May. Stern, D. I. (2004). The Rise and Fall of The Environmental Kuznets Curve. World Development, 32(8), 1419-1439. Torun, E., Akdeniz, A. D. A., Demireli, E., and Grima, S. (2022). Long-Term US Economic Growth and the Carbon Dioxide Emissions Nexus: A Wavelet-Based Approach. Sustainability 2022, 14, 10566. | I.30 In the current state of climate policy action that incorporates all pledges and targets announced so far, the global rise in temperature can reach a minimum of 1.9 degrees Celsius above pre-Industrial Revolution levels under the most optimistic path of global emission reduction – above the current target of 1.5 degrees Celsius (Charts I.15 and I.16). Box I.2
International Climate Equity and Justice: Some Analytical Insights Any sustainable solution to climate change needs to factor in the unequal contributions to past emissions and the unequal future ramifications for development across countries. This has been emphasised in the principle of “Common but Differentiated Responsibilities and Respective Capabilities” of the UNFCCC (UN, 1992). 58 per cent of the historical cumulative net emissions occurred between 1850 and 1989 and about 42 per cent between 1990 and 2019. High-income countries have cumulatively contributed about 57 per cent of total CO2 emissions during the period of 1750-2020 (Charts 1 and 2). In comparison with the earlier Contraction and Convergence approach, the Climate Equity Reference Framework (CERF) includes elements of responsibility and capability to arrive at country-specific mitigation and adaptation plans (Kanitkar and Jayaraman, 2019). The major role played by high-income countries in global CO2 emissions is borne out when we consider the per capita emissions instead of absolute emissions (Chart 3). Taking consumption-based emissions instead of production-based emissions also underlines the greater contribution of high-income countries to global CO2 emissions. This is because even if the domestic production in these countries may entail lower emissions, they are net importers of emissions (Chart 4). The current central estimate of the carbon budget from 2020 onwards for limiting warming to 1.5 degrees Celsius (with a probability of 50 per cent) has been assessed at 500 CO2 gigatonnes (GtCO2), and 1150 GtCO2 for limiting warming to 2 degrees Celsius (with a probability of 67 per cent) (IPCC, 2022). In apportioning this remaining carbon space, the cumulative carbon space used by countries since their industrialisation needs to be an important consideration for ensuring global equity and justice.
References: IPCC (2022). Summary for Policymakers. Climate Change 2022: Mitigation of Climate Change. Contribution of Working Group III to the Sixth Assessment Report of the Intergovernmental Panel on Climate Change. Cambridge University Press, Cambridge, UK and New York. Doi: 10.1017/9781009157926.001. Kanitkar, T. and T. Jayaraman (2019). Equity in long-term mitigation. In Dubash. N. K. (ed.). India in a Warming World: Integrating Climate Change and Development. Oxford University Press, pp. 92-113. ISBN 9780199498734. United Nations (UN) (1992). Report on United Nations Conference on Environment and Development. https://www.un.org/en/development/desa/population/migration/generalassembly/docs/globalcompact/A_CONF.151_26_Vol.I_Declaration.pdf | I.31 Implementation of various climate finance commitments from advanced economies has been far from satisfactory. The extent of green financing for climate change adaptation has been about 5-10 times lower than required, and the gap between the required and actual has only grown (UNEP, 2022). As against the amount of US$ 100 billion pledged by advanced economies, only US$ 83.3 billion has been provided in 2020, marking an increase of just 4 per cent from 2019 (Chart I.17). While the Paris Agreement has emphasised on maintaining a balance between adaptation and mitigation finance, financial support for mitigation has remained higher than for adaptation (Chart I.18).
I.32 While the number of deaths associated with extreme weather events has been on the wane, reflecting better adaptation, the economic costs associated with such events have been on a rapid rise (Chart I.19).
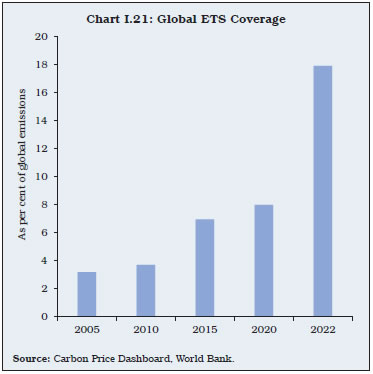
3.1 Instruments of Climate Policy I.33 Most economies have adopted fiscal policy as the primary instrument to achieve climate change commitments and targets (Annex I.2), as it is widely regarded as the most effective means for internalising the externalities of climate change and curbing emissions (Barker and Ekins, 2001; Nordhaus, 2007; Weitzman, 2014). The commonly used fiscal policy instruments include (a) price-based instruments – carbon taxes; feed-in tariffs; renewable subsidies; and (b) quantity-based instruments – emissions trading system (ETS) and renewable quotas. 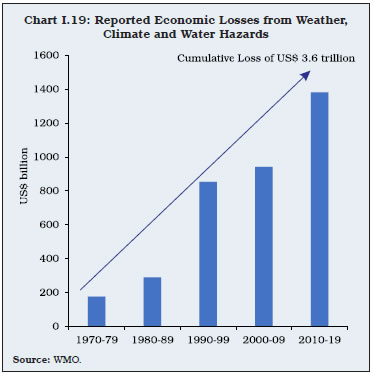 I.34 Carbon taxes are expected to shift power generation from coal towards renewables while supporting public revenue mobilisation and bringing down the distortionary effects of other taxes20. Emissions trading systems (ETS), being market-based, are easier to implement; however, they have limited coverage, as they are used primarily by large emitters (Parry et al., 2022). Unlike carbon taxes which can help in the price discovery of carbon emissions, emission trading targets the quantum of emissions while keeping the carbon price uncertain (Weitzman, 2014). Globally, there has been a rapid increase in the use of carbon taxes and ETS (Charts I.20 and I.21), but they still account for a small share of total global emissions. 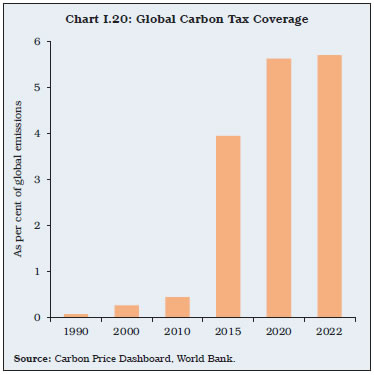
 I.35 Traditionally, monetary and regulatory policies have been considered neither necessary nor effective in addressing climate change. In recent years, however, there has been a growing role of regulatory policies in the climate policy toolkit (Annex I.2). This reflects the recognition of their role in encouraging green or Environmental, Social and Governance (ESG) finance and incentivising investors towards low-carbon instruments. Making further headway in climate action requires not just meeting the earlier commitments but also entering into swifter and stronger policy commitments for the future. 4. India’s Involvement in Global Climate Change and Action I.36 India will surpass China in 2023 to become the most populous country in the world. Alongside its aspiration to transform into the manufacturing hub of the world, India’s energy needs will rise and hence, a large and more intense involvement in global climate action is crucial. This also assumes urgency in view of India’s vulnerability to climate change. 4.1 India’s Vulnerability to Climate Change I.37 The natural impact of climate change on India is evident in more than one way. First, the average air surface temperature for India has risen by around 0.7 degree Celsius during 1901-2018 (Krishnan et al., 2020). When compared globally, however, the rise in India’s temperature across all decades seems limited (Chart I.22). I.38 The average temperature in India by the end of the 21st century is projected to increase by about 4.4 degrees Celsius relative to the average during 1976-2005 (ibid) (Chart I.23). I.39 Second, the rise in the sea level in the north-Indian Ocean was at a rate of 1.06-1.75 mm per year during 1874-2004, which accelerated to 3.3 mm per year during 1993-2017 that is comparable to the current rise in the global mean sea level (ibid). India remains vulnerable to sea level increase, which threatens its low-lying small islands as well as major coastal cities21. Third, the precipitation for June to September in India declined by around 6 per cent during 1951-2015, particularly over the Indo-Gangetic plains and the Western Ghats. This is attributed to aerosol cooling over the northern hemisphere, which has offset the warming from GHGs (ibid). Fourth, there has been a distinct increase in the occurrence of natural disasters in India in recent decades (Chart I.24).
4.2 India’s Contribution to Global Climate Change I.40 India’s contribution to cumulative global emissions of GHGs has been limited, although its cumulative emissions have increased during 1950-1990 and 1991-2020. Its contribution to consumption-based emissions is, however, significantly lower than production-based emissions vis-à-vis major developed countries (Table I.2).
| Table I.2: Cumulative CO2 Emissions: India vis-à-vis World | | Country | Cumulative Emissions of CO2 | Difference between Consumption and Production-based Emissions
(Percentage points) | | (Billion tonnes) | | 1950-1990 | 1991-2020 | | Developed world | | US | 157.21 | 167.53 | 4.3 | | EU+UK | 144.50 | 118.98 | 18.6 | | Three others (1) | 40.46 | 68.44 | 12.2 | | Developing world | | China | 41.13 | 192.56 | -13.5 | | India | 9.02 | 43.40 | -7.1 | | Three others (2) | 12.70 | 32.77 | 6.9 | | Oil and coal exporters | | Russia | 59.72 | 48.96 | -21.6 | | Saudi Arabia | 3.06 | 12.75 | -3.9 | | Three others (3) | 17.08 | 37.84 | -14.8 | | World | 577.29 | 888.92 | | Note: (1) Japan, Canada and South Korea, (2) Brazil, Mexico and Turkey, (3) Australia, Iran and South Africa.
Source: Desai (2022). |
I.41 In India, per capita CO2 emissions have been on a rise in recent decades, as in China and Russia (Chart I.25); however, the energy intensity of GDP (use of primary energy per unit of GDP) has been on a steady decline since the 1990s across almost all countries, including India (Chart I.26). I.42 In the deliberations and actions associated with climate change, India’s position is defined less by its contribution to past global emissions of GHGs and more by (a) its higher vulnerability to the ongoing and future disruptions caused by climate change; (b) its developmental priorities that may increase its contribution of future GHGs; and (c) its role in designing both supply-side policies and demand-side innovations to manage future GHGs. The reduction in emissions can have differential effects on various sectors of the Indian economy, including agriculture (Box I.3). Box I.3
Implications of Climate Risk Factors for Indian Agriculture Climate change encompasses a host of factors, such as variations in temperature, precipitation, CO2 emissions, humidity, wind, and extreme weather events. These factors individually or in interaction with other factors can influence agricultural production/productivity. They could either intensify the negative impact on production/productivity or improve it. From the emerging world, India offers an important case study for understanding the implications of climate change for agriculture, given (a) the critical role played by agriculture in providing an anchor to India’s gross value-added and livelihoods through employment generation and food security; and (b) the vulnerability of Indian agriculture to climate risk factors owing to a relatively weak weatherproofing of the sector. Simulated scenarios till 2050 suggest high sensitivity of Indian agricultural production to climatic factors (Dasgupta, 2018).  The results indicate that Indian agriculture is sensitive to climate change (Jha et al., 2022). Climate risk factors, both independently and when interacted with other climate variables can negatively affect various attributes of agricultural production (Table 1). | Table 1: Salient Results from Sequential MARS Model | | Independent Variables/ Interactions | Dependent Variables | Degrees of Interaction | Coefficients | R2 | | Temperature | Area under foodgrains | 2 | 0.35 | 0.62 | | CO2 emissions | Foodgrain production | 2 | 0.16 | 0.81 | | CO2 emissions Precipitation | Foodgrain yield | 2 | 0.11 | 0.75 | | Area under oilseeds | 2 | -0.5 | 0.92 | | Precipitation | Oilseed production | 2 | -0.4 | 0.94 | | Precipitation, Irrigation | Oilseed yield | 3 | 0.02, -0.05 | 0.89 | | CO2 emissions | Foodgrain production (kharif) | 2 | 0.72 | 0.78 | | CO2 emissions | Foodgrain yield (kharif) | 2 | 0.91 | 0.56 | | Rainfall | Oilseed production (kharif) | 2 | -0.25 | 0.77 | | Rainfall, Irrigation | Oilseed yield (kharif) | 3 | -0.18, 0.04 | 0.84 | Note: The sequential MARS model parameters presented here reflect the impacts of climate variables taken either independently or along with their interactions with other variables.
Source: Jha et al. (2022). | References: Dasgupta, P. (2018). Climatic Change Impacts on Foodgrain Production in India. In Vikram D. Anantha D. and Nandan N. (eds.). Ecology, Economy and Society: Essays in Honour of Kanchan Chopra, 63-82. Jha, P, Chinngaihlian S, Upreti P, and Handa A. (2022). A Machine Learning Approach to Assess Implications of Climate Risk Factors on Agriculture: The Indian Case. A mimeo. NOAA. (2021). National Oceanic and Atmospheric Administration. National Centers for Environmental Information. Monthly Global Climate Report for Annual 2020. Published online January 2021, retrieved on May 2, 2023 from https://www.ncei.noaa.gov/access/monitoring/monthly-report/global/202013. | 4.3 India’s Stake in Global Climate Action I.43 India’s involvement in climate change negotiations can be broadly divided into three phases (Youdon and Bajaj, 2022). In the first phase (1992-1997), India’s priorities were about preserving the interests of developing and least-developed countries by advocating the principles of equity, and common but differentiated responsibilities in meeting targets for emission reductions. In the second phase (2000-2009), India focused on climate finance, technology sharing and the creation of an adaptation fund for climate action by developing countries. During the third phase covering COP15 in Copenhagen in 2009 to the Paris Agreement in 2016, India supported green transition through a more flexible, cooperative, and holistic approach for formulating its National Action Plans on climate change. I.44 A strong commitment to climate action is reflected in various national development policies and programmes adopted by India in recent decades (Table I.3). I.45 Before COP21 in 2015, India submitted its intended NDCs to the UNFCCC with targets upto 2030, pledging to: (i) reduce its emissions intensity of GDP by 33-35 per cent from 2005 levels; (ii) increase the share of non-fossil-fuels-based electricity to 40 per cent with the help of transfer of technology and low-cost international finance mechanisms such as the Green Climate Fund22; and (iii) create an additional carbon sink23 of 2.5 to 3 billion tonnes of CO2 equivalent through extra forest and tree cover. | Table I.3: India’s Action Related to Climate Change | | Area | Salient Initiatives | | Science & Research | 1. Indian Network for Climate Change Assessment (INCCA)
2. Himalayan Glaciers Monitoring Programme
3. Launch of Indian Satellite to Monitor Greenhouse Gases
4. India’s Forest and Tree Cover as a Carbon Sink
5. India GHG Emissions Profile | | Policy Development | 6. Expert Group on Low Carbon Economy
7. State Action Plan on Climate Change
8. National Policy on Biofuels | | Policy Implementation | 9. National Missions under National Action Plan on Climate Change
10. National Conference on Green Building Materials and Technologies
11. In-Principle Approval to 30 Solar Cities
12. Energy Efficiency Standards for Appliances
13. Fuel Efficiency Norms
14. Clean Development Mechanism (CDM) Programme | | International Cooperation | 15. UN Climate Technology Conference
16. SAARC Environment Ministers’ Conference
17. India’s Submissions to UNFCCC | | Forestry | 18. State of Forest Report
19. Green India Mission
20. Capacity Building of Forestry, Intensification of Forestry Management and Inclusion of Forestry within MGNREGA | | Source: Ministry of Environment, Forest and Climate Change, Government of India. | I.46 At COP2624, India updated its NDCs, which represent the framework for its transition to cleaner energy for the period 2021-2030. It has committed to accommodate the panchamrit, which includes raising the non-fossil-fuels-based energy capacity of the country to 500 Gigawatt by 2030; 50 per cent of energy requirements from renewable sources; and 45 per cent reduction of carbon intensity by 2030. The updated NDCs reaffirm India’s commitment to work towards a low-carbon emission pathway, while simultaneously endeavouring to achieve sustainable development goals. Moreover, the Mission LiFE, i.e., Lifestyle for the Environment, launched by the Prime Minister in 2022, is now a global movement to connect the powers of the people for the protection of the earth. Mission LiFE makes the fight against climate change democratic, because everyone can contribute within one’s capacity. I.47 India has set itself a target to achieve net zero by 2070. Toward achieving this target, India has released its LT-LEDS at the COP27 summit. With this, India has joined other so-called large emitters like China, the US, Russia and Japan which have already submitted their strategies. While optimising the trade-offs between growth and low-carbon emissions, the broad features of the strategy include: (a) rational utilisation of national resources with due regard to energy security; (b) increase the use of biofuels, green hydrogen fuel and electric vehicle penetration; (c) development of an integrated, efficient and low-carbon transport system; (d) promotion of adaptation measures in urban design; and (e) CO2 removal through innovation, technology transfer, climate-specific finance and capacity building with international support. I.48 India has made progress towards meeting the net zero target. The current set of actions on climate change is the result of learning from its own experience and those of other countries, and the awareness of the risks and costs associated with the adverse impact of climate change. India is keen to form knowledge networks by facilitating data sharing and information exchange at the institutional level to share its experience and learnings with the rest of the world by participating in research and development activities. Mitigating the growing GHG concentration in the atmosphere will include harnessing the potential in mangroves to absorb more carbon emissions than landed tropical forests. Accordingly, dedicated commitments have been made towards conservation and management of mangroves. I.49 The Ministry of Science and Technology launched the National Mission for Sustainable Himalayan Ecosystem in 2010 to understand the implications of climate change on the Himalayan ecosystem in order to conserve and protect its biodiversity. A separate Mission for Green India was launched by the Ministry of Environment, Forests and Climate Change in 2014 to provide livelihoods to 3 million people through forest-based activities and carbon sequestration capacity. I.50 With the coming into force of the Energy Conservation Act of 2001, the Ministry of Power launched a similar Mission in 2011 known as National Mission for Enhanced Energy Efficiency (NMEEE) to make energy savings. India has co-founded the International Solar Alliance (ISA) with France in 2016 and announced a National Hydrogen Mission to increase the dependency on green energy. Moreover, the Government of India has established an adaptation fund and provided initiatives under its National Action Plan for climate change. India’s progress in adaptation and mitigation of climate change is evident from the rise in its Climate Change Performance Index (CCPI) in recent years (Chart I.27). I.51 Currently, about 80 per cent of the electricity generation in India is from fossil fuels (Chart I.28). Future energy transitions for India can be estimated under two different scenarios underlining the urgent need for a structured change in the energy sector (Box I.4). I.52 In sum, India is using the challenge of climate change to propagate action globally and has, in fact, emerged as a leading voice from the emerging world. It is undertaking numerous policy actions as part of the global commitments while pushing outwards the boundaries of its development priorities. 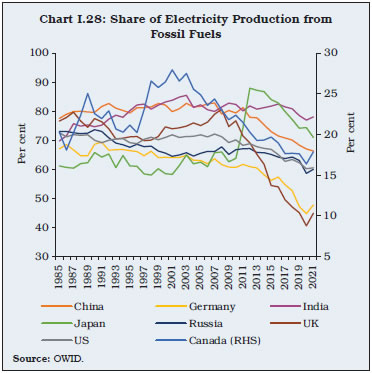
Box I.4
Energy Transition Scenarios for India To reduce CO2 emissions, renewable energy needs to sufficiently replace the carbon-emitting sources of energy. The transition process could be induced by direct or indirect taxes on carbon and subsidies to promote renewable energy. Under different globally coordinated policy scenarios, the amount of renewable energy capacity and generation would differ, calling for public investments of differential magnitudes.
Even though fossil fuels dominate India’s energy production at present, there has also been a steady rise in the production of renewable energy over the years (Charts 1 and 2). The transition to renewables needs to pick up at a faster pace. The share of renewables is going to rise significantly under the Announced Pledges Scenario (APS) as compared to the Stated Policies Scenario (STEPS) for India (Charts 3 and 4)25. The rise in energy demand under STEPS for India is estimated at 3 per cent between 2021 and 2030, as fossil fuel use is likely to increase steeply, mainly led by coal during this period. Oil will remain a major source of energy for the transport sector. Under APS, coal demand in India is expected to reduce by around one-third of its predicted value by 2050 due to NDCs. Under this scenario, India will have to generate around 61 per cent of its energy supply from renewable sources. Thus, under APS, India may observe a faster emergence of low-emission alternatives in power, industry and transport sectors, and a sharper fall in coal use and rise in renewables in line with its 2070 net zero goal. References: International Energy Agency (2022). World Energy Outlook 2022. License: CC BY 4.0 (report); CC BY NC SA 4.0. https://www.iea.org/reports/world-energy-outlook-2022. IRENA (2022). Renewable Energy Statistics 2022. International Renewable Energy Agency, Abu Dhabi. https://www.irena.org/-/media/Files/IRENA/Agency/Publication/2022/Jul/IRENA_Renewable_energy_statistics_2022.pdf?rev=8e3c22a36f964fa2ad8a50e0b4437870. | 5. Climate Change and the Reserve Bank of India I.53 Climate change has been appropriately assigned to the domain of fiscal policy. Central banks, given their relatively narrow mandates of price and financial stability, and fewer instruments at their disposal, have hitherto adhered to their core competence. As a result, the newer assignment of climate change to them has provoked an animated debate. It is argued that central banks lack the necessary tools and domain knowledge to address climate change (Hansen, 2022; and Rajan, 2023). I.54 It is also argued that climate change may take central banks away from the pursuit of price stability, which can affect their credibility in meeting their primary mandate. In fact, undue expectations from central banks about addressing climate change, if unfulfilled, can tarnish their reputation (Issing, 2021). Furthermore, central banks’ actions may not always complement governmental actions on climate matters. Hence, they may face (a) “calibration risk” with regard to their ability to adjust their instruments towards managing climate risks without an explicit need for additional mandates and tools; and (b) “capture risk” with respect to their independence from the government’s climate policy (Masciandaro and Russo, 2022). Moreover, introducing climate change as an explicit mandate may require complex and cumbersome amendments in the existing institutional structures governing central banks (ibid). In sum, climate change in the context of central banks has come to be regarded as “mission creep” - a gradual broadening of their objectives beyond the original scope or focus. I.55 On the other hand, there is a growing recognition that even if governments are the most influential agency for climate change, all institutions, including central banks and financial sector regulators/supervisors, are stakeholders and especially so in view of the existential threat to their central mandates. Climate change can affect price stability through supply shocks such as food and energy shortages and through a decline in productive capacity. Climate-related risk can also lead to inflation volatility, which can effectively de-anchor inflation expectations. Furthermore, even if mitigation policies such as carbon pricing are forceful, they can affect price stability, potentially precipitating large and long-lasting movements in relative prices (NGFS, 2020). Demand shocks can arise due to the loss of wealth of firms and households on account of frequent natural disasters. Physical and transition risks can affect the balance sheets of financial institutions and banks, limiting the flow of credit to the real economy (Schnabel, 2021). Climate-induced uncertainty can make households save more for precautionary purposes, bringing down the real equilibrium interest rate (ibid)26. There are several channels through which climate change can affect monetary transmission (Chart I.29). 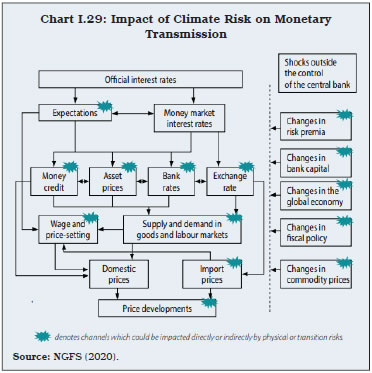 I.56 Central banks also face challenges to their financial stability mandate from climate risk which can affect the valuation of financial assets by influencing investors’ risk perceptions (FSB, 2020). This can create volatility in traded assets. Uncertainty in asset prices can, in turn, reduce the effectiveness of hedging, further increasing the vulnerability of banks and financial institutions. Depreciation pressures on currencies of countries frequently affected by climate disasters can cause financial instability, higher import costs and negative terms of trade. Transition risks can operate through multiple channels, exacerbating traditional risks in all categories, including credit, market, liquidity, operational and reputational risks for banks and financial institutions. The carbon footprint or financial exposure of banks to climate change has, in fact, gone up significantly in recent years (Chart I.30). 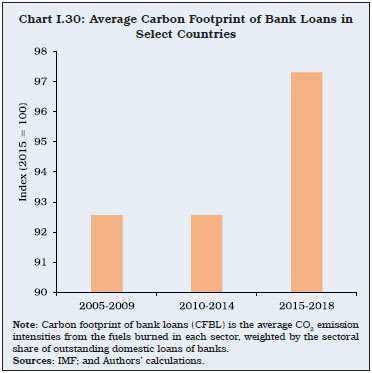 I.57 The consensus is hence coalescing to the position that central banks are uniquely placed to address climate change. They have a critical role in the promotion of green/sustainable finance through a mix of developmental and prudential regulatory policies27. With this growing recognition, there have been several global interventions to involve central banks and other financial authorities into climate action (Annex I.2). The Network for Greening the Financial System (NGFS), comprising central banks and supervisors, was established in 2017 to (a) strengthen the global response for meeting the Paris Agreement goals; and (b) enhance the role of the financial system in managing risks from climate change and mobilising green finance for environmentally sustainable development28. As of March 2023, NGFS consists of 125 members and 19 observers (NGFS, 2023)29. I.58 Climate change is a rapidly emerging area of policy interest in the RBI. Back in 2007, the RBI advised banks to put in place Board-approved plans of action towards helping the cause of sustainable development. In 2015, the RBI included loans for generation of renewable energy and public utilities run on non-conventional energy as part of its priority sector lending (PSL) policy to incentivise the development of green energy sources. More recently, the RBI has taken initiatives aimed at understanding the implications of climate change for India’s financial sector for an informed climate-related policy, and the financing of green projects. In April 2021, the RBI joined the NGFS to benefit from and contribute to the best practices in climate risk management and green finance. In its statement, the RBI highlighted three commitments while noting national commitments, priorities and complexity of the Indian financial system: (a) exploring how climate scenario exercises can be used to identify vulnerabilities in RBI-supervised entities’ balance sheets, business models and gaps in their capabilities for measuring and managing climate-related financial risks; (b) integrating climate-related risks into financial stability monitoring; and (c) building awareness about climate-related risks among regulated financial institutions and spreading knowledge about issues relating to climate change and methods to deal with them accordingly. I.59 In July 2022, the RBI released its seminal “Discussion Paper on Climate Risk and Sustainable Finance”, providing broad guidance for RBI-regulated entities to develop good practices on (a) appropriate governance; (b) climate risk strategy; and (c) risk management structure. It also laid out guidance for voluntary initiatives by regulated entities on green finance, setting up of green branches and green data centres, encouraging greater use of electronic means of communication instead of paper, and renewable energy sources. In January 2023, the RBI issued sovereign green bonds to mobilise resources for the Government for green infrastructural investments. This move was in keeping with panchamrit, the five-point strategy for climate action announced by the Government during COP26. More recently, in April 2023, the framework for mobilising green deposits by regulated entities has been released by the RBI with a view to fostering and developing green finance ecosystem in the country. I.60 There has also been a distinct focus on climate-related issues in the RBI’s research in recent times: this Report is a case in point. Applying global learnings on climate change to Indian data, each chapter of the Report uncovers the possible implications of climate change for the Indian economy and in preparing for the future. 6. Concluding Observations I.61 Affirmative action for greening the earth as a global policy good is gaining traction. Despite its slow pace of implementation, the Paris Agreement of 2016 has offered hope for the transition towards a greener cleaner world. India has set itself a target to achieve net zero by 2070 and is making significant progress in expanding its non-fossil-fuels-based energy capacity. The updated NDCs reaffirm this commitment to work towards a low-carbon emission pathway, while simultaneously endeavouring to achieve sustainable development goals. India’s Mission LiFE seeks to empower people to fight against climate change. With the growing recognition that climate change can affect price stability and financial stability, central banks, including the RBI, are assuming an important role in addressing climate change. This Report reflects that new mission. I.62 Chapter II analyses the effects of climate change on the Indian economy with an assessment of the growth-inflation-emission trade-offs under different scenarios linked to India’s NDCs. A highlight of the chapter is the documentation of the specific topographical and economic characteristics of the country that determine its high vulnerability to climate risks while dealing with the challenge of balancing its growth and environmental aspirations. I.63 Chapter III discusses the risks to India’s financial sector from climate change, channels of risk transmission, the national potential to mitigate those risks and provide adequate financing for green transition. This chapter employs a dynamic stochastic general equilibrium (DSGE) model to assess the impact of climate shocks on capital stock, consumption, income, inflation and interest rates, as these variables can influence the financial soundness of banks. It presents the findings of a pilot survey of stakeholders in assessing the level of awareness about the transition risk and the adoption of adequate risk mitigation strategies. The chapter also conducts climate stress tests to assess the banking sector’s vulnerability to climate risks. I.64 Chapter IV explores a range of feasible policy options encompassing various domains such as fiscal policy, technology, international trade, regulatory and monetary policy, markets-based and citizen-centric measures to achieve India’s net zero target. References: Barker, T., and Ekins, P. (2001). How High are the Costs of Kyoto for the US Economy. Tyndall Centre Working Paper No.4. 4 July 2001. Cheng, L., Abraham, J., Hausfather, Z., and Trenberth, K. E. (2019). How fast are the Oceans Warming?. Science, 363(6423), 128-129. Cheng, L., Trenberth, K. E., Fasullo, J., Boyer, T., Abraham, J., and Zhu, J. (2017). Improved Estimates of Ocean Heat Content from 1960 to 2015. Science Advances, Vol 3, Issue 3. Church, J. A., and White, N. J. (2011). Sea-level Rise from the Late 19th to the Early 21st Century. Surveys in Geophysics, 32, 585-602. Dasgupta, P. (2021). The Economics of Biodiversity: The Dasgupta Review. HM Treasury, London. ISBN 978-1-911680-29-1. Denton, F., Wilbanks, T. J., Abeysinghe, A. C., Burton, I., Gao, Q., Lemos, M. C., ... and Warner, K. (2014). Climate-resilient Pathways: Adaptation, Mitigation, and Sustainable Development. Climate Change, 1101-1131. Desai N. (2022). Managing Climate Risk. India 2021: A Symposium on the Year That Was. Seminar. January 2022. https://www.india-seminar.com/2022/749/749-NITIN%20DESAI.htm. FSB (2020). The Implications of Climate Change for Financial Stability. Financial Stability Board Report. November 23, 2020. Gütschow, J., Jeffery, M. L., Gieseke, R., Gebel, R., Stevens, D., Krapp, M., and Rocha, M. (2016). The PRIMAP-hist National Historical Emissions Time Series. Earth System Science Data, 8(2), 571-603. Green Finance Study Group. (2016). G20 Green Finance Synthesis Report. September. http://unepinquiry.org/wp-content/uploads/2016/09/Synthesis_Report_Full_EN.pdf. Hansen, L. P. (2022). Central Banking Challenges Posed by Uncertain Climate Change and Natural Disasters. Journal of Monetary Economics, 125, 1-15. IMD (2023). Statement on Climate of India during 2022. Press Release. Ministry of Earth Sciences. https://mausam.imd.gov.in/Forecast/marquee_data/Statement_climate_of_india_2022_final.pdf. International Energy Agency (2021). Net Zero by 2050. IEA, Paris. https://www.iea.org/reports/net-zero-by-2050, License: CC BY 4.0. IPCC (1990). IPCC First Assessment Report Overview and Policymaker Summaries and 1992 IPCC Supplement. Digitized by the Digitization and Microform Unit, UNOG Library, 2010. https://www.ipcc.ch/report/ar1/syr/. IPCC (2021). Summary for Policymakers. Climate Change 2021: The Physical Science Basis. Contribution of Working Group I to the Sixth Assessment Report of the Intergovernmental Panel on Climate Change. Cambridge University Press, Cambridge, United Kingdom and New York, NY, USA, pp. 3−32, doi:10.1017/9781009157896.001. Issing, O. (2021). Central banks-independent or almighty? SAFE Policy Letter. (No. 92). Jackson, P. (2007). From Stockholm to Kyoto: A Brief History of Climate Change. UN Chronicle, 44(2). https://www.un.org/en/chronicle/article/stockholm-kyoto-brief-history-climate-change. Krogstrup, S., and Oman, W. (2019). Macroeconomic and Financial Policies for Climate Change Mitigation: A Review of the Literature. IMF Working Paper No. 19/185. Krishnan, R., Sanjay, J., Gnanaseelan, C., Mujumdar, M., Kulkarni, A., and Chakraborty, S. (2020). Assessment of Climate Change Over the Indian Region: A Report of the Ministry of Earth Sciences (MOES), Government of India (p. 226). Springer Nature. Livingstone, D. N. (2011). Environmental Determinism. The SAGE Handbook of Geographical Knowledge. SAGE, London, UK. https://doi.org/10.4135/9781446201091, (28), 368-380. Marshall, A. (1895). Principles of Economics. Macmillan and Co. Vol.1, Edition 3. Masciandaro, D., and Russo, R. (2022). Central Banks and Climate Change Policies: It is not Always a Positive Sum Game. SUERF Policy Brief No. 398, August 2022. McKitrick, R. (1997). Double Dividend Environmental Taxation and Canadian Carbon Emissions Control. Canadian Public Policy/ Analyse de Politiques, 417-434. Montesquieu (1748). Spirit of Laws. University of Chicago Press. Volume 1, Chapter 15, Document 4. http://press-pubs.uchicago.edu/founders/documents/v1ch15s4.html. National Research Council (NRC). (2001). Climate Change Science: An Analysis of Some Key Questions. National Academies Press. Washington DC. Neue, H. U. (1993). Methane Emission from Rice Fields. Bioscience, 43(7), 466-474. NGFS (2020). Climate Change and Monetary Policy: Initial Takeaways. Network for Greening the Financial System. Technical Document. June 2020. Nordhaus, W. D. (1992). The ‘DICE’model: Background and Structure of a Dynamic Integrated Climate-Economy Model of the Economics of Global Warming. Cowles Foundation Discussion Papers. 1252. https://elischolar.library.yale.edu/cowles-discussion-paper-series/1252. Nordhaus, W. D. (2007). The Challenge of Global Warming: Economic Models and Environmental Policy (Vol. 4). New Haven: Yale University. Parry, I. W., Black, S., and Zhunussova, K. (2022). Carbon Taxes or Emissions Trading Systems?: Instrument Choice and Design. Staff Climate Notes, 2022(006). International Monetary Fund, Washington, DC. Pingali, P. L. (2012). Green Revolution: Impacts, Limits, and the Path Ahead. Proceedings of the National Academy of Sciences, 109(31), 12302-12308. Rajan, R. (2023). For Central Banks, Less is More. Finance and Development, IMF, March 2023. Schnabel, I. (2021). Climate Change and Monetary Policy. Finance and Development, 58(3), 53-55. Scott, M. and Lindsay, R. (2020). What’s the Hottest Earth’s Ever Been? www.climate.gov/news features/climate-qu/what’s-hottest-earth’s-ever-been. Sejas, S. A., Cai, M., Hu, A., Meehl, G. A., Washington, W., and Taylor, P. C. (2014). Individual Feedback Contributions to the Seasonality of Surface Warming. Journal of Climate, 27(14), 5653-5669. Steiner, J. L., and Fortuna, A. M. (2020). Climate Change, Greenhouse Gas Emissions, and Carbon Sequestration: Challenges and Solutions for Natural Resources Conservation Through Time. Soil and Water Conservation: A Celebration of 75 Years. ISBN 978-0-9856923-2-2. Stern, N. (2007). Stern Review: The Economics of Climate Change. Cambridge University Press. https://doi.org/10.1017/CBO9780511817434. Subramanian, M. (2019). Anthropocene Now: Influential Panel Votes to Recognize Earth’s New Epoch. Nature. 21 May 2019, DOI: 10.1038/ d41586-019-01641-5. United Nations Environment Programme (UNEP). (2022). Adaptation Gap Report 2022: Too Little, Too Slow – Climate Adaptation Failure Puts World at Risk. Nairobi. https://www.unep.org/adaptation-gap-report-2022. Weitzman, M. L. (2014). Can Negotiating a Uniform Carbon Price Help to Internalize the Global Warming Externality? Journal of the Association of Environmental and Resource Economists, 1(1/2), 29-49. Weyant, J. (2017). Some Contributions of Integrated Assessment Models of Global Climate Change. Review of Environmental Economics and Policy. Volume 11, Number 1, Winter 2017. WMO (2021). WMO Atlas of Mortality and Economic Losses from Weather, Climate And Water Extremes.(1970–2019).(WMO-No.1267). https://library.wmo.int/index.php?lvl=notice_display&id=21930#.ZDTlvnZBy3C WMO (2022). Eight Warmest Years on Record Witness Upsurge in Climate Change Impacts. WMO Press Release Number: 06112022. https://public.wmo.int/en/media/press-release/eight-warmest-years-record-witness-upsurge-climate-change-impacts. WMO (2023). WMO Annual Report Highlights Continuous Advance of Climate Change. Press Release Number: 21042023. https://public.wmo.int/en/media/press-release/wmo-annual-report-highlights-continuous-advance-of-climate-change Youdon, C. and Bajaj, P. (2022). India’s Approach and Position on Climate Change Governance. National Maritime Foundation. https://maritimeindia.org/indias-approach-and-position-on-climate-change-governance/. Zillman, J. W. (2009). A History of Climate Activities. World Meteorological Organization (WMO) Bulletin, 58(3), 141.
| Annex I.1: Major Global Interventions for Climate Change | | Year | Global Intervention | Issues Addressed/Initiatives | | 1972 | Stockholm International Summit | Led to the creation of UNEP | | 1979 | World Climate Conference I | Endorsed plans to establish a World Climate Programme (WCP) under WMO, UNEP, and the International Council of Scientific Unions (ICSU), focusing on climate data, climate applications, climate research and climate impact study programmes | | 1987 | Montreal Protocol | Focused on global reduction of production of substances damaging the ozone layer, such as CFCs | | 1988 | Creation of IPCC | Established for inter-governmental assessment of the science, impacts and response options for climate change | | 1992 | UN Conference on Environment and Development or the “Earth Summit” | Adoption of
(a) A plan of action at the global, national and local levels to address human impact on the environment (UN, 1992)
(b) Rio Declaration on Environment and Development aimed at working towards international agreements to “protect the integrity of the global environmental and developmental system” | | 1992 | UN Framework Convention on Climate Change (UNFCCC) | Establishment of Conference of the Parties (COP) for international discussions on stabilisation of GHG concentration in the atmosphere at a level that would prevent dangerous anthropogenic interference with the climate system | | 1995 | First Meeting of UNFCCC COP (COP1) | Aimed at an annual review of the Convention and to take decisions to promote its implementation | | 2005 | Kyoto Protocol | The first legally binding climate treaty that required developed countries to reduce emissions by an average of 5 per cent below the 1990-levels over 2008-2012 | | 2009 | Copenhagen Accord | Agreement to reduce global emissions to hold the increase in global temperature below 2 degrees Celsius (UN, 1992) | | 2016 | Paris Agreement | The Agreement focussed on:
a) Reduction of GHG emissions to limit the global temperature increase to 2 degrees Celsius and further to 1.5 degrees Celsius;
b) Provision of financing to developing countries for climate change mitigation and adaptation | | 2021 | COP26 | a) Phase down of coal power and phaseout of inefficient fossil fuel subsidies;
b) Delivering on climate finance pledge of US$ 100 billion by developed countries;
c) Launching “Glasgow dialogue” to address loss and damage associated with climate change | | 2022 | COP27 | Reaffirming the commitments of global average temperature reduction, it
a) Marked a breakthrough agreement on “Loss and Damage” fund including damage to crops, homes or infrastructure, human health, etc.;
b) Urged countries to integrate water into their adaptation efforts | Source: Authors’ compilation. |
| Annex I.2: Climate Policies Being Implemented in Select Countries | | Type of Policy | Illustration of the Policy Instrument | Country Examples | | Fiscal Policy | National carbon taxes; Cap-and-Trade (CaT) or Emissions trading systems (ETS); Emission or energy efficiency standards30 | • 70 direct carbon pricing instruments operating in 47 jurisdictions with 34 ETS and 36 carbon tax regimes (World Bank, 2022)
• EU and Japan have the most stringent energy efficiency standards | | Feed-in tariffs (FIT); Renewable quotas31 | • 69 countries have implemented some form of FIT (OECD, 2019)
• China has implemented a quota system | | Public investment in infrastructure and social development; Partnership between private sector, government, development bank, and long-term institutional investors | EU (Infrastructure Investment Plan); China (Urban Development Investment Corporation) | | Public guarantees as loan commitments; Credit or cash flow guarantees; Multi-sovereign guarantees | World Bank Multilateral Investment Guarantee Agency (MIGA), European Investment Fund Guarantee Scheme | | Regulatory Policy | Redressing underpricing by greater transparency of climate risks; Climate- related financial data; Climate-related risk disclosures; Taxonomy of green assets; Climate-related stress tests; Macro-prudential tools | UK, France, Brazil, China | | Green supporting and brown penalising factors in capital requirements; International requirements of minimum amount of green assets on balance sheets; Notional carbon prices; Corporate governance reforms | Lebanon, Brazil, China | | Green credit; Green insurance; Green securities; Credit allocation policies or Directed lending policies for renewables | China (Green Bond Endorsed Project Catalogue), India, Bangladesh | | Integrating climate risk analytics into collateral frameworks; Central bank portfolio management; Green QE; Developing own risk assessments; Ensuring climate risks are appropriately reflected in central bank asset portfolios | UK, Japan, Bangladesh, Netherlands, Norway, ECB (Purchase of EIB bonds) | | Source: Krogstrup et al. (2019). |
|