The global economy is losing steam, with growth slowing in some of the most resilient economies and high frequency indicators pointing to further levelling in the period ahead. In India, real GDP growth was at a six-quarter high in Q3:2023-24, powered by strong momentum, robust indirect taxes, and lower subsidies. The high visibility of structural demand and healthier corporate and bank balance sheets will likely be the galvanising forces for growth going forward. Even as inflation is on the ebb with broad-based softening of core inflation, the repetitive incidence of short amplitude food price pressures deters a swifter fall in headline inflation towards the target of 4 per cent. Introduction The global economy is losing steam, with real gross domestic product (GDP) growth slowing in some of the most resilient economies, flattening out and even mildly contracting in others. High frequency indicators point to further levelling in the period ahead. While business activity is showing some slender improvement in both advanced and emerging economies, external demand remains subdued amidst country-specific weaknesses, including in the property sector, and spiralling public debt. Labour markets remain resilient but are showing signs of easing, especially in terms of wage increases. In some emerging market economies (EMEs), unemployment rates are edging up. At the same time, heightened labour mobility, generative artificial intelligence (AI) and machine learning are lifting labour productivity and business formation. These developments were reflected in the February 29, 2024 Chair’s Summary of the first G20 Finance Ministers and Central Bank Governors meeting in Sao Paulo, Brazil which noted “that the likelihood of a soft landing in the global economy has increased, with growth showing resilience, despite divergences across countries and regions.” Inflation has been trending down, both headline and core, but in advanced economies (AEs) sticky services prices keep it still elevated relative to targets. Convergence will most likely be delayed till 2025. Accordingly, most central banks are holding policy rates steady, while tacitly acknowledging that the next move would likely be a cut in the direction of several central banks in Latin America. Central banks are flagging concerns over moving too quickly to cut interest rates, emphasising the importance of carefully assessing incoming data on whether or not inflation is moving down sustainably towards targets. This has imparted uncertainty as to how long a restrictive monetary policy stance needs to be maintained. Japan exited from negative policy rates as widely expected. At the other end of the spectrum, large reductions in key lending rates and reserve requirements in China have been undertaken to support economic activity. Markets remain exuberant about an imminent downshift in the path of monetary policy, notwithstanding high-for-longer tones in central bank speak. More recently, market expectations of the exact timing of rate cuts have been pared although they continue to fluctuate with incoming data and policy commentaries. Stubborn inflation numbers right up to the January readings have forced market participants to relinquish bets on extensive rate cuts in 2024. Even so, the risk of markets running ahead of central banks, prompting abrupt market movements, cannot be ruled out. Government bond yields in major AEs have climbed from the lows they hit in January 2024, in part due to central bank signals pushing back expectations of early rate cuts. Nonetheless, bond prices still reflect a more dovish assessment than that of central banks. Yet, burgeoning levels of public debt could provide a fertile habitat for the resurgence of bond vigilantism that could later tip the market over into brutal sell-offs. In fact, bond market volatility has exceeded equity market volatility. In the background, quantitative tightening (QT) is quietly at work, helping to keep financial conditions from excessively easing and shoring up central bank balance sheets reeling under large losses. Corporate spreads have compressed further. Private equity buyout firms are taking advantage of the recovery in corporate bond markets and saving on interest costs by refinancing debt raised in private credit markets with publicly traded bonds and loans. Stock markets and more generally risky assets have rallied on the back of the prospect of monetary easing, robust profitability of large corporates and the anticipated productivity gains related to AI. In foreign exchange markets, the US dollar has edged up, partly reversing the weakening seen towards the end of 2023, as expectations of rate cuts were pushed back. The euro and the yen have weakened. EMEs continue to receive buoyant portfolio inflows, driven by bonds. EME stocks are poised to erase recent losses, with the Morgan Stanley Capital International (MSCI) EM index trading above its 2023 close. Gains are being driven by technology shares. Sustained geopolitical uncertainties, demand from central banks readjusting their reserves and sticky inflation is driving up gold prices in search of safe haven. The 13th Ministerial Conference of the World Trade Organisation (WTO) concluded in Abu Dhabi on March 1 with few incremental outcomes, reflecting a shift in focus towards national industrial strategies. Members decided to continue not charging duties on digital products for the time being. A new plurilateral agreement on domestic regulations on services was adopted in the WTO. 72 countries are part of the plurilateral agreement. Several countries including India are not a part of the agreement as it may dilute WTO’s multilateral trade framework and hence its legality. On minimum support prices for agricultural crops, subsidies for fisheries and dispute settlement reforms, no decision was taken. The investment facilitation for development agreement was blocked as it is a non-trade issue and falling outside the mandate of the WTO’s multilateral trade framework. By the end of this century, almost every country in the world could have a shrinking population. People are living longer due to advances in healthcare and decline in poverty, but they are also having fewer babies. Over the past half century, the global fertility rate1 has halved to 2.3. However, in most AEs fertility rate has fallen below the replacement rate of 2.1.2 The result is a decline in working age populations, entailing significant social, economic and political implications. Developing nations are on a similar downward trajectory. The long-term drop in the fertility rate is the result of socio-economic trends such as rising female labour force participation and education, better welfare systems and lower childhood mortality. It is also a reflection of higher parenting costs, including the opportunity costs of childcare in lost earnings or leisure time. The impact of falling birth rates will be a higher burden of healthcare and pension spending for older populations falling on a shrinking workforce, leading to higher taxes and pressures on public finances. While some countries are adopting pro-natal policies, the economic and social forces driving declining births are unlikely to be reversed in the long term. Immigration could be a solution, but the politics remain difficult. Instead, older workers, AI and automation will have to pick up the slack created by fewer young people. In India, the end-February 2024 data release of the National Statistical Office (NSO) surprised strongly on the upside. Real GDP expanded at a six-quarter high rate in October-December 2023, powered by strong momentum, robust indirect taxes and lower subsidies. Our nowcast of real GDP growth for January-March 2024 (Section III) seen in conjunction with high-frequency indicators for the fourth quarter, suggests that the NSO’s estimate for the full year 2023-24 will be exceeded and a rate closer to 8 per cent may be clocked. Purchasing managers’ indices (PMI) reflect buoyant demand conditions, rising investment in technology, efficiency gains and favourable sales growth. The overall level of business confidence points to robust optimism about near-term prospects. Aggregate demand in the third quarter of 2023-24 was investment-driven, with some indications of a revival of the private capex cycle. Capacity utilisation in several sectors has reached a point where there has to be new investments. The high visibility of structural demand and healthier corporate and bank balance sheets will likely be galvanising forces. Central public sector entities achieved 92 per cent of their combined capital expenditure target for the year 2023-24 by February 2024. The current financial year will likely see the highest ever length of four-lane roads being constructed, along with the highest ever length of speed or access-controlled highways – on course to create a world-class road network by 2037. The biggest segment of aggregate demand – private final consumption expenditure – remained low, despite the third quarter coinciding with the festival season. Moreover, government final consumption contracted during the quarter. Market research indicates that the domestic fast moving consumer goods (FMCG) sector may experience moderate growth over the next six months. On the other hand, the demand outlook for premium consumer businesses is robust and the growth rhythm is expected to persist into the medium-term. This suggests that there are significant per capita income shifts underway. Small town opportunities are leading to growth of business across lifestyle segments, with companies that entered these markets enjoying the fruits of being first movers. New household consumption expenditure survey (HCES) information shows that per capita spending on durables and discretionary products has been rising in both rural and urban markets, with real per capita income up 1.5 times since 2011-12 at a compound annual growth rate of 4 per cent (Section III, Box B). The drag from net exports eased in relation to the preceding quarters of the year. On the output side, the manufacturing sector expanded at double digits, reflecting the sustained high profitability of corporates, aided by falling input costs. India Inc’s interest coverage ratio – earnings before interest and tax (EBIT) divided by the interest outgo - expanded for the third consecutive quarter in October-December 2023, helped by benign raw material prices and cost efficiencies even as topline growth remained moderate.3 Companies across several sectors reported improvement in the interest coverage ratio, including automobiles, cement, consumer durables, hospitality, oil and gas, petrochemicals, pharmaceuticals, and power. The manufacturing base has also been expanding. For instance, the entire semiconductor chip value chain – design; packaging and fabrication – has made its presence in the country. Construction activity remained robust. Services maintained pre-pandemic trend growth rates, with several constituents picking up pace sequentially. With corporate travel resuming after a pandemic-induced hiatus, the hospitality industry is slated for a healthy revenue growth, boosted by modest increase in average room rates (ARR) of 5-7 per cent and occupancy at 73-74 per cent. Meanwhile, the retail sector is in the midst of a transformation, with homegrown brands rapidly scaling up operations. In 2023, retail leasing in India’s top eight cities totalled 7.1 million square feet with domestic brands accounting for 70 per cent. The operational retail space of grade A malls amounted to 68.3 million square feet with capacity under construction rising by 10 per cent. The resurgence of global capability centres (GCCs) has also helped demand for grade A offices to expand strongly. Higher traction in overall leasing has aided the performance of listed companies in this segment. On the other hand, output from agriculture and allied activities went into contraction during the October-December 2023 quarter as the deficient southwest monsoon impacted the kharif harvest and fodder scarcity affected the livestock sector. Looking ahead, however, congenial conditions for the farm sector are foreseen. Various global weather models are forecasting that La Nina will set in by June and El Nino will turn neutral ahead of the forthcoming southwest monsoon season. Fuller details and analysis of these national income developments are presented in Section III. Hereafter, the NSO will provide five estimates of GDP instead of six, doing away with the third revised estimate. The final revision will be released two years from the completion of the financial year instead of three. Illustratively, the number for 2021-22 released on February 29, 2024 is the final one and the final number for 2022-23 will be released in 2025. The quarterly release calendar remains unchanged. Financial markets are on a roll in the backwash of these real sector developments. Stocks are riding an intense bull market - notwithstanding intermittent corrections - driven by a broad-based boom. While large caps are gaining, mid- and small-caps are rising even faster, with hints of froth and a spreading equity culture. Foreign investors account for their smallest share of the Indian stock market in a decade (at 16.3 per cent), reflecting increased buying by domestic institutions, including mutual funds.4 The INR is appreciating and is among the least volatile currencies. The INR has been bolstered by a pick-up in foreign direct investment (FDI) by 11.4 per cent year-on- year (y-o-y) in October-December 2023. Mergers and acquisitions jumped 78 per cent in terms of deal value in January 2024. Portfolio inflows during April-mid March 2023-24 accounted for a fifth of all such flows to EMEs. Bond yields are at 9-month lows. Corporate bonds are in strong demand with finer cut-offs. The inclusion of Indian sovereign bonds in global bond indices is spurring a strong demand for offshore rupee-denominated bonds issued mostly by multilateral institutions seeking exposure to India. According to the latest real-time data from the World Poverty Clock by the World Data Lab funded by the International Fund for Agricultural Development (IFAD), India has brought down extreme poverty to below 3 per cent of its population. The ‘escape rate’ calculates the current rate of poverty reduction in the world, taking US$ 2.15 a day as the threshold income. These findings are also reflected in the HCES 2022-23 cited earlier. Set against this backdrop, the remainder of the article is structured into four sections. Section II covers the rapidly evolving developments in the global economy. An assessment of domestic macroeconomic conditions is set out in Section III. Section IV encapsulates financial conditions in India, while the last Section sets out concluding remarks. II. Global Setting The global economic outlook is beset by geopolitical tensions, unsettled financial conditions, and stubborn inflation in major economies. Our model-based nowcast points to a decline in the momentum of global growth during Q1:2024 (Chart II.1). The global supply chain pressures index (GSCPI) witnessed a further uptick in February 2024, taking it above its historical average (Chart II.2a). The geopolitical risks index also rose to a 19-month high in February, mainly due to risks emerging from the increased scope, scale and sophistication of cyber attacks, tensions in the middle east driven by the ongoing war in Gaza, and the potential for escalation of US-China tensions over Taiwan (Chart II.2b).5 Container shipping costs have shot up due to ongoing hostilities in the Red Sea causing disruptions in a key global trade route and remained elevated in February, albeit sequential decline (Chart II.2c). Consumer sentiments dipped in the US and the UK, but improved in the euro area where employment expectations remained broadly stable. Financial conditions stayed tight across geographies as central banks modulated expectations of early policy easing (Chart II.3).
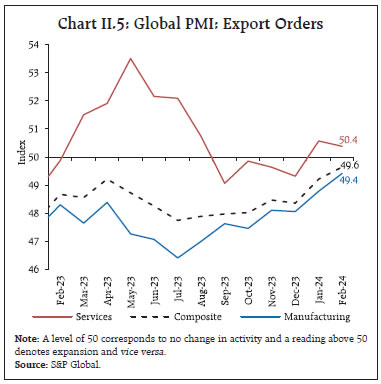
The global composite PMI increased to 52.1 in February 2024 - its highest reading since June 2023 - from 51.8 in January. All six sub-sectors covered by the survey − business services; consumer goods and services; financial services; intermediate goods; and investment goods − recorded output increases simultaneously for the first time since May 2023. The services PMI rose to a seven-month high of 52.4 in February, driven by faster rate of growth in business activity. The manufacturing PMI at 50.3 returned to expansionary zone in February driven by new orders, output and stocks of purchases, after a prolonged contraction for 18 months (Chart II.4). The composite PMI for export orders rose to 49.6 in February 2024, propelled by its manufacturing component reaching a 19-month high of 49.4. Meanwhile, the services export orders index moderated marginally to 50.4 in expansionary territory (Chart II.5). Global non-oil commodity prices moderated in February, driven by a fall in prices of agriculture products, especially grains, which led to the Bloomberg commodity price index declining by 1.9 per cent (m-o-m) [Chart II.6a]. Crude oil prices, however, increased by 2.2 per cent in February as OPEC+ members extended voluntary cuts to oil production to end-June 2024 although they were due to expire at end-March 2024 (Chart II.6b). The Food and Agriculture Organization’s (FAO’s) food price index declined by 0.7 per cent (m-o-m) in February, primarily driven by reduction in the prices of cereals (-5.0 per cent) and vegetable oils (-1.3 per cent). The index stood at 10.2 per cent below its corresponding value a year ago (Chart II.6c). Gold prices remained volatile in February and surged to a record high in March (Chart II.6d). 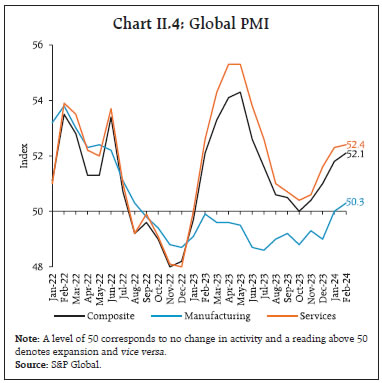
 Headline inflation continued its gradual moderation in major AEs, inching closer to targets in many countries. In the US, however, CPI inflation increased to 3.2 per cent in February 2024 from 3.1 per cent in January primarily due to increase in services inflation across motor insurance and health. The headline personal consumption expenditure (PCE) inflation declined to 2.4 per cent, its lowest in almost three years, in January 2024 from 2.6 per cent in December 2023. As per flash estimates, euro area inflation moderated to 2.6 per cent in February, down from 2.8 per cent in January (Chart II.7a). In the UK, CPI inflation remained steady at 4.0 per cent in January while Japan’s inflation (CPI excluding fresh food) softened to 2.0 per cent in January from 2.3 per cent in December. 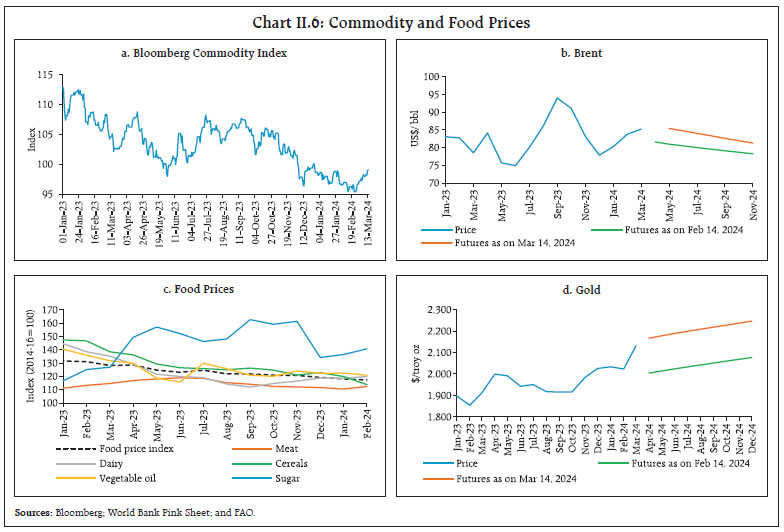 Among EMEs, inflation edged up in South Africa in January and in Russia in February while inflation in Brazil remained steady for the second consecutive month in February (Chart II.7b). In China, however, inflation increased to 0.7 per cent in February - its highest level in 11 months – from a deflation of 0.8 per cent in January due to robust spending during the lunar new year holiday. Core and services inflation moderated across major AEs but remained higher than headline inflation (Chart II.7c and II.7d). Global equity markets rallied in February, despite some dent in sentiments earlier in the month on hawkish commentary from systemic central banks. The MSCI world equity index increased by 4.2 per cent in February, reflecting gains in AEs (4.1 per cent) as earnings proved stronger than expected, including those of the ‘Magnificent 7’6 (Chart II.8a). The MSCI for EMEs increased by 4.6 per cent in February, with a strong rally in China, new regulations on short selling and surges in capital flows to EMEs. The US G-sec yields, both 10-year and 2-year hardened in February along with a widening of the spread by 7 bps (Chart II.8b). In the currency markets, the US dollar index strengthened by 0.9 per cent (m-o-m) in February. On the other hand, the MSCI currency index for EMEs remained relatively steady in February (Chart II.8c and II.8d). Across the globe, central banks remain cautious while treading the last leg of disinflation, especially in the AEs. Most AE central banks held their policy rates constant in their latest meetings (Chart II.9a). Several EME central banks, however, continued their easing path that started in late 2023 (Chart II.9b).
III. Domestic Developments The Indian economy recorded robust growth amidst external headwinds in the form of supply chain disruptions described earlier (Chart III.1a). Economic activity gained momentum in February 2024 after witnessing a slight moderation in January and GDP growth for Q4:2023-24 is nowcast at 7.2 per cent (Chart III.1b and III.1c). Looking ahead to the next year, projections from the in-house Dynamic Stochastic General Equilibrium (DSGE) model7 suggest that the GDP growth is likely to remain robust at 7.4 per cent during 2024-25.8 The CPI inflation is projected to average 4.4 per cent during 2024-25, lower than 5.4 per cent projected for 2023- 24 with most of the decline occurring in H1:2024-25 (Table III.1 and Chart III.2). Aggregate Demand The second advance estimates (SAE) of national income released by the NSO on February 29, 2024 placed India’s real GDP growth at 7.6 per cent in 2023-24 – an upward revision of 30 basis points (bps) from the first advance estimates (FAE). The revision largely emanates from an upward adjustment of 10 bps in gross fixed capital formation (GFCF) to 10.3 per cent, and the lower drag from net exports of 2.5 per cent of GDP in the SAE from 4.8 per cent of GDP in the FAE. | Table III.1: Baseline Projections | | (y-o-y in per cent) | | Periods | GDP Growth | CPI Inflation | | Q1:2024-25 | 8.1 | 4.7 | | Q2:2024-25 | 6.6 | 4.4 | | Q3:2024-25 | 8.0 | 4.3 | | Q4:2024-25 | 7.1 | 4.3 | | FY 2024-25 | 7.4 | 4.4 | During Q3:2023-24, real GDP growth accelerated to 8.4 per cent from 8.1 per cent in the preceding quarter and 4.3 per cent in Q3:2022-23. Led by a revival in rural consumption, private consumption growth inched up to 3.5 per cent during Q3:2023- 24. GFCF continued to register double digit growth (10.6 per cent), which was mirrored in its proximate indicators of steel consumption and capital goods production. Export growth remained subdued amidst weak global demand conditions. With import growth surpassing that of exports, the external sector dragged aggregate demand down by 1.2 percentage points in Q3:2023-24 (Chart III.3).
High frequency indicators point towards continued verve in domestic demand conditions in February 20249. E-way bills increased by 14.8 per cent in February 2024 (Chart III.4a). Toll collections increased by 15.1 per cent (y-o-y) [Chart III.4b].
Automobile sales increased by 24.3 per cent (y-o-y) February 2024, led by increase in two wheelers and passenger vehicle sales (Chart III.5a). While tractor exports recorded robust growth, domestic sales remained subdued (Chart III.5b). Vehicle registration recorded continued y-o-y growth in February (Chart III.5c). Average daily petroleum consumption increased by 2.1 per cent y-o-y, driven by sustained momentum in industrial and transport activity (Chart III.5d).
Retail sales growth (y-o-y) improved in January 2024 over December 2023, broadly driven by quick service restaurants, sports goods, personal care, jewellery, food and groceries, as per the latest business survey conducted by the Retailers Association of India (Chart III.6). Retail demand for consumer durables and electronics, however, remained subdued. As per the data available from the Centre for Monitoring of Indian Economy (CMIE), the all- India unemployment rate (UR) was at 8.0 per cent in February (Chart III.7a). The labour force participation rate (LFPR) and employment rate (ER) recorded marginal increases over the previous month (Chart III.7b).
Recently released periodic labour force survey (PLFS) data for the calendar year 202310 showed that labour market indicators recorded improvement across rural and urban areas. At the all India level, the LFPR11 increased to 59.8 per cent in 2023 from 56.1 per cent in 2022, the highest since the survey’s inception in 2017-18. Notably, female LFPR has risen to 41.3 per cent from 33.9 per cent last year. The worker population ratio (WPR) also improved to 58.0 in 2023 with significant improvement in the female WPR (from 32.8 in 2022 to 40.1 in 2023). The unemployment rate (UR) fell to 3.1 per cent in 2023 - its lowest in the PLFS series (Chart III.8a). In rural areas, the LFPR and WPR increased to 63.4 and 61.9, respectively, while the UR fell to of 2.4 per cent. The female LFPR in rural areas saw a significant increase to 47.3 per cent in 2023 from 37.5 per cent in 2022. In urban areas, the LFPR and WPR increased to 51.4 and 48.8, respectively, while UR decreased (Chart III.8b). The employment outlook in the organised sector, as polled by the PMIs for manufacturing and services, remained subdued in February 2024. While manufacturing employment remained in contraction for the second consecutive month, services employment moderated to an eleven-month low (Chart III.9).
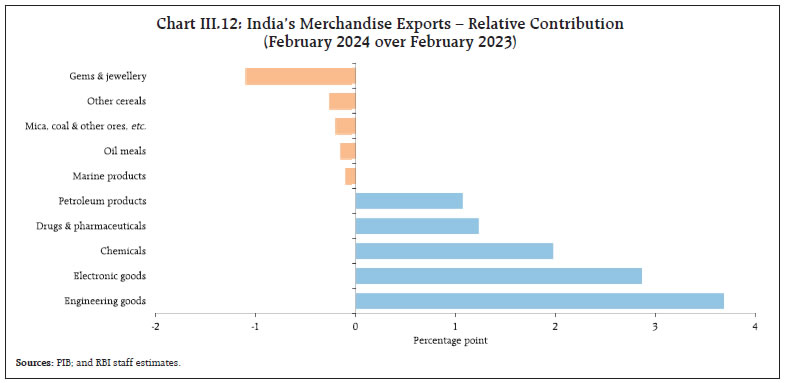
The work demanded under the Mahatma Gandhi National Rural Employment Guarantee Act (MGNREGA) witnessed an uptick of 0.3 per cent (m-o-m) in February, reflecting lower agricultural labour demand with the completion of rabi crop sowing (Chart III.10). India’s merchandise exports at US$ 41.4 billion, an eleven month high, grew by 11.9 per cent (y-o-y) for the third consecutive month in February 2024 as favourable momentum more than offset a negative base effect (Chart III.11). Out of 30 major commodities, 22 commodities (accounting for 83.2 per cent of the export basket) registered expansion on a y-o-y basis. Engineering goods, electronic goods, organic and inorganic chemicals, drugs and pharmaceuticals and petroleum products supported export growth, while gems and jewellery, other cereals, mica, coal and other ores, oil meals and marine products dragged down overall exports in February (Chart III.12). 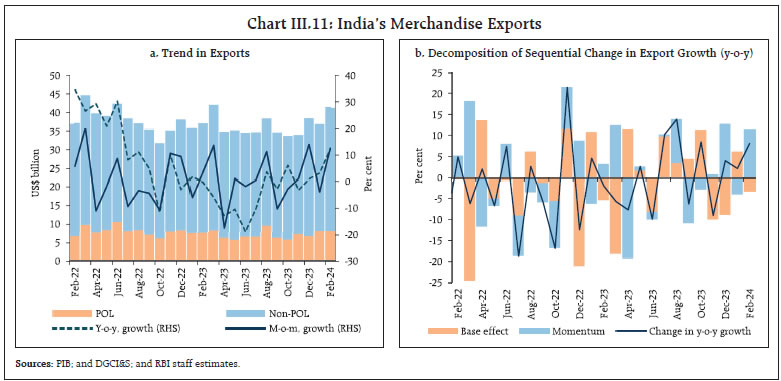
 Merchandise imports expanded for the second consecutive month and reached US$ 60.1 billion in February. Higher momentum in imports more than offset a negative base effect, leading to y-o-y growth of 12.2 per cent (Chart III.13). Among the 30 major commodities, 17 commodities (accounting for 77.4 per cent of the import basket) registered growth.
Gold, silver, electronic goods, machinery and metalliferous ores and other minerals supported import growth, while vegetable oil, pearls, precious and semi-precious stones, project goods, chemicals and fertilisers were the main drags on growth in February (Chart III.14). The merchandise trade deficit widened to US$ 18.7 billion in February from US$ 16.5 billion in January as annual and sequential growth in imports outpaced export growth. The share of the POL deficit in total merchandise trade deficit reached a 10-month high of 46.2 per cent in February (Chart III.15).
During April-February 2023-24, India’s merchandise exports at US$ 395.0 billion contracted by 3.5 per cent (y-o-y), while merchandise imports at US$ 620.2 billion declined by 5.3 per cent (y-o-y). Consequently, the merchandise trade deficit narrowed to US$ 225.2 billion during this period as compared with US$ 245.9 billion a year ago. Petroleum products were the largest source of the deficit, followed by electronic goods (Chart III.16). India signed a Trade and Economic Partnership Agreement (TEPA) with the European Free Trade Association (EFTA) on March 10, 2024.12 India runs a trade deficit with EFTA13 – goods worth US$ 16.7 billion were imported from this bloc while exports amounted to US$ 1.9 billion in 2022-23 (Chart III.17). Switzerland is the largest trading partner in EFTA, accounting for more than 90 per cent of India’s total imports (of which gold accounts for 80 per cent). Major imported commodities from EFTA include gold, petroleum gases, coal, soyabean oil, and pharmaceutical products, while major exports include organic chemicals, precious and semi-precious stones, ships, boats and floating structures, optical instruments, and nuclear reactors. The TEPA aims at FDI to the tune of US$ 100 billion in India from EFTA over the next 15 years and one million direct employment generation. 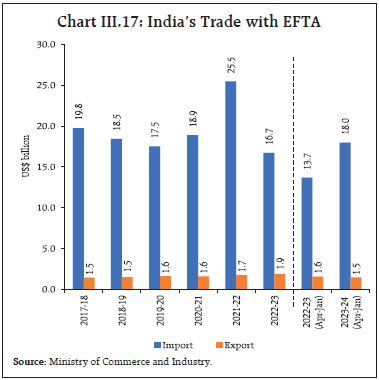 Services exports at US$ 31.0 billion registered a growth of 10.8 per cent (y-o-y) in January 2024, led by a rise in software services, travel services and business services exports. While services imports rose by 0.2 per cent (y-o-y) to US$ 14.8 billion, driven by an increase in software services and travel services imports (Chart III.18). Consequently, net services exports earnings rose by 22.8 per cent (y-o-y) to US$ 16.2 billion in January. During April-January 2023-24, the gross fiscal deficit (GFD) of the central government stood at 63.6 per cent of the revised estimates (RE), lower than 67.8 per cent of RE during the corresponding period of the previous year, on the back of modest revenue spending and buoyant direct tax revenues. On the expenditure side, capital spending recorded an increase of 26.5 per cent (y-o-y) while revenue expenditure growth remained contained at 1.4 per cent (y-o-y) [Chart III.19a]. Capital outlay (i.e., capital expenditure excluding loans and advances) recorded an increase of 25.8 per cent, resulting in a marked improvement in the quality of spending of the central government (Chart III.19b). 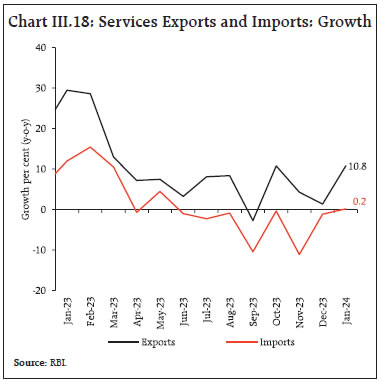 On the receipts side, direct tax collections grew by 23.5 per cent (y-o-y) during April-January 2023-24, with income tax and corporate tax collections growing at 27.3 per cent and 20.1 per cent, respectively, reflecting increased compliance, higher advance tax collections and widening of the tax base.14,15,16 Indirect tax collections grew by 4.7 per cent (y-o-y), with goods and services taxes (GST) and customs revenues growing at 9.0 per cent and 1.0 per cent, respectively. On the other hand, excise duties contracted by 6.0 per cent in April-January 2023-24 in relation to the corresponding period of the previous year. Overall, gross tax revenue grew by 14.5 per cent over the previous year, led by robust growth in direct tax collections (Chart III.20). Non-tax revenue collections grew by 46.4 per cent (y-o-y) during April-January 2023-24, mainly attributable to the higher than budgeted surplus transfer from the Reserve Bank of India (Chart III.21).17 On the other hand, non-debt capital receipts (comprising mainly of disinvestment receipts) contracted by 40.2 per cent.18 Overall, the total receipts of the central government expanded by 13.9 per cent (y-o-y).
The Union Government presented the second batch of supplementary demand for grants in February 2024 for 2023-24, involving an additional cash outgo of ₹78,673 crore (revenue expenditure of ₹77,429 crore and capital expenditure of ₹1,244 crore). However, this additional cash outgo is expected to be compensated by higher revenue collections, limiting its impact on the budgeted fiscal deficit. GST collections (Centre plus States) grew by 12.5 per cent (y-o-y) to ₹1.68 lakh crore in February 2024. The gross GST collection during April-February 2023-24 (₹18.4 lakh crore) was 11.7 per cent higher than during the corresponding period last year (Chart III.22). As per the data available for April-January 2023- 24, States’ GFD reached 67.5 per cent of their Budget Estimates (BEs), which is 14.6 percentage points higher than the corresponding period of the previous year (Chart III.23a). This increase was primarily driven by a slowdown in revenue receipts growth and an increase in capital expenditure (Chart III.23b). On the receipts front, States’ tax and non-tax revenues recorded growth of 13.2 per cent and 16.2 per cent, respectively. Grants from the Union government contracted following the cessation of GST compensation to states and the tapering of finance commission grants (Chart III.24a). 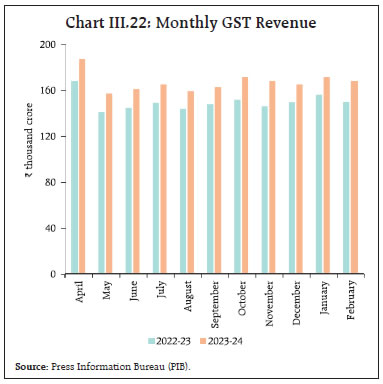
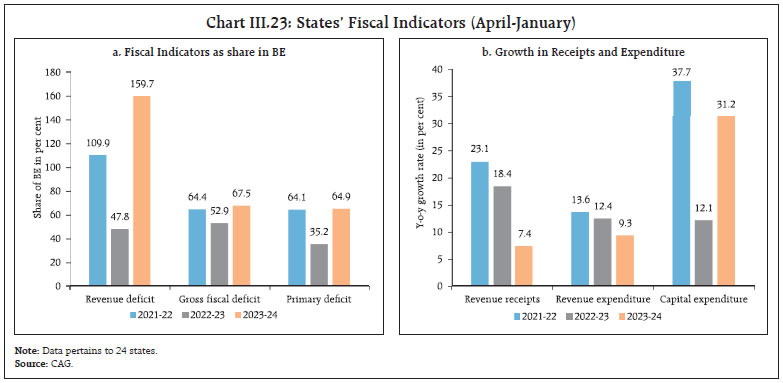 On the expenditure front, capital spending of states grew by 31.2 per cent (y-o-y), aided by the Scheme for Special Assistance to States for Capital Investment. Till January 2024, the Union government had sanctioned ₹1.11 lakh crore (of the ₹1.3 lakh crore allocated for 2023-24), of which ₹66,745 crore has already been disbursed to the states.19 The sustained capex push has improved the quality of expenditure of the states (Chart III.24b). Aggregate Supply Aggregate supply, as measured by gross value added (GVA) at basic prices, grew by 6.9 per cent in 2023-24 as per the SAE (same as in FAE). The growth was propelled by the industrial and services sectors, while agriculture recorded a moderate growth. On a quarterly basis, real GVA growth moderated to 6.5 per cent in Q3:2023-24 from 7.7 per cent in the preceding quarter (Chart III.25). The industrial sector sustained strong momentum to register double digit growth successively in Q2 and Q3 of 2023-24. The manufacturing sector remained the primary driver of industrial GVA growth in Q3:2023-24 with a steady growth of 11.6 per cent, aided by elevated profit margins of listed corporate manufacturing firms. Activity in mining and quarrying remained steady. The services sector recorded an acceleration, with broad-based resilience across sub-sectors. Construction activity grew by 9.5 per cent, aided by the government’s thrust on infrastructure and ebullient residential housing demand. Growth in trade, hotels, transport, communication, and services related to broadcasting, and financial, real estate and professional services recorded an improvement whereas public administration, defence, and other services moderated marginally. 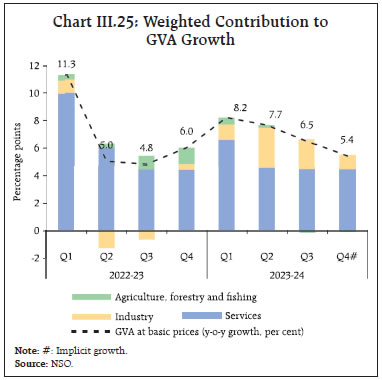 The SAE of the agricultural crop production placed total foodgrains production at 309.3 million tonnes in 2023-24, 1.3 per cent lower than the final estimates for 2022-23 due to decreases in both kharif and rabi crop production, by 1.0 per cent and 1.7 per cent, respectively. Wheat production, however, has been estimated at a record 112.0 million tonnes, which is 1.3 per cent higher than the final estimates of the previous year. Most other crops recorded a decline in production over the previous year (Chart III.26). As per the FAE, horticulture production is placed at 355.3 million tonnes during 2023-24, 0.1 per cent lower than the final estimates of 2022-23. In 2022-23, the production was 355.5 million tonnes, 2.4 per cent higher than in 2021-22 (Chart III.27).
As per the Indian Meteorological Department (IMD)’s latest outlook20, above-normal temperatures are likely over most parts of the country during March- May 2024.21 Extreme above-normal temperatures are less likely over the key wheat-growing states (except Rajasthan) in March, which augurs well for the standing wheat crop (Charts III.28). Prevailing El Nino conditions are also expected to weaken during the upcoming season and may turn neutral thereafter. As of March 14, 2024, the all-India reservoir level was 40 per cent of total reservoir capacity, lower than the previous year’s as well as decadal average levels (Chart III.29). Rice procurement under the Kharif marketing season (KMS) 2023-24 stood at 442.8 lakh tonnes as of March 14, 2024, 8 per cent lower than last year. Harvested wheat for the current season has started to arrive in the mandis of key producing states. Wheat procurement for the ensuing Rabi Marketing Season (RMS) 2024-25 is fixed in the range of 300-320 lakh tonnes. As of March 01, 2024, the stock of foodgrains with the Food Corporation of India (FCI) and other institutions remained at 7.6 times the buffer norm for rice and 0.7 times the norm for wheat.22 Wheat prices faced pressures during 2021-22 and 2022-23 triggered by heatwaves. Inflation in retail prices of wheat reached a high of 25.4 per cent in February 2023. Subsequently, aided by astute supply management policies of the Government such as the Open Market Sale Scheme for Wheat (OMSS-W), wheat prices inflation moderated significantly over the course of 2023-24 to reach 2 per cent in February 2024 (Box A). 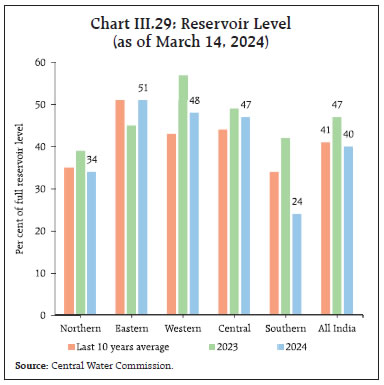
Box A: Open Market Sale Scheme for Wheat (OMSS-W): Impact on Prices Supply side responses to moderate price spikes have been instrumental in management of inflation during recent years. These measures include conducting OMSS-W, imposing export restrictions, applying stock limits on wheat traders and sales of Bharat brand atta23 (Chart A1). During 2023-24 (till February 28), the government conducted 36 weekly e-auctions. Out of the 101.5 lakh metric tonnes (LMT) wheat designated for offloading under the OMSS-W, 95 LMT was sold as on February 28, 2024.24 To study the impact of the announcement of OMSS on mandi prices, an event study was undertaken with the following specification: Further, the impact of actual offtake under the OMSS-W was examined using a Difference-in-Difference (DiD) approach. Using district level panel data on daily wheat retail prices for 2021-2023 covering districts in 13 states, the following equation was estimated to study the impact of OMSS-W e-auctions across districts:
| Table A1. Results of Event Study Analysis | | | Mandi Price of Wheat (modal) | Mandi Price of Wheat (maximum) | | OMSS for Wheat | -0.004**
(0.00) | -0.008***
(0.00) | | Constant | 7.763***
(0.00) | 7.826***
(0.00) | | State-District Fixed Effects | Yes | Yes | | No. of Observations | 10,328 | 10,317 | | R-squared | 0.630 | 0.703 | Notes: 1. Robust Standard errors (clustered at district level) are reported in parentheses.
2. *, **, *** represents 10 per cent, 5 per cent and 1 per cent level of significance.
3. Period before and after policy announcement is taken from May 1 to June 11, 2023 and June 12 to June 27, 2023, respectively. |
| Table A2: Results of Difference-in-Difference Analysis | | | Model 1 | | Retail Price of Wheat (2023 against average of 2021-2022) | | OMSS for Wheat × Treatment Year | -0.007***
(0.003) | | OMSS effect: Date FE$ | 0.005**
(0.003) | | Treatment effect: Year FE | 0.011***
(0.003) | | No. of Observations | 182,063 | | R-squared | 0.894 | | Fixed Effects | State × District, Week of the Year, Day of the Week, Bharat Atta# | Notes: 1. Robust Standard errors (clustered at district level) are reported in parentheses.
2. *, **, *** represents 10 per cent, 5 per cent and 1 per cent level of significance.
3. The period before and after the policy announcement is taken from March 1 to June 11, 2023 and June 12 to December 31, 2023, respectively.
$: Fixed Effects
# Bharat Attaid is a dummy variable taking value 1 for days after November 6, 2023 and 0 otherwise for each district i. | Reference: D Suganthi, G V Nadhanael and Biswajeet Mohanty (2024) “Impact of the Announcement and Implementation of OMSS on Wheat Prices”, Mimeo. |
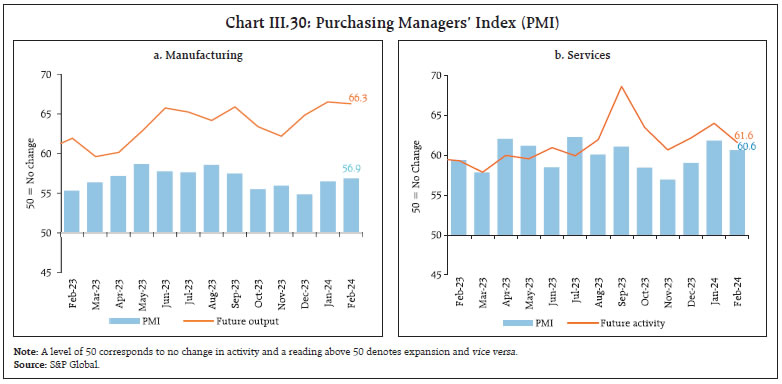 The headline PMI for the manufacturing sector reached a five-month high of 56.9 in February 2024 - up from 56.5 in January - supported by expansion in output and new orders (Chart III.30a). Services PMI at 60.6 continued to record robust expansion, albeit with a sequential moderation (Chart III.30b). Sales of listed private manufacturing companies recorded lower growth of 3.7 per cent (y-o-y) in nominal terms during Q3:2023-24 as against 4.2 per cent in the previous quarter, largely driven by moderation in food products, electrical products and cement and contraction in chemicals26 (Chart III.31a and b). From the income side, nominal gross value added growth of 14.5 per cent (y-o-y) in Q32023-24 was primarily driven by profits (Chart III.31c) – operating profits of manufacturing companies improved on both sequential and annual bases. Information technology (IT) sector’s sales continued to decelerate as the industry grappled with slower growth in AEs and the impact of disruptive technologies such as AI. IT companies’ revenue growth fell to 3.2 per cent (y-o-y) during Q3 as against 5.9 per cent in the previous quarter and 19.4 per cent a year ago. In contrast, sales of non-IT services companies remained on a high growth trajectory of 12.9 per cent, mainly led by ‘wholesale and retail trade’ and ‘transport and storage services’. Indicators of transport activity exhibited a mixed picture. Railway freight revenue recorded a y-o-y growth of 6.3 per cent in February 2024, driven by freight movement of iron ore and container services (Chart III.32a). Cargo traffic at major ports, however, declined by 1.1 per cent in February 2024 as POL and coal tonnage recorded a decline (Chart III.32b).
Among construction sector indicators steel consumption recorded an increase of by 5.1 per cent in February 2024 and cement production increased by 5.6 per cent in January 2024 (Chart III.33). Various high frequency indicators for the services sector recorded robust growth in February 2024 (Table III.2).
Inflation Headline inflation, as measured by y-o-y changes in the all-India consumer price index (CPI)27, remained unchanged at 5.1 per cent in February 2024 as a positive momentum of around 15 bps was fully offset by favourable base effects. The m-o-m increase was around 10 bps and 25 bps in food and core groups (i.e., excluding food and fuel), respectively, while the fuel group witnessed a negative momentum of around 10 bps (Chart III.34). Food inflation (y-o-y) edged up to 7.8 per cent in February from 7.6 per cent in January. In terms of sub-groups, higher inflation was recorded in meat and fish, eggs, vegetables, and sugar while cereals, milk, fruits, pulses, spices, non-alcoholic beverages and prepared meals registered a moderation in inflation. Edible oil prices remained in deflation (Chart III.35). The fuel and light group continued in deflation at (-) 0.8 per cent in February, deepening from (-) 0.6 per cent in January, mainly on account of a y-o-y decline in LPG and PDS kerosene prices by 13.3 per cent and 11.1 per cent, respectively. Electricity prices, however, recorded inflation of 10.4 per cent y-o-y. Core inflation continued to ease down to 3.4 per cent in February from 3.5 per cent in January- its lowest level in four years. The moderation was across all sub-groups (Chart III.36). In terms of regional distribution, inflation remained steady in rural areas at 5.3 per cent in February while in urban areas, it softened by 10 basis points to 4.8 per cent. Majority of the states registered inflation in the range of 4-6 per cent (Chart III.37).
High frequency food price data for March so far (up to 15th) show that cereal prices declined, mainly for wheat. While pulses prices registered a broad-based increase, edible oil prices continued to soften. Amongst key vegetables, tomato prices have corrected in March so far while onion and potato prices have recorded an upsurge after softening over the past three months (Chart III.38). Domestic sugar prices remained stable in February 2024 in contrast to rising international sugar prices (Chart III.39). In order to incentivise production, the Government of India has recently announced an 8.0 per cent increase in the fair and remunerative price (FRP) for sugarcane to ₹340 per quintal at sugar recovery rate of 10.25 per cent. The minimum price is fixed at ₹315.10 per quintal with a recovery rate of 9.5 per cent for the upcoming 2024-25 sugar season starting from October 2024. A cut in the petrol and diesel prices was announced on March 14, 2024 wherein retail selling prices of petrol and diesel were reduced by ₹2 per litre each. Further, LPG prices were cut by ₹100 per cylinder on March 9, 2024, while kerosene prices increased in March so far (Table III.3). The PMIs for February 2024 indicated the slowest increase in input costs in the manufacturing sector, and the third slowest increase in the services sector, since August 2020. Growth in selling prices also moderated across manufacturing and services sectors (Chart III.40).
| Table III.3: Petroleum Products Prices | | Item | Unit | Domestic Prices | Month-over- month (per cent) | | Mar-23 | Feb-24 | Mar-24^ | Feb-24 | Mar-24^ | | Petrol | ₹/litre | 102.92 | 102.92 | 102.79 | 0.0 | -0.1 | | Diesel | ₹/litre | 92.72 | 92.72 | 92.59 | 0.0 | -0.1 | | Kerosene (subsidised) | ₹/litre | 54.21 | 49.43 | 49.79 | -2.1 | 0.7 | | LPG (non-subsidised) | ₹/cylinder | 1113.25 | 913.25 | 813.25 | 0.0 | -10.9 | ^: For the period March 1-15, 2024.
Note: Other than kerosene, prices represent the average Indian Oil Corporation Limited (IOCL) prices in four major metros (Delhi, Kolkata, Mumbai and Chennai). For kerosene, prices denote the average of the subsidised prices in Kolkata, Mumbai and Chennai.
Sources: IOCL; Petroleum Planning and Analysis Cell (PPAC); and RBI staff estimates. |
The all India House Price Index (HPI)28 grew by 3.8 per cent (y-o-y) during Q3:2023-24 from 3.5 per cent in the previous quarter and 2.8 per cent a year ago. On a sequential basis, the HPI rose by 1.6 per cent, with six out of ten cities exhibiting an increase (Chart III.41). The recently released fact sheet on the household consumption expenditure for 2022-23 by the National Sample Survey Office (NSSO) shows that the consumption pattern of households has undergone significant changes over the last decade, with a fall in the share of food in overall consumption (Box B). 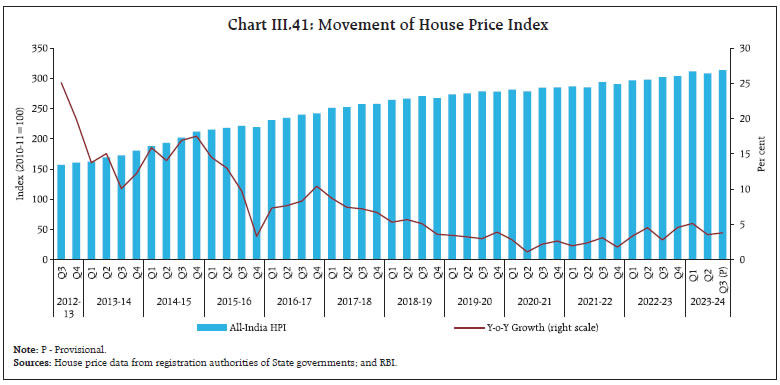
Box B: Key facts from the Household Consumption Expenditure Survey (HCES): 2022-23 The NSSO’s fact sheet based on the results of the HCES for 2022-23 provides valuable information on the expenditure pattern and standard of living of households in India, which would be the basis for the preparation of an updated weighting diagram for CPIs. Some of the key highlights emerging from the results are set out below. The share of food items in the monthly per capita consumption expenditure (MPCE) has declined from 52.9 per cent to 47.5 per cent in rural areas and from 42.6 per cent to 39.7 per cent in urban areas between 2011-12 and 2022-23, with cereals recording the most significant decline. Within food, however, there has been a rise in the share of high value food products such as fruits, milk and prepared meals (Chart B1a and B1b). Overall, the changes in consumption shares towards non-food items such as consumer services, durable goods, and conveyance point towards evolving household preferences as incomes rise. 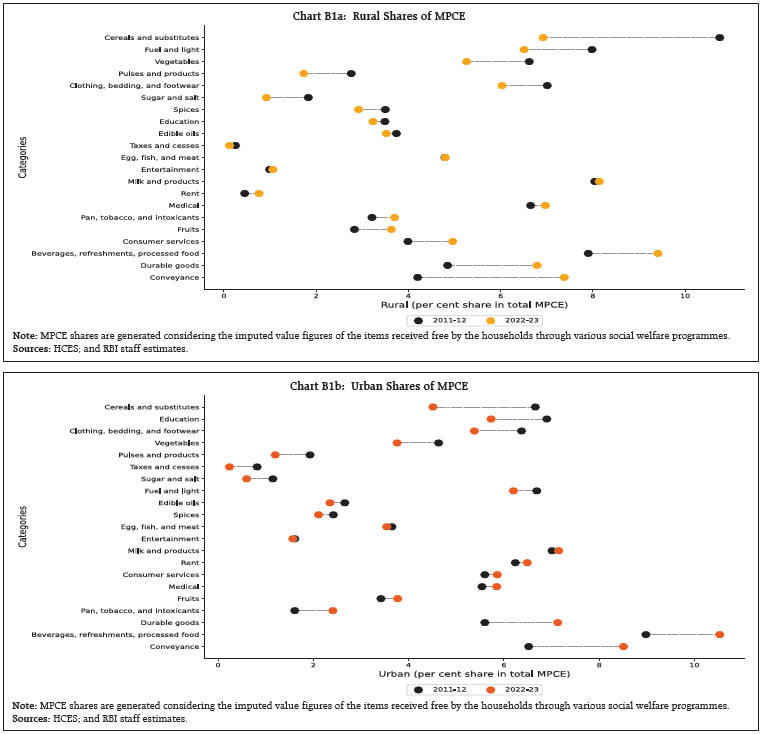
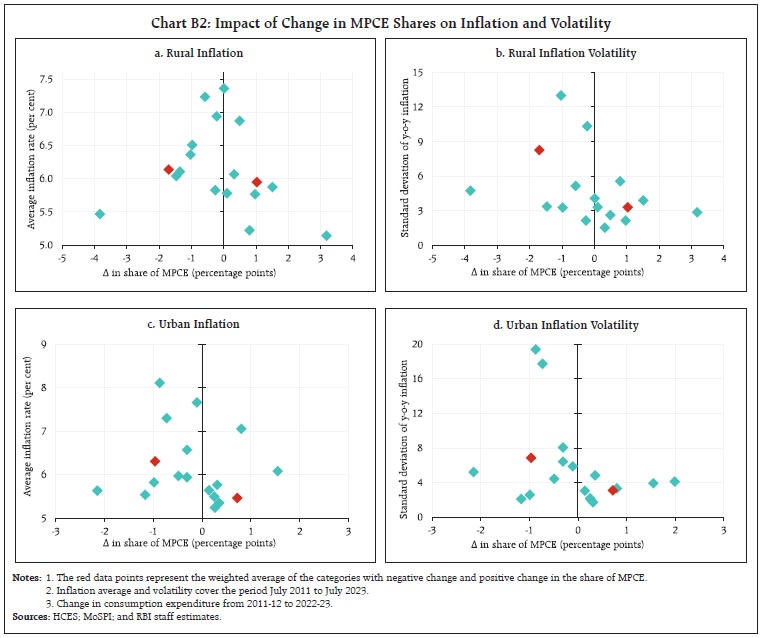 Since the shares of consumption form the weights for calculating CPI (the current CPI derives its weight from the 2011-12 HCES), these changes could impact the measurement of retail inflation. It is seen that in the rural areas, there is no significant difference in the average inflation of items whose shares have increased compared to those whose shares have declined. Items with an increased share, however, exhibit substantially lower volatility (Chart B2a and B2b). For urban areas, the average inflation for items with an increased share is lower (by about 70 basis points) than for those with a decreased share (Chart B2c). Similarly, for items that have witnessed an increase in share, volatility is also lower (Chart B2d). Overall, the share of items with relatively higher inflation as well as volatility has declined over the last decade. In recent years, household consumption has been augmented by the provision of goods and services through various welfare schemes of the government and the current round of the HCES survey captures their value29. The value of consumption of social welfare goods as a share of their overall consumption provides an indication of the extent to which household budgets are protected by the provision of social welfare goods. Rural households receive more protection (as a share of their budget). Also, less affluent classes receive a higher share of free welfare goods in both rural and urban areas (Chart B3). References: 1. MOS&PI (2024). Household Consumption Expenditure Survey (HCES): 2022-23 Fact Sheet. 2. G V Nadhanael, Subhadhra Sankaran, Shashi Kant, Shahbaaz Khan, Rajni Dahiya and Biswajeet Mohanty (2024). Household Consumption Expenditure Survey, 2022-23: A Deep Dive, Mimeo. | IV. Financial Conditions With government spending picking up towards the end of the financial year, there has been easing of liquidity conditions. The return-leg of a USD/INR sell buy swap auction for US$ 5 billion conducted by the Reserve Bank on March 8, 2022 also injected liquidity amounting to ₹42,800 crore on March 11, 2024. Reflecting these developments, the system liquidity turned into surplus with average daily net absorption under the liquidity adjustment facility (LAF) at ₹0.07 lakh crore during March 2024 so far (up to March 15) as compared with an average daily net injection of ₹1.91 lakh crore during February 16- 29 (Chart IV.1). Between February 16 and March 15, the Reserve Bank conducted one 13-day and one 15- day variable rate repo (VRR) main operation along with five fine-tuning VRR auctions of overnight to seven days maturity. 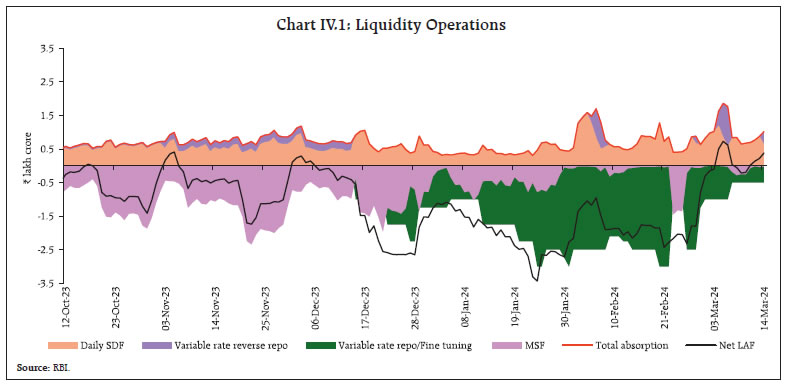 Borrowings under the marginal standing facility (MSF) also declined with improvement in liquidity conditions. Of the average total absorption at ₹0.88 lakh crore, placement of funds under the standing deposit facility (SDF) constituted 87.5 per cent while the remaining was mopped up through variable rate reverse repo (VRRR) operations. The Reserve Bank conducted eight fine tuning VRRR operations mainly at end-February and early March to absorb surplus liquidity. In view of banks’ likely preference for storing liquidity amidst deficit conditions in March, five of these operations were of overnight maturity. Reflecting liquidity developments, the weighted average call rate (WACR) – the operating target of monetary policy – exhibited a softening bias. The spread of the WACR over the policy repo rate came down to 7 bps during February 16 – March 15, 2024 from 20 bps during January 15 – February 15, 2024 (Chart IV.2a). In tandem, rates in the collateralised segment also softened. Across the term money segment, yields on 3-month certificates of deposit (CDs) and commercial paper (CP) for non-banking financial companies (NBFCs) stayed elevated, while that on 3-month treasury bills (T-bills) eased from its peak (Chart IV.2b). The average risk premia in the money market (3-month CP minus 91-day T-bill) remained high at 142 bps during February 16 – March 15, 2024. In the primary market, fund mobilisation through CD issuances surged to ₹7.89 lakh crore during the financial year so far (up to March 8), from ₹6.33 lakh crore a year ago. Banks resorted to borrowings through CD issuances to meet demand for credit. CP issuances remained largely steady at ₹12.2 lakh crore during the financial year so far (up to February 29) from ₹12.5 lakh crore in the corresponding period last year. The yields on government securities (G-sec) eased in tandem with US treasury yields coming off their peak. The yield on the Indian 10-year G-sec benchmark softened to 7.06 per cent on March 15 from 7.09 per cent on February 15 (Chart IV.3a). The yield curve shifted downward as yields declined across the term structure (Chart IV.3b).
Corporate bond yields and the associated risk premia exhibited mixed movements during February 16 – March 13, 2024 (Table IV.1). Corporate bond issuances during 2023-24 (up to February) were higher at ₹7.5 lakh crore as compared with ₹6.7 lakh crore a year ago. Easing long term yields and relative stability of the sovereign bond market amidst a healthy economic outlook have prompted investors to raise funds for investments through debt issuances. | Table IV.1: Financial Markets - Rates and Spread | | Instrument | Interest Rates (per cent) | Spread (basis points) (Over Corresponding Risk- free Rate) | | Jan 16, 2024 – Feb 15, 2024 | Feb 16, 2024 – Mar 13, 2024 | Variation | Jan 16, 2024 – Feb 15, 2024 | Feb 16, 2024 – Mar 13, 2024 | Variation | | 1 | 2 | 3 | (4 = 3-2) | 5 | 6 | (7 = 6-5) | | Corporate Bonds | | | | | | | | (i) AAA (1-year) | 8.01 | 8.03 | 2 | 76 | 80 | 4 | | (ii) AAA (3-year) | 8.00 | 7.96 | -4 | 84 | 78 | -6 | | (iii) AAA (5-year) | 7.81 | 7.83 | 2 | 63 | 64 | 1 | | (iv) AA (3-year) | 8.61 | 8.55 | -6 | 145 | 137 | -8 | | (v) BBB- (3-year) | 12.26 | 12.19 | -7 | 510 | 501 | -9 | Note: Yields and spreads are computed as monthly averages.
Sources: FIMMDA; and Bloomberg. | Reserve money (RM), excluding the first-round impact of change in the cash reserve ratio (CRR), recorded a growth of 5.5 per cent (y-o-y) as on March 8, 2024 (10.8 per cent a year ago) [Chart IV.4]. Growth in currency in circulation (CiC), the largest component of RM, decelerated to 3.5 per cent from 8.3 per cent a year ago, reflecting the withdrawal of ₹2000 banknotes.30
Money supply (M3) rose by 10.9 per cent (y-o-y) as on February 23, 2024 (9.5 per cent a year ago).31 Aggregate deposits with banks, the largest component of M3, increased by 11.9 per cent (9.7 per cent a year ago). Scheduled commercial banks’ (SCBs’) credit growth stood at 16.5 per cent as on February 23, 2024 (15.5 per cent a year ago) [Chart IV.5]. SCBs’ deposit growth (excluding the impact of the merger) remained in double digits in February 2024 (Chart IV.6).
As on February 23, 2024, the incremental credit-deposit ratio stood at 96.9 per cent, indicating that the deposits have been able to fund credit demand at the margin (Chart IV.7). With the statutory requirements for CRR and SLR at 4.5 per cent and 18 per cent, respectively, around 77 per cent of deposits were available with the banking system for credit expansion as on February 23, 2024. The deposit base was supplemented by CDs issuances (Chart IV.8). Bank credit to the agriculture sector continued to register double digit growth, reaching its highest level since the Covid-19 pandemic during Q3:2023- 24. Bank credit to industry also witnessed a pick-up to record a five-quarter high. Bank credit to housing sector continued to grow in double digits, albeit with some sequential moderation. The growth in non-housing personal loans, which peaked at 27.2 per cent in Q2:2022-23, declined to 19.8 per cent in Q3:2023-24 (Chart IV.9). Bank credit to the private corporate sector, which accounted for nearly a quarter of the total bank credit, recorded a sharp acceleration in the second and third quarters of 2023-24 (Chart IV.10). Working capital loan growth, however, recorded some deceleration (Chart IV.11).
In response to the cumulative increase of 250 basis points (bps) in policy repo rate since May 2022, the 1-year median marginal cost of funds-based lending rate (MCLR) increased by 169 bps during May 2022 to February 2024. Consequently, the weighted average lending rate (WALR) on fresh rupee loans increased by 194 bps and that on outstanding rupee loans rose by 113 bps during May 2022 to January 2024. The weighted average domestic term deposit rate (WADTDR) on fresh and outstanding deposits increased by 240 bps and 181 bps, respectively, during the same period (Table IV.2). The pass-through to WALRs on fresh rupee loans during May 2022 – January 2024 was higher for public sector banks (PSBs) than for private banks (PVBs), while the transmission to WALRs on outstanding rupee loans was higher for private banks. In case of term deposits, PSBs have increased their deposit rates relatively more than PVBs (Chart IV.12). Reflecting the pass-through of policy rate increases, the share of bank loans bearing over 8.0 per cent interest rates increased from 47.2 per cent in March 2022 to 78.9 per cent in March 2023 and further to 83.7 per cent in December 2023 (Chart IV.13). | Table IV.2: Transmission from the Repo Rate to Banks’ Deposit and Lending Rates | | (Variation in basis points) | | Period | Repo Rate (bps) | Term Deposit Rates (bps) | Lending Rates (bps) | | WADTDR - Fresh Deposits | WADTDR- Outstanding Deposits | EBLR | 1-Yr. MCLR (Median) | WALR - Fresh Rupee Loans | WALR- Outstanding Rupee Loans | | Retail and Bulk Deposits | | Easing Phase Feb 2019 to Mar 2022 | -250 | -259 | -188 | -250 | -155 | -232 | -150 | | Tightening Period May 2022 to Jan 2024 | +250 | 240 | 181 | 250* | 169* | 194 | 113 | Note: Data on 1-year MCLR are up to February 2024.
Source: RBI. |
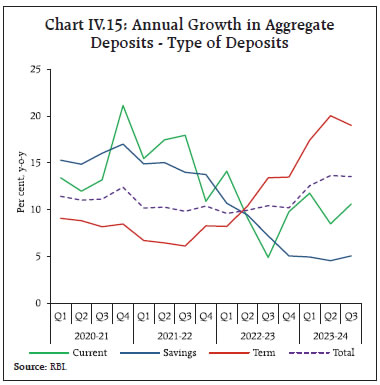
The share of term deposits offering 7 per cent and above interest rates has also increased to 61.4 per cent in December 2023 from 33.5 per cent in March 2023 and 4.5 per cent in March 2022 (Chart IV.14). This has increased the relative attractiveness of term deposits vis-à-vis savings deposits (Chart IV.15). After remaining volatile in the first half of February 2024, Indian equity markets registered gains. Overall, the benchmark increased by 1,345 points (1.9 per cent) since end-January to close at 73,097 on March 14, 2024 (Chart IV.16). Markets were buoyed by positive cues from global markets as well as strong domestic GDP data for Q3:2023-24. The broader market indices, however, declined with the BSE Midcap index and BSE Smallcap index retreating by 0.8 per cent and 8.3 per cent, respectively during February-March 2024 so far. Total net mobilisation by open-ended equity oriented mutual fund schemes rose by 23.3 per cent m-o-m to ₹26,866 crore in February 2024. However, flows into small-cap and mid-cap schemes moderated, declining by 11 per cent m-o-m to ₹4,731 crore. 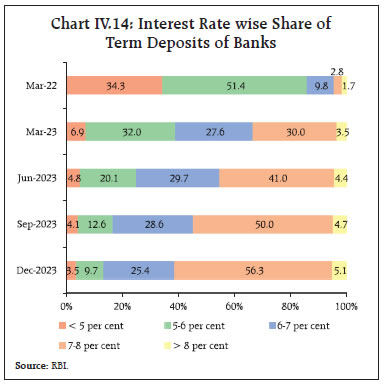
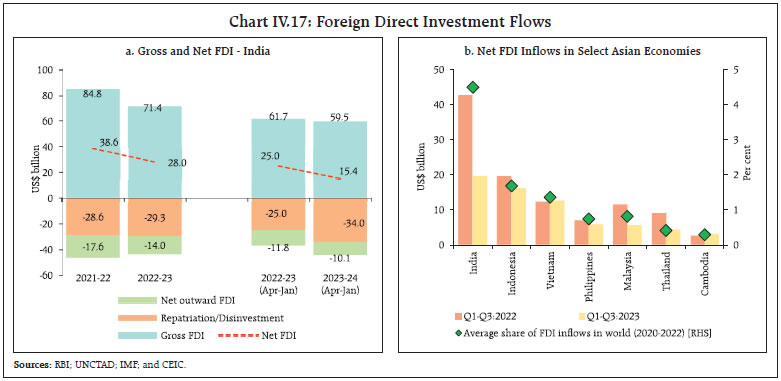
 Gross inward foreign direct investment (FDI) declined by 3.6 per cent to US$ 59.5 billion during April 2023 – January 2024 as compared with US$ 61.7 billion during the corresponding period a year ago (Chart IV.17a). Manufacturing, computer services, electricity and other energy sectors, financial services and transport accounted for about two-thirds of the FDI equity inflows during the same period. Around 80 per cent of the equity flows were received from Singapore, Mauritius, the US, the Netherlands, Japan and the UAE. Net FDI moderated to US$ 15.4 billion during April 2023 - January 2024 from US$ 25.0 billion a year ago, mainly due to a rise in repatriation. Despite global FDI flows remaining weak in 202332 with only a modest increase of 3 per cent over 2022, India fared better than Asian peers (Chart IV.17b). 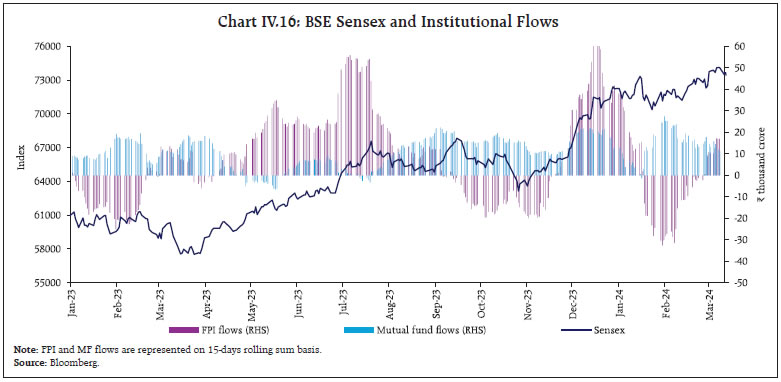
 Foreign portfolio investment (FPI) flows to India turned positive in February 2024, propelled by the robust domestic growth outlook. Net FPI inflows were of the tune of US$ 3.8 billion in February 2024, primarily led by the debt segment which brought in US$ 3.3 billion in February 2024, the highest since April 2019 (Chart IV.18a). Within equity, consumer services, automobile and auto components, healthcare, and capital goods were the leading FPI recipient sectors during February 2024 (Chart IV.18b). Net FPI flows were to the tune of US$ 5.6 billion during March 2024 (up to 14th). During 2023-24 so far (April 01- March 14), net FPI inflows amounted to US$ 40.5 billion, the highest since 2015-16. India received the highest equity inflows among emerging market peers during the current financial year (April-February). 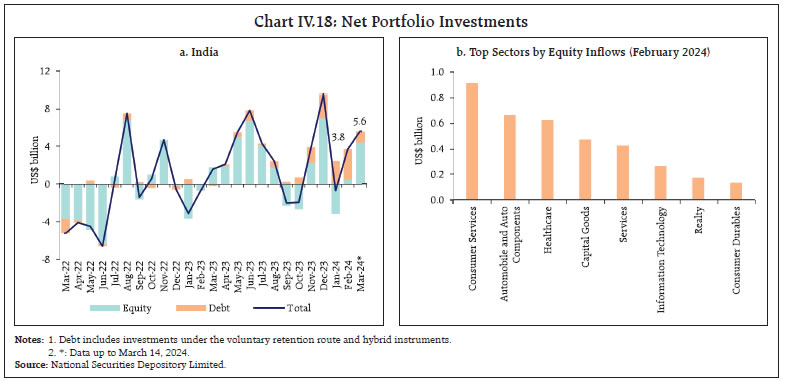
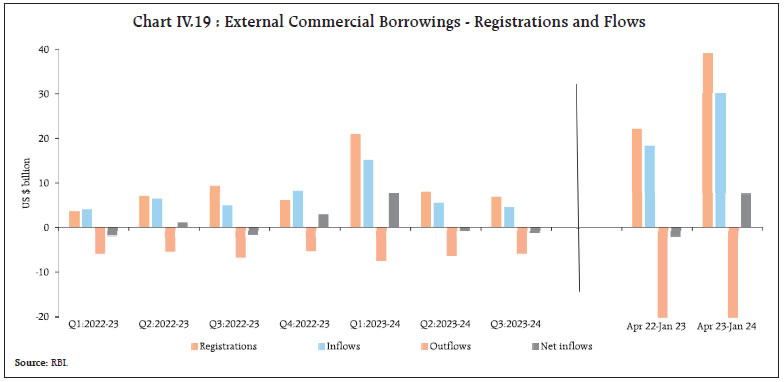 The total net accretions to non-resident deposits rose to US$ 10.2 billion during April 2023 – January 2024 from US$ 6.0 billion a year ago with net accretions in all accounts, viz., Foreign Currency Non-Resident [FCNR(B)] accounts, Non-Resident (External) Rupee Accounts [NR(E)A] and Non-Resident Ordinary (NRO) accounts. On a cumulative basis, external commercial borrowing (ECB) registrations (US$ 39.2 billion) and disbursements (US$ 30.1 billion) during April 2023 – January 2024 were higher than in the corresponding period last year. On the other hand, ECB outflows on account of principal repayment stood at US$ 22.6 billion during this period, resulting in net inflows of US$ 7.5 billion as against net outflows of US$ 1.9 billion a year ago (Chart IV.19). Out of the total ECBs registered during April 2023 – January 2024, more than three-fourths of the agreements were earmarked for capital expenditure (capex) purposes (including on-lending and sub-lending for capex) [Chart IV.20]. The weighted average maturity of fresh ECBs in this financial year so far was 5.5 years (5.8 years in the corresponding period last year). While the overall cost of ECBs has risen over the last two years primarily due to a rise in global benchmark interest rates such as secured overnight financing rate (SOFR)33, the weighted average interest margin (WAIM) (over the benchmark rates) declined to 155 bps during April 2023 – January 2024 from 173 bps during the corresponding period a year ago (Chart IV.21).
India’s foreign exchange reserves stood at US$ 636.1 billion on March 8, 2024 covering 10.9 months of imports projected for 2023-24 and more than 100 per cent of total external debt outstanding at end- September 2023 (Chart IV.22a). During the current financial year so far, India’s foreign exchange reserves increased by US$ 57.6 billion, which is the second highest among major foreign exchange reserves holding countries (Chart IV.22b).
The Indian rupee (INR) appreciated by 0.2 per cent (m-o-m) vis-à-vis the US dollar in February 2024 while other major currencies experienced depreciating pressures. Furthermore, the INR was one of the least volatile major currencies during February 2024 (Chart IV.23). The INR appreciated by 1.0 per cent (m-o-m) in terms of the 40-currency real effective exchange rate (REER) in February 2024 as appreciation of the INR in nominal effective terms more than offset negative relative price differentials (Chart IV.24). Payment Systems Digital transactions across major payment modes maintained strong expansion (y-o-y) in February 2024 (Table IV.3). Notably, the National Electronic Funds Transfer (NEFT) achieved a milestone on February 29, 2024, processing a record 4.1 crore transactions in a single day. Over the past decade (2013-14 to 2022-23), NEFT and Real Time Gross Settlement (RTGS) have registered robust growth of 700 per cent and 200 per cent, respectively, in terms of volume and 670 per cent and 104 per cent, respectively, in terms of value. The Unified Payments Interface (UPI), registered the highest volume growth among all modes in the month, adding 6.65 crore new users between March 2023 and January 2024.34 Furthermore, to enhance cross-border payments and streamline remittances from Greece to India using UPI rails, the National Payments Corporation of India (NPCI) International Payments Limited [NIPL] has partnered with Eurobank SA, a leading bank in Greece.35 The Bharat Bill Payment System (BBPS), an integrated and interoperable bill payment system, has registered an uptick in value terms owing to increased adoption by businesses and consumers for utility bill payments and higher-value transactions. In order to enhance efficiency of the system, enable greater participation, and enhance customer protection, revisions have been made to the BBPS framework to enable non-bank payment aggregators (PAs) to participate in the system as operating units, effective from April 1, 2024. Additionally, the Reserve Bank has authorised bank and non-bank issuers to issue prepaid payment instruments (PPIs) for payments across various public transport systems to provide convenience, speed, affordability, and safety in digital payment options. In the credit/debit card segment, a series of amendments have been issued in the master directions to strengthen the regulations including billing cycle flexibility, co-branding arrangements between banks and NBFCs, allowing other form-factors36 in addition to plastic cards, adherence to procedures regarding default reporting and restriction on outsourcing card data.37 On the innovation front, the Reserve Bank has updated the enabling framework for the regulatory sandbox, which includes revised timelines for various stages and requires entities to comply with provisions of the Digital Personal Data Protection Act, 2023. 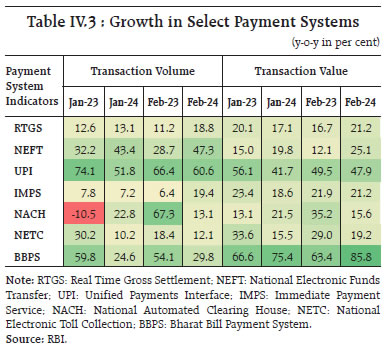 V. Conclusion The world is confronted with large shifts in structure and sentiments, which are either underway or impending. The outlook is shrouded with layers of uncertainty, exacerbated by geopolitical and extreme weather risks as well as fragmenting forces. By contrast, the Indian economy is experiencing a conducive macroeconomic configuration that can be its launching pad for a step-up in its growth trajectory. Over the period 2021-24, growth has averaged above 8 per cent; and the underlying fundamentals indicate that this can be sustained and even built upon. Inflation is on the ebb; the steady decline in core inflation would have taken down headline inflation towards the target of 4 per cent even sooner and faster, but for the repetitive incidence of short amplitude food price pressures. The CPI readings for January and February 2024 show that the winter easing of vegetable prices turned out to be shallow and short-lived. Cereal prices maintained strong momentum, and prices of meat and fish have registered a surge. Food price pressures on the headline have been capped by core disinflation to among its lowest prints in the series. The softening of core inflation has been broad-based. Fuel prices remain in deflation and this may get pronounced in March due to the reduction in price of liquified petroleum gas (LPG). Overall, headline inflation’s momentum turned positive in February 2024, offsetting a favourable base effect. Accordingly, monetary policy has to remain in a risk-minimisation mode, guiding inflation towards the target while sustaining the momentum of growth. Other indicators also point to abiding macroeconomic and financial stability. The current account deficit is modest, external buffers are resilient and fiscal consolidation is into its third consecutive year even as corporations are deleveraging and improving their debt servicing capacity. Balance sheets in the financial sector are sound and healthy, providing the wherewithal for intermediating the productive credit needs of a resurgent economy. Financial markets are reflecting these favourable formations. Capital inflows have resumed strongly as investor interest floods back into India. Technology is offering new growth opportunities to seize by becoming more competitive and efficient. The time has come to build world class infrastructure, strong manufacturing bases, a high-quality labour force and global leadership in services to convert these favourable factors into opportunities and strengths over the next few decades.
|