9.1 A well-functioning financial sector facilitates efficient intermediation of financial resources. The more efficient a financial system is in resource generation and in its allocation, the greater is its contribution to economic growth (Mohan, 2005). An efficient system of financial intermediation also contributes to the risk mitigation process in the economy. For instance, enhanced efficiency in banking can result in greater and more appropriate innovations, improved profitability as well as greater safety and soundness when the improvement in productivity is channelled towards strengthening capital buffers that absorb risk (Casu, Giraradone and Molyneux, 2002). Moreover, efficiency or productivity measures could act as leading indicators for evolving strengths or weaknesses of the banking system and could enable pre-emptive steps by the regulator when necessary. Therefore, investigation and measurement of efficiency and productivity in the banking sector have always been areas of interest for economic research.
9.2 It has been empirically found that banks receiving high efficiency scores are much more likely to survive than banks which have relatively low scores (Barr and Siems, 1996). Another study has validated the relevance of regular cost efficiency screening for early warning signals of managerial problems in commercial banks. This study confirms a negative and significant relation between cost efficiency and the risk of a bank failure (Podpiera and Podpiera, 2005). The assessment of efficiency and productivity of banking, thus, assumes high importance.
9.3 Several factors have been found to be associated with efficiency and productivity of financial intermediaries. While specific factors may vary across countries, a policy environment facilitating tapping of economies of scale, diversification of activities and introduction of state of the art technologies have generally been the driving force behind higher efficiency and productivity levels. These factors, therefore, have been engaging the attention of policymakers all over the world.
9.4 One of the major objectives of banking sector reforms in India was to promote flexibility, operational autonomy and competition in the system and to raise the banking standards in India to the international best practices (Reddy, 2002). In order to achieve these objectives, several measures have been initiated since the early 1990s. As a result of these measures, together with technological developments, the operating environment for banks in India has changed significantly. The Indian banking system has been exposed to increased competition with the enhanced presence of foreign banks and entry of new private sector banks. Most of the public sector banks have accessed the capital market. This has changed their capital structure, besides subjecting them to market discipline, as alluded to in the previous chapter. The administered interest rate structure has been almost deregulated. Statutory pre-emptions in the form of CRR and SLR have been reduced significantly. Banks have also been allowed to diversify into non-traditional activities. Banks were provided with operational flexibility and functional autonomy in their day-to-day decision making process to enable them to respond to the evolving situation. Banks have also been subjected to prudential norms in line with the international best practices. In the past, a large amount of banks’ funds was locked in non-performing assets. Multi-pronged institutional arrangements were put in place to enable banks to expeditiously recover their past dues. Advances in information and communication technology have enabled banks to introduce new products and delivery channels, and strengthen their internal control systems. All these changes are expected to have altered the way banks combine inputs to produce and deliver their products and services having a bearing on their efficiency and productivity.
9.5 In the above backdrop, this chapter assesses efficiency, productivity and soundness of the banking sector in India. The focus of the chapter is to assess whether efficiency and productivity of the banking sector have improved in the post-reform period; and if so, to what extent. The productivity and efficiency of the Indian banking sector are also compared with banks in other countries, especially emerging market economies (EMEs). Efficiency has also been tested along three different dimensions, viz., ownership (public versus private), size (small versus large) and activity (specialisation versus diversification).
9.6 The chapter has been organised in eight sections. Section II sets out some conceptual issues relating to the measurement of efficiency and productivity. Section III assesses productivity and efficiency of the banking sector as well as bank group-wise, based on accounting measures or financial ratios. A comparison has also been made with other countries, wherever possible. The factors affecting the net interest margin (NIM), the main source of income for banks, have also been analysed. Section IV undertakes the measurement of productivity and efficiency in terms of economic measures and attempts to ascertain the determinants of efficiency for the Indian banking sector as a whole as well as bank group-wise. The relationship between efficiency on the one hand, and ownership, size and diversification on the other is also analysed in this section. Section V assesses the soundness of the banking sector in terms of capital to risk-weighted asset ratio (CRAR) and asset quality. It also attempts to establish the relationship between efficiency and soundness. Section VI explains the factors that have led to improvement in efficiency over the years. As a way forward, Section VII delineates the issues that need to be addressed for further improving the efficiency, productivity and soundness of the banking sector. Section VIII sums up the main points emerging from the analysis.
II. MEASUREMENT OF PRODUCTIVITY AND EFFICIENCY – SOME CONCEPTUAL ISSUES
9.7 Productivity is construed as the ability and willingness of an economic unit to produce maximum possible output with given inputs and technology (Kalirajan and Chand, 1994). Higher the output per unit of input, higher is the productivity. Efficiency, on the other hand, measures performance of the bank in a normative sense by comparing it with the industry leader within or across the borders. Though, in general, it is expected that there would be a co-movement in productivity and efficiency, score of a bank in terms of these two measures may actually diverge. While, a bank may improve in terms of productivity over a period, its efficiency score may decline if rise in its productivity is slower than that of the industry’s best performer (Box IX.1).
9.8 Unlike the case of a typical firm in an economic textbook, the bank does not produce a definite product or output – rather it is a multi-product producing unit. Therefore, the usual yardsticks to measure the productivity of a typical manufacturing firm cannot be readily implemented in the case of banks. Specific methods that are required to measure productivity and efficiency of banking units are broadly of two types, viz., accounting measures and economic measures. Accounting measures refer to various financial ratios that focus on one or more outputs and their relevant inputs to measure the performance or productivity of a banking unit. Efficiency, being a normative concept, could be measured by comparing the bank’s performance as evaluated using these ratios against the best practices within or outside the country.
Box IX.1 Productivity and Efficiency – A Fine Distinction
The standard measures of productivity, better known as accounting measures, involve calculation of output per unit change in a single input assuming that other variable factors, technology and institutions remain unchanged (average productivity). Business per employee, profit per employee, ratio of operating costs to average assets or ratio of operating income to staff expenses are often used as traditional measures of productivity in the banking sector. Under these standard concepts of productivity change, the fine distinction between efficiency and productivity is blurred. However, the development of aggregate measures of productivity such as total factor productivity (TFP) enabled disaggregation of output change into two major components, namely, output change due to change in efficiency and output change attributable to change in technology. While a change in efficiency measures the increment in output without a rise in input or the amount by which inputs may be reduced without reducing the output, a change in technology represents the change in output that may be attributed to innovations (technical progress), shocks (financial crisis), changes in market structure (high concentration due to M&As) and regulatory policies (financial deregulation). More technically, a change in efficiency is a movement along the production function (catching up or falling behind), while a change in technology is a shift in the production function (See Appendix IX.1). In other words, the concept of efficiency relates to how well a bank employs its resources relative to existing production possibilities frontier. Hence, the analysis of banking efficiency relies on intra-sector comparisons, involves both technological and relative pricing aspects and has partial indicator value for analysing productivity performance. The concept of productivity, on the other hand, refers to the performance of the sector as a whole and effectively combines changes in efficiency and technological advances in an average measure (Oster and Antioch, 1995).
Reference:
Oster, A. and L. Antioch. 1995. “Measuring Productivity in the Australian Banking Sector.” Reserve Bank of Australia.
9.9 In the case of accounting measures, various ratios are computed and each of them refers to a particular aspect of bank activity. Since the banking industry uses multiple inputs to produce multiple outputs, a precise inference may not always be possible. In order to overcome this limitation, alternative techniques are employed to compute total factor productivity of a banking unit, which captures all aspects of banking operations in a single measure. These techniques, which are commonly referred to as ‘economic measures’ are broadly of two types –parametric regression based on production function specification and alternatively, the non-parametric approach (Appendix IX.1).
9.10 There is a large body of literature on the subject which throws light on alternative methods of assessing efficiency and productivity of the banking sector (Box IX.2).
III. MEASUREMENT OF PRODUCTIVITY ANDEFFICIENCY OF THE BANKING SECTOR IN INDIA – ACCOUNTING MEASURES
9.11 In this chapter, productivity and efficiency of the banking sector in India have been measured using both accounting measures and economic measures. While accounting measures enable a disaggregated and incisive analysis of bank’s performance in terms of individual parameters determining the overall efficiency level, economic measures provide a composite and precise estimate of efficiency and productivity by comparing each bank against the best performer in the industry. In this section, productivity and efficiency have been assessed using accounting measures, while the assessment based on the economic measures is attempted in the next section. 9.12 Intermediation cost, interest spread, operating expenditure, cost to income ratio, return on assets, return on equity, business per employee, income per employee and business per branch, among others, are some of the commonly used accounting measures for assessing the efficiency and productivity of a banking unit. Although each of the ratios is indicative of the productivity/efficiency and reflects on certain aspect/s of a bank’s functioning, it needs to be juxtaposed with other ratios to derive an insight into the performance of a banking unit (Box IX.3).
Operating Costs to Total Assets
9.13 This ratio indicates the amount of operating costs expended per unit of assets. All efforts by a bank to cut cost by rationalising its labour force and branches and back office operations should get reflected in this ratio. Larger the ratio, the lower is the efficiency. This ratio is also used to represent the intermediation cost of banking system by some researchers. The logic for such usage lies in the fact that ultimately, the banks use these operating costs to generate assets (i.e., loans) from their available funds (i.e., deposits). A reduction in operating costs is expected to ultimately result in reduction in lending rates and also net interest margins, thereby facilitating greater credit offtake, and hence, economic growth (Bhide, Prasad and Ghosh, 2002). In terms of the Basel II norms, banks should have cost to asset ratio of about one per cent (Ghosh, C.R et al, 2004).
9.14 There has been a gradual and almost sustained decline in the cost-asset ratio for the Indian banking industry as a whole from the peak level of 2.93 per cent in 1995-96 to 1.91 per cent in 2006-07. However, the trend varied across the bank groups. The cost-asset ratio of new private sector banks, which declined sharply between 1997-98 and 2001-02, increased gradually from 2002-03 onwards. However, the ratio for all other bank groups, which generally increased in the 1990s, declined in the 2000s. For the entire period, i.e., between 1991-92 and 2006-07, while the ratio for public sector banks and old private sector banks declined, it increased in respect of foreign banks and new private banks (Table 9.1).
9.15 The sharp decline in the operating cost to total assets ratio of public sector banks in 2001-02 was on account of rationalisation of the workforce. State Bank of India and nationalised banks introduced voluntary retirement schemes during 2000-01, which had a major bearing on the cost-asset ratio for public sector banks in 2001-02. The sharp decline in operating expenses during 2006-07 may be explained in terms of a lower increase in wage bill as compared with the previous years as banks in recent years have tended to outsource many routine activities. Increase in the ratio in the case of new private sector banks that began in the late 1990s reflects expansion of branch network and spending on technological up-gradation and creation of infrastructure. New private sector and foreign banks have invested large amounts on technology up-gradation, which has had the salutary effect of leveraging technology to provide better consumer support and to manage assets in the long-run (D’Souza, 2002), though operating costs did increase in the short term. This is substantiated by steadily increasing non-labour cost to earning assets ratio in the case of foreign banks, much above the industry levels. Further, foreign banks have been attracting the best talents in the industry with lucrative salaries and perks. They have invested a good amount of resources on training and human resource management strategies to retain their workforce, which has raised their labour costs, as explained subsequently.
Box IX.2 Productivity and Efficiency: Cross-country Empirical Evidence
Initially, efficiency studies were confined to detection of scale (size) and scope economies (product mix) under the implicit assumption that banks are technically and allocatively efficient (Berger and Humphrey; 1997). However, with banking structure undergoing overwhelming changes in the event of financial globalisation and evolution of new products, a broad consensus evolved that differences in technical efficiency cannot be attributed completely to incorrect scale and scope of output (Berger and Humphrey, 1997).
There is extensive empirical work on US banking industry exploring whether or not branch network contributes to cost efficiency of banks. But evidence in this regard is inconclusive. A comprehensive work on the US banking sector with sample of 5,548 banks revealed that the operation of branch network, either domestic or foreign, contributed to higher cost inefficiency (Kaparkis, et. al, 1994). On the other hand, another study on the US banking sector pointed out that there was no significant difference in efficiency between branch banks and non-branching unit banks and overall and technical efficiency were negatively related to product diversity and positively related to the extent of urbanisation.
Similarly, with regard to impact of deregulation on bank efficiency, consensus is again less than absolute. A study based on separate panels of 88 Spanish banks and 55 savings banks covering the period 1985-91 highlights the point that deregulation was associated with a decrease in relative cost efficiency for commercial banks but no change for savings banks (Cuerta, Rand Orea, L (2002). Again, a study on Turkish commercial banks adopting data envelopment analysis covering the period from 1988-1999, revealed that banks experienced scale inefficiency during the period of deregulation. On the other hand, a couple of studies on the Indian banking sector show that deregulation which permitted diversification in fee based activities and relaxed norms for branching has contributed to the efficiency and productivity growth ((Bhattacharya, Bhattacharya and Kumbhakar, 1997). Similarly, a study on Turkish banks for the period between 1981-90 found that productivity improved significantly after deregulation but it was driven mainly by efforts of inefficient banks to catch up with best banks rather than technical progress. Further, exclusion of non-traditional activities such as off-balance sheet items significantly deteriorated average efficiency and productivity scores of entire industry.
With regard to impact of diversification, there is more or less a consensus. A panel study covering 86 commercial banks over the period 1985-1990 observed that diversification has led to overall economic gains in the U.S. commercial banking industry of roughly 1 per cent. Similarly, a panel consisting of Taiwan’s 22 domestic banks, of which 11 were public banks, for the period 1981-1992 identified that both scale and scope economies existed in Taiwan’s banking industry.
There are a couple of cross country studies evaluating relative efficiency level of banking industry in different countries. European Commission estimated a pooled time series cost frontier for all main European Union banking sectors for the period 1987-94. Overall the study found average productivity inefficiencies of 20 per cent. At an individual country level, Luxembourg banks appeared to be relatively more efficient. Another comprehensive work on productivity, efficiency and differences in technology, for eight European countries in 1992, suggests that France, Spain and Belgium appeared to have the most efficient banking sectors (with efficiency scores of 0.95, 0.82 and 0.81, respectively), while UK (0.54), Austria (0.61) and Germany (0.65) were the least efficient.
Some studies have documented how cost efficiency can particularly enhance safety and soundness of the financial system. Berger and De Young, in fact found a two-way causality between problem loans or asset quality - which is a crude indicator of safety and soundness under CAMELS rating - and cost efficiency for US banks between 1985 and 1994. Non- performing loans, caused due to external events can impose extra operating costs on banks.
It has been demonstrated empirically how bank failure can be predicted using efficiency score obtained from data envelopment analysis as a proxy of management quality. It was found that banks receiving high efficiency score are much more likely to survive than banks which have relatively low scores (Barr and Siems,1996).
Another study has validated the high relevance of regular cost efficiency screening for early warning signals of managerial problems in commercial banks in Czechoslovakia. It confirmed a negative and significant relationship between cost efficiency and the risk of bank failure. In view of this, the assessment of efficiency and productivity of banking assumes seminal importance (Podpiera and Podpiera, 2005).
References:
Barr, R., and T. Siems. 1996. “Bank Failure Prediction using DEA to Measure Management Quality.” Federal Reserve Bank of Dallas Working Paper.
Berger, A. N., and D. B. Humphrey. 1997. “Efficiency of Financial Institutions: International Survey and Directions for Future Research.” European Journal of Operational Research, 98:175-212.
Berger, A. N., and R. de Young. 1997. “Problem Loans and Cost Efficiency in Commercial Banks.” Federal Reserve Board Finance and Economics Discusion Series 8.
Bhattacharya, Anjana, Arunava Bhattacharya and Subal C. Kumbhakar. 1997. “Changes in Economic Regime and Productivity Growth: A Study of Indian Public Sector Banks.”
Journal of Comparative Economics, 25(2):196-219 . Cuerta, R., and L. Orea. 2002. “Mergers and Technical Efficiency in Spanish Savings Banks: A Stochastic Distance Function Approach.” Journal of Banking and Finance, 26(12): 2231-2247.
Podpiera, A., and J. Podpiera. 2005. “Deteriorating Cost Efficiency in Commercial Banks Signals an Increasing Risk of Failure.” CNB Working Paper Series, December.
Box IX.3 Analytical Framework of Ratio Analysis
A common approach to efficiency and productivity analysis in the banking sector is the ratio analysis, whereby the performance of a banking unit is adjudged in terms of certain key parameters and their ratios such as cost to income ratio, business per employee, business per branch etc. However, it may be observed that the analysis follows a sequence and each of these ratios is inter-linked. For example, cost to income ratio can be termed as an overall efficiency measure of the bank. It is a proxy of how efficiently bank undertakes its overall operations. Picking up individual income components and relating them to their respective cost constituents would reveal or provide insight into the bank’s competence in different activities. Deposit mobilisation and credit creation is the core of banking business. Hence, the intermediation cost which relates income from credit and cost of deposit would illuminate bank’s efficiency in its core function of raising deposits from savers and on lending to user groups. Similarly, bank’s investment in Government and non-Government securities can be hypothesised to be sourced from borrowed funds, raised either domestically or internationally. The net interest margin ratio relates how efficiently banks manage their pecuniary risk arising from asset-liability mismatch.
As far as non-fund or fee based activities are concerned, personnel skills and business acumen of bank employees handling the particular desk matters. However, it is difficult to segregate cost incurred by a bank on its personnel staff handling fee-based activities, given the fact that the same set of personnel may be engaged in handling both fund and non-fund based activities. Thus, efficiency of banks in this third line of business is broadly measured in terms of ratio of non-interest income to interest income or total income. Banks often employ a transfer pricing mechanism to calculate the contribution of each banking activity towards total profits.
Income depends upon two factors, viz., size of business or quantum of credit or investment portfolio and price or lending rates or interest/dividend/capital gains on per unit of investment. Thus, after ascertaining bank’s competence in sub-activities, its efficiency could be seen in terms of overall quantum of business per unit of its inputs, that is, business per employee or business per branch. Finally, this could be followed by profitability ratios such as return per unit of assets or returns on equity.

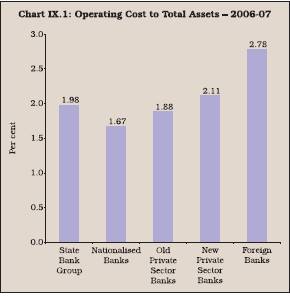
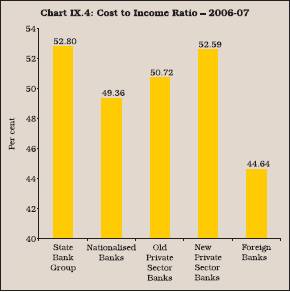
9.16 A comparison of cost to asset ratio across the bank groups shows that during 2006-07, the cost to asset ratio was the lowest for nationalised banks, followed by old private banks, State Bank group and new private sector banks. It was the highest for foreign banks (Chart IX.1).
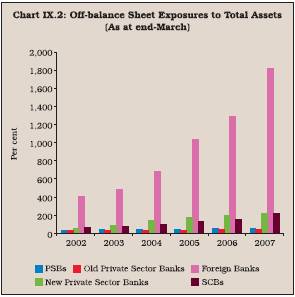
9.17 The high ratio in respect of foreign banks could be somewhat misleading because of off-balance sheet exposures, which constitute a sizeable proportion of their total business (Chart IX.2). Although such business entails cost, it is not captured in the assets as a result of which the operating cost to asset ratio is inflated.
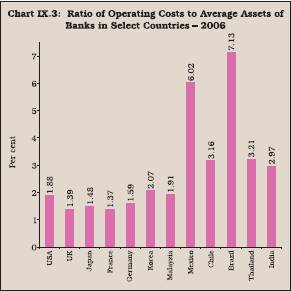
9.18 A cross country comparison reveals that the ratio of operating expenses to total assets declined in several advanced economies and EMEs between 1999 and 2006 due mainly to growing competitive pressures within and across the borders. Although the ratio in India was higher than that in advanced countries, it compared favourably with most emerging market economies (EMEs). While the ratio was generally less than two for advanced economies during 2006, it ranged widely between 1.43 and 7.13 in EMEs. Also, the ratio in EMEs in Asia was lower than that of Latin America and Eastern Europe (Russia). The ratio in the case of India compared favourably with Thailand, the Philippines and Indonesia, but unfavourably with Korea, Malaysia and China (Table 9.2 and Chart IX.3)1.
Cost to Income Ratio
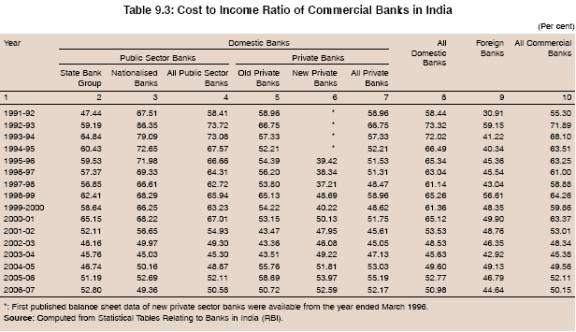
9.19 The cost to income ratio indicates how profitably the funds have been deployed by the banks. The ratio reflects the ability of a bank to generate revenue from its expenditure. It captures the impact of off-balance sheet operations and is, thus, a better measure of efficiency than the cost to assets ratio. For the industry as a whole, the cost to income ratio declined gradually from a peak level of 71.89 per cent in 1992-93 to 50.15 per cent in 2007 (Table 9.3). However, trends have varied across the bank groups. While the ratio moved up in the case of foreign and new private sector banks, it gradually declined for all other bank groups.
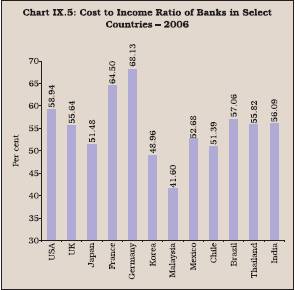
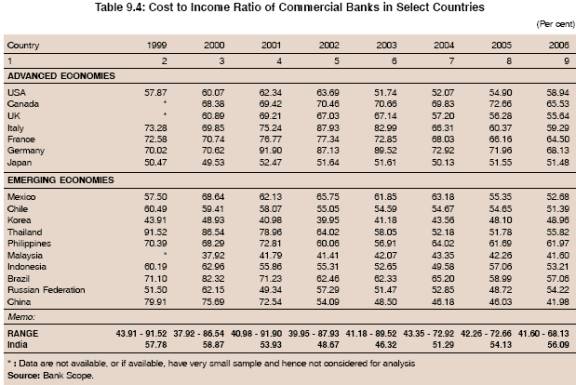
9.20 As a result, the gap in the ratio amongst different bank groups narrowed down over the years. During 2006-07, the cost per unit of income continues to be the least in the case of foreign banks, implying this group is most efficient in the industry, followed by nationalised and old private sector banks. In terms of this ratio, State Bank and new private sector bank groups are the least efficient (Chart IX.4). As per the international best practice norm, banks should strive to achieve cost-income ratio of 40 per cent2 . Therefore, India, with the cost to income ratio of 50.15 per cent, needs to cover a lot of ground to achieve international competitiveness and meet the best practice norm in rendering banking services. 9.21 Although the ratio of operating cost to income was higher than the desirable level, it may be noted that the ratio of Indian banks compared favourably with several advanced and emerging market economies (Chart IX.5). In most of the countries in the sample, the ratio was more than 50 per cent. Only in three EMEs, the ratio was close to 40 per cent (Malaysia, China and Korea). China was able to bring down the cost to income ratio by one half between 1999 and 2006 (Table 9.4).

9.22 The operating costs can be disaggregated into labour and non-labour operating costs. Such disaggregation helps in finding out the relative importance received by labour / technology
in the different banking systems. Further, with increased integration of financial services and markets across the world, necessitating greater reliance on technology solutions to achieve greater competitiveness and speed in providing financial services, it is expected that the non-labour operating costs would account for greater share than the labour costs.
Labour Cost per Unit of Earning Assets
9.23 Banking, by nature is an information and human capital intensive industry, notwithstanding the increased reliance on technology solutions for improving productivity. Hence, labour cost plays an important role in determining the profitability of banks. Therefore, at a disaggregated level of operating costs, labour cost (expenditure on salaries) per unit of earning assets assumes importance among the components of operating costs. The labour cost per unit of earning asset almost declined by one half for the industry as a whole from 2.30 per cent in 1991-92 to 1.23 per cent in 2006-07. This was mainly on account of decline in labour cost per unit of public sector banks and old private sector banks; the unit cost of new private sector banks and foreign banks increased (Table 9.5). The decline in the case of public sector banks was largely on account of vigorous implementation of voluntary retirement scheme in 2000-01.
9.24 The labour cost for new private sector banks during 2006-07 was the lowest among all bank groups, essentially as they rely more on technology for routine work than labour force, apart from outsourcing most of the routine marketing jobs (Chart IX.6). However, their labour costs are on the rise, mostly due to expansion in their branch network and recruitment of staff. On the other hand, the labour cost of foreign banks, which was the lowest in the banking sector in 1991-92 at 1.08 per cent, increased to 1.56 per cent in 2006-07 mainly on account of much higher emoluments paid by them. Foreign banks, which accounted for only 0.38 per cent of branch network and 1.45 per cent of staff strength of all commercial banks in 1991-92, accounted for 3.14 per cent of total expenditure on salaries among the commercial banks. The salary expenditure of foreign banks accounted for 8.52 per cent of total salary expenditure of all commercial banks, for only 3.11 per cent of total bank staff strength and 0.47 per cent of branch network in 2006-07.
9.25 Notwithstanding considerable improvement in labour productivity during the last 10 years or so, labour cost in India continues to be higher than that in developed economies. In most of the developed countries and some Asian nations such as China, Korea, Thailand and Malaysia, the labour cost (personnel expenses per unit of earning asset in percentage terms) was less than 1 per cent. India’s labour cost, however, was comparable with Italy and somewhat better than that of the Philippines and Indonesia in recent years. Among other EMEs, labour costs in Brazil and Russia were significantly higher at more than 2 per cent (Table 9.6 and Chart IX.7).


9.26 These patterns suggest that economic development alone may not be a significant factor in explaining the labour costs. Competitive pressures and labour market structure also appear to be important factors affecting the labour cost.
Non-Labour Cost
9.27 With increased emphasis on technological solutions for quicker processing of data and routine tasks, and for providing more “customer friendly” services, the non-labour costs3 of banks, in absolute terms, have been on the rise. Non-labour cost per unit of earning assets increased for all bank groups in the early period of reforms (Table 9.7). However, from the mid-1990s, non-labour cost declined for all bank groups, barring foreign and new private sector banks. Nonetheless, enhanced spending on technology intensive inputs is expected to enhance productivity and efficiency in the long-run with relatively faster expansion of earning assets compared to the non-labour costs. Non-labour costs of new private sector banks and foreign banks were significantly higher than those of public sector banks and old private sector banks. One of the major reasons for high non-labour cost of foreign bank group was large off-balance sheet exposures, which are not captured in the denominator (total assets), while costs of conducting such business are reflected in the numerator (non-labour costs). Higher non-labour cost in the case of foreign and new private bank groups was also on account of expenditure incurred on branch expansion, technological up-gradation and infrastructure creation, which is expected to enhance their efficiency and productive capacity in the long run (Chart IX.8).


9.28 Notwithstanding the general trend of decline in non-labour costs, some interesting trends emerge in the ratio of labour cost to non-labour cost (normalised by earning assets) which can be taken as indicative of the labour intensity of different bank groups. The labour intensity has been on the decline for public sector banks and old private sector banks, essentially due to the technological solutions undertaken by these bank groups (Table 9.8). Further, the rationalisation of the labour force in public sector banks also helped in reducing their labour intensity. On the other hand, the labour intensity of new private banks increased gradually, both on account of increase in the labour force and emoluments paid by them, as explained earlier. 9.29 Non-labour cost for Indian banks at around 2 per cent was somewhat on the higher side as compared with the advanced countries and some emerging market economies such as Korea, Malaysia and China (Chart IX.9). In some countries such as Mexico, Brazil and Russia, the ratio was more than 3 to 4 times of that of global standards. The ratio was also relatively high for some EMEs in Asia such as Thailand, Indonesia and Philippines (Table 9.9).


9.30 Among the emerging economies, far-east Asian economies such as Malayasia and Korea have non-labour cost comparable to the developed world (Chart IX.9).
Intermediation cost
9.31 There is no one definition of intermediation cost. Although some researchers have used the difference between the lending and deposit rates as the definition of intermediation, the most commonly used definition of intermediation cost is the spread between cost of deposits and return on loan assets. It reflects the efficiency with which financial resources are intermediated by the banks from savers to investors. The intermediation costs are expected to decline with the increase in productivity/efficiency of the banking system, as more efficient financial systems are expected to facilitate easier fund mobility at lower transaction costs.

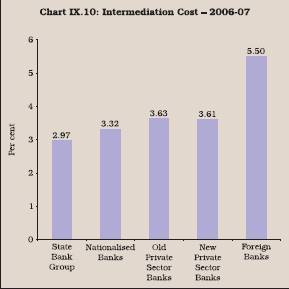
9.32 Consequent upon the initiation of financial sector reforms, there has been a gradual decline in the cost of intermediation in India. The intermediation cost at the industry level declined from 6.24 per cent during 1991-92 to 3.43 per cent in 2006-07 (Table 9.10). The decline in the intermediation cost is in sync with the decline in the cost to income ratio. The decline was noticed across all banks groups, reflecting increased competitive pressures. 9.33 During 2006-07, the intermediation cost was the lowest in the case of State Bank group (2.97 per cent), followed by nationalised banks (3.32 per cent),new-private sector banks (3.61 per cent), old private sector banks (3.63 per cent) and foreign banks (5.50 per cent) (Chart IX.10).

9.34 High intermediation cost in the case of foreign banks was partly due to their ability to raise low cost deposits. During the year 2005-06, the cost of deposits in the case of foreign bank group at 3.5 per cent was at least 100 basis points lower than the State Bank group. It is also significant to note that the share of current account deposits in total deposits was the highest in the case of foreign banks. Intermediation cost in the Indian context, however, needs to be interpreted with caution. This is because a significant part of the resources mobilised is required to be deployed in the statutory reserve requirements in the form of CRR and SLR on which banks, in the past, earned lower than the market returns. This necessitated cross-subsidisation by banks, resulting in a large wedge in the intermediation cost. The extent to which such resources are pre-empted has come down significantly and banks also fetch market related interest rates on their investment in Government securities. Still, however, an element of cross subsidisation cannot be ruled out. Therefore, the intermediation cost in the Indian context is better represented by net interest margin.


Net Interest Margin (NIM) or Spread
9.35 Net interest margin is defined as the difference between the total interest earned (including from such items as investments) and total interest expended (including on such items as inter-bank borrowings), normalised by assets. This ratio indicates as to how effectively the banks deploy all their funds (both deposit and borrowings) to generate income from credit and investment operations. Lower the ratio, the more efficient is the banking system.
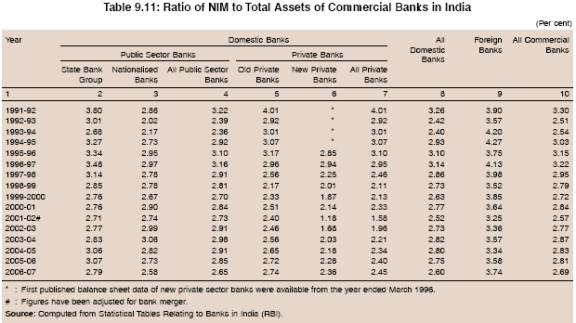
9.36 Historically, Indian banks had high NIM due mainly to lack of enough competition. The increased competitive pressures in the industry following the initiation of reforms appear to have exerted downward pressure on the spreads. The NIM for the industry, which was 3.30 per cent in 1991-92 declined to 2.57 per cent in 2001-02. From 2002-03 onwards, with a pick-up in economic activity and unprecedented credit growth, NIM exhibited upward movement and reached to 2.87 per cent by 2003-04, before moderating to 2.69 per cent level by 2006-07 (Table 9.11).
9.37 Bank group-wise data reveal that in 1991-92, the NIM in respect of State Bank group, old private sector banks and foreign banks was almost at the same level. While the NIM of foreign banks over the years declined only marginally, that of State Bank group and old private sector banks declined significantly. Trends in the case of new private sector banks showed large variations. The ratio after declining almost consistently between 1995-96 and 2001-02, increased significantly thereafter. Despite this increase, however, their NIM was the lowest in 2006-07 (2.36 per cent), followed by nationalised banks (2.58 per cent), old private sector banks (2.74 per cent), State Bank group (2.79 per cent) and foreign banks (3.74 per cent) (Chart IX.11). Higher NIM in the case of foreign banks was on account of their large proportion of current accounts that enabled these banks to raise low cost deposits, as explained earlier. 9.38 The international experience shows that in a deregulated and competitive environment, net interest margin tends to decline. This is because as competition increases, competing banks offer comparatively higher rates of interest on deposits to attract funds, while at the same time, they tend to charge lower interest rates on loans so as to expand their business. The squeeze in margins in recent years could also be attributed to the flattening of the yield curve. The international experience shows that contracting yield spread may contribute to the lowering of net interest margins, particularly in economies where interest rate derivatives are not well developed and there are limited opportunities to earn non-interest income. The yield spread computed from secondary market yields of Government securities market in India was significantly correlated to NIM during 1997-98 to 2007-08 (Box IX.4).
Box IX.4 Yield Curve and Net Interest Margin of Banks
Traditionally it is argued that yield curve and banks’ net interest margins share a logical relationship. Banks pay interest on their deposits based upon short-term interest rates while making loans tied to long-term interest rates. Thus, the difference between interest paid and received, which is the net interest margin, should be influenced by the slope of the yield curve, defined as the spread between short term and long term interest rates. The international discourse in this matter has been supported historically through 1984 and 1994 when the correlation between changes in the yield curve spread and banks’ net interest margins with a two-quarter lag worked out to be 70 per cent. This relationship between yield curve and net interest margin is important from a macroeconomic point of view given the fact that a flattening yield curve is a precursor to a slowing economic growth and consequently increased pressure on banks’ earnings. However, of late, banks have become less sensitive to yield curve movements for several reasons. One, this may be attributed to changing banking regulations and product differentiation which has enabled banks to diversify into non-traditional activities. Two, exposure to interest rate movements have been moderated through the development of new financial products such as interest rate swaps, securitisation and adjustable rate loans. Three, banks have been able to offset the impact of declining yields on net interest margins of banks by funding more of their assets through non-interest bearing liabilities such as equity and demand deposits. Another interesting observation has been that although net interest margins of large banks have moved in consonance with the yield curve movements, small banks have exhibited signs of decoupling from the prescribed trend of the yield curve. This may be attributed to differences in asset composition and funding costs between small and large banks.
Large banks specialise in commercial and industrial loans which have experienced decline in rates charged because of competition from both bank and non-bank sources. Secondly, larger banks have experienced a rapid rise in funding costs due to their greater reliance on overnight and wholesale funding which are repriced faster during an upward revision of interest rates. This is as opposed to smaller banks which rely more on long term deposits.
In the case of India, there has been flattening of yield curve with yield spread (between 1 year and 10 year Government securities) contracting from 3.22 per cent in 1996-97 to 0.72 per cent in 2006-07. The reason for this was the decline in long term rates and relative stability of short term rates as inflationary expectations remained well-anchored. The NIM has been following yield spreads with a lag possibly because lending and deposit/borrowing rates do not get adjusted to the market movements instantly. Correlation between yield spread and NIM with a one year lag was around 0.68 (Chart).

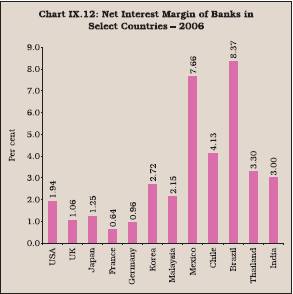
9.39 The empirical exercise conducted to ascertain the determinants of net interest margin of banks in India suggests that operating expenses are the main determinants of NIM. Provisioning also leads to increase in net interest margin. In other words, banks with large NPAs need to make larger provisions, which ultimately get reflected in higher net interest margins. The analysis also suggests that diversification results in reduction in net interest margins. That is, better diversified banks will have lower net interest margins. Economic growth positively influences the net interest margins with a lag. Further, the coefficient of the Herfindahl Index – a measure of concentration-suggests that a reduction in concentration (increase in competition), as expected, leads to decline in net interest margins, though the coefficient was not statistically significant. This could be because banks compete in terms of products, which are differentiated in terms of maturity, loan size, grace period and servicing, among others. Hence banks may continue to sell their products even without lowering interest rates. As such, the impact of increased competition on overall NIM tended to be relatively weak (Box IX.5).
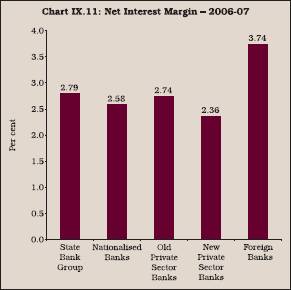
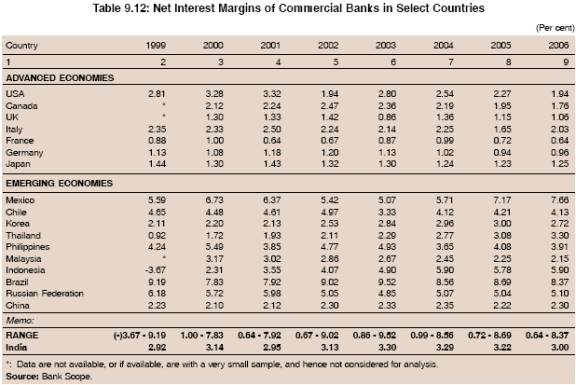
9.40 The cross country evidence suggests that there are wide variations in NIM across the banking sectors in different countries (Chart IX.12). The NIM generally declined in all the developed countries in the first half of the 2000s. However, generally NIM in advanced countries such as the USA, the UK, Canada, Japan, Germany and France was less than two. Notwithstanding the recent decline, the overall level of NIM of Indian banks was marginally higher than that prevailing internationally. The NIMs in emerging economies were much higher than in advanced countries with Brazil being at 8.37 per cent, followed by Mexico (7.66 per cent) and Indonesia (5.90 per cent). The high spreads in Brazil could be attributed to a credit programme that requires banks to allocate a significant portion of their loans to selected high-risk, high-cost borrowers at below-market interest rates. Banks offset their losses in the selected market by charging a disproportionately higher spread in the non-selected market (Souza Sobrinho, 2007). The average NIM in India, however, was comparable to several countries in Asia such as Thailand, Korea and Philippines (Table 9.12).
Box IX.5 Determinants of Net Interest Margin in India
The literature suggests that net interest margins (NIMs) are significantly influenced by competition or industrial concentration, level of non-performing assets, operating expenses and the growth in gross domestic product. It is also argued that higher diversification in banking activities also contributes towards lower NIM. Banks with higher non-fund income tend to cross-subsidise their fund-based activities, resulting in lower NIM. In order to ascertain these aspects empirically, panel regression for the period 1995-96 to 2006-07 was undertaken. Concentration was measured by Herfindial Index, (the decline in concentration would suggest increase in competition), diversification was captured by other income to total income ratio, while provisioning during the year was used to assess the impact of asset quality. The variables were made stationary by taking first difference before estimating. The estimated results indicate that NIM is significantly and positively influenced by operating expenses, growth in GDP and provisioning requirements. As expected, diversification level is negatively related to NIM. As regards concentration, results are contrary to the conventional wisdom. Higher concentration ratio has been found to be positively related to net interest margin, although statistically not very significant (Table).
Other Operating Income to Total Income
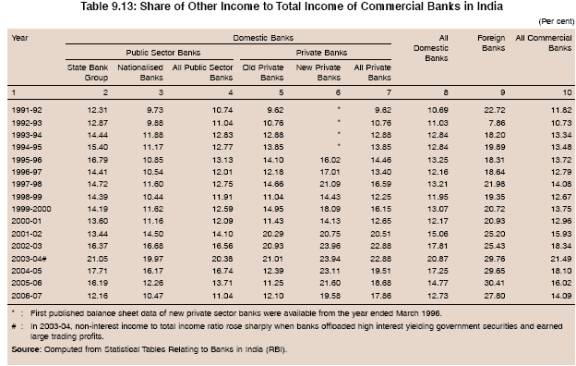
9.41 Although the ratio of other operating income (non-interest income) to total income cannot be classified as an accounting measure per se, it has been used to indicate the growing importance of other sources of income such as off-balance sheet exposures and non-traditional sources of income such as fees and commission. Thus, in a way the ratio is an indicator of diversification of operations of banks. The ratio of all bank groups, barring foreign banks, has undergone four different phases (Table 9.13). In the first phase between 1991-92 to 1995-96, non-interest sources of income increased sharply due mainly to buoyant primary capital market as banks were able to earn sizeable income from merchant banking activities. In the second phase from 1996-97 to 2000-01, rise in non-interest income got stalled mainly due to the decline of fee and commission based income due to the depressed capital market. In the third phase from 2001-02 and 2003-04, the non-interest income to income ratio rose sharply when banks offloaded high interest yielding government securities and earned large trading profits. In the fourth phase from 2004-05 to 2006-07, however, the ratio of other operating income to total income declined as some banks incurred trading losses on Government securities due to hardening of interest rates. Non-interest income to total income ratio of foreign banks, however, showed relatively less fluctuations. On the whole, the ratio for all scheduled commercial banks improved between 1991-92 and 2006-07.
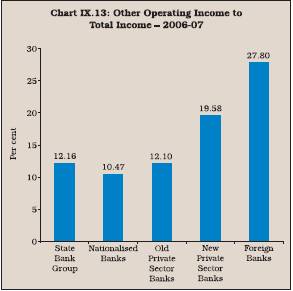
9.42 The share of other income in total income has been significantly higher for both new private sector banks and foreign banks than public sector banks and old private sector banks. This was mainly on account of large size of off-balance sheet exposure of foreign and new private sector banks as compared with public and old private banks (Chart IX.13).
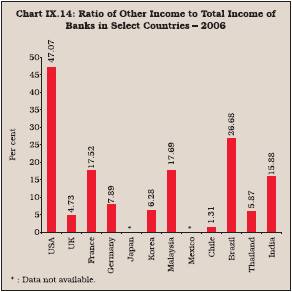
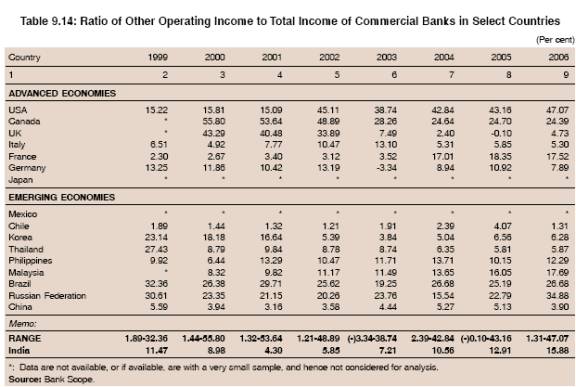
9.43 The significance of other operating income of banks in India has increased mainly on account of banks’ foray into non-traditional activities. However,it is still low as compared with the USA, France and Canada in the developed world and Brazil and Russia among the emerging market economies (Table 9.14 and Chart IX.14).
9.44 Prima facie, it appears that the level of economic development is not a significant factor in determining the share of other operating income to total income. Banks in Brazil and Russian Federation had a sizeable portion of their income emanating from other sources than many advanced countries (Table 9.14). On the other hand, the ratio of other operating income to total income, which was high in UK, Korea and Thailand, has declined in recent years.
Business per Employee
9.45 Various ratios used so far assessed the performance in terms of cost or return as a proportion to total earning assets, whereby productivity of the labour could not be ascertained directly. To understand the trend in labour productivity devoid of the influence of various other aspects such as pricing of services rendered by the bank could be undertaken by using ratios such as business per employee and business per branch. The business (deposits plus credit) per employee of commercial banks in India increased by more than eleven times from Rs.46.66 lakh in 1991-92 to 521.94 lakh in 2006-07 (Table 9.15). The rise in business per employee was observed across all the bank groups. The growth in business per employee was more pronounced for public sector banks and old private sector banks compared with other bank groups, due to their very low base during the early 1990s. However, despite this increase, productivity of these bank groups was still less than half of that enjoyed by foreign and new private sector banks. The business per employee of new private banks from the very beginning was significantly higher than that of other bank groups and they maintained their lead position until 2002-03, when the business per employee of foreign banks exceeded that of new private sector banks. During 2006-07, business per employee was the highest for foreign banks, followed by new private sector banks, nationalised banks, old private sector banks and State Bank group (Chart IX.15).
9.46 The entry of new private sector banks appears to have provided impetus for expansion of business per employee of public sector banks and old private banks by creating highly competitive environment, apart from introducing aggressive marketing strategies and hybrid products. Intense competition led to expansion in banking products, penetration of banking into unbanked areas, expansion of business through aggressive marketing strategies ably supported by technology such as core banking solutions. Higher economic growth rate and higher gross domestic savings coupled with lower penetration of other saving products also resulted in rise in deposits and credit. Public sector banks also benefited from the rationalisation of workforce through VRS undertaken during the early 2000s and introduction of practices whereby some routine jobs were outsourced. Banks focussed on generation of banking services through human capital intensive processes in line with improved technologies rather than manpower intensive banking. The rise was also discernable in the case of foreign banks, but not as sharp as that of public sector banks. The growth in business per employee of both the new private sector and foreign banks tapered off during the last two years, while it continued to rise in the case of public sector banks.
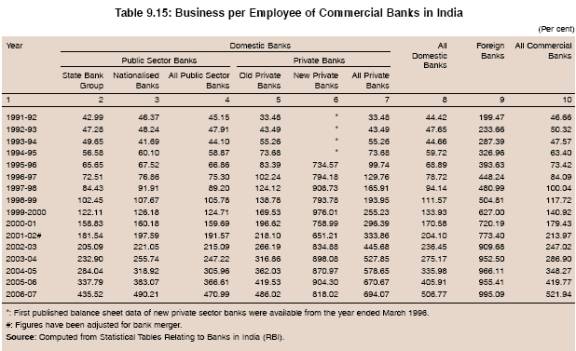

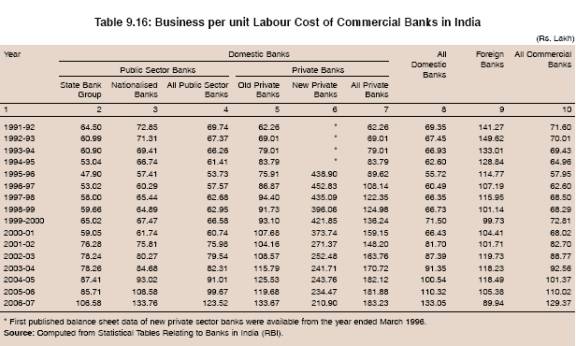
9.47 However, in terms of business per unit labour cost, public sector banks compared favourably with other bank groups, barring new private sector banks (Table 9.16). The ratio for both new private sector and foreign banks moderated between 1996-97 and 2006-07, possibly because of a sharp rise in labour cost in these banks, while the ratio for public sector banks showed a steady rise mainly because of low wage productive labour. New private sector banks were far ahead of all other bank groups. During 2006-07, business per unit labour cost was the highest for new private sector banks, followed by nationalised banks, old private sector banks, State Bank group and foreign banks.
Business per Branch
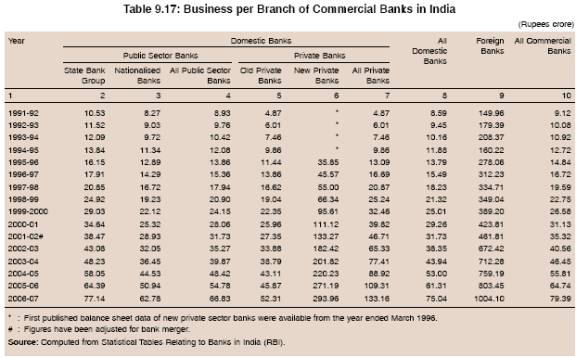
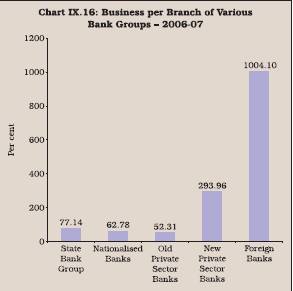
9.48 Business per branch, similar to the ratio of business per employee, has risen steadily for the banking industry and for all bank groups since the early 1990s. This may be attributed to expansion of new business, rationalisation of branches by some banks, and evolution of new business strategies like sharing of ATMs so as to economise on cost and capitalise on technology. Pick up in business per branch in the case of public sector banks was not as sharp as in the case of business per employee, the rise in which, to an extent, was also due to voluntary retirement schemes introduced by public sector banks. Business per branch of foreign and new private sector banks, which was already high, grew faster than that of public sector and old private sector banks. This accentuated the gaps in the relative productivity levels across the various bank groups, measured by business per branch.
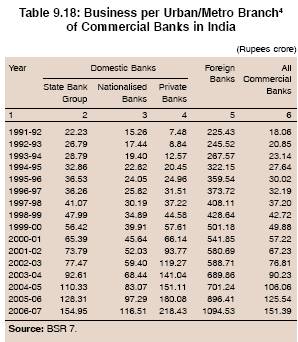
9.49 During 2006-07, the business per branch of foreign banks was almost 3.5 times that of new private sector banks and almost 15 times that of the State Bank group and nationalised banks (Table 9.17, Chart IX.16). The relatively low business per branch of public sector banks could be attributed to large proportion of rural branches where the size of transaction is small. On the other hand, foreign and new domestic private sector banks operate largely in urban areas and manage accounts of high net worth individuals and premium corporates. This was also evident from the size of business per urban/metro branch, which in the case of foreign banks and private sector banks, was significant in comparison with public sector banks (Table 9.18).
Return on Assets
9.50 Return on Assets (RoA) gives an indication as to how much profits a business unit (bank in the instant case) is able to generate per unit of its assets. Higher value of this ratio is indicative of higher profitability, and hence, productivity. As per Basel -II norms, the ROA should be more than one per cent (Ghosh, C.R. et al; 2004).
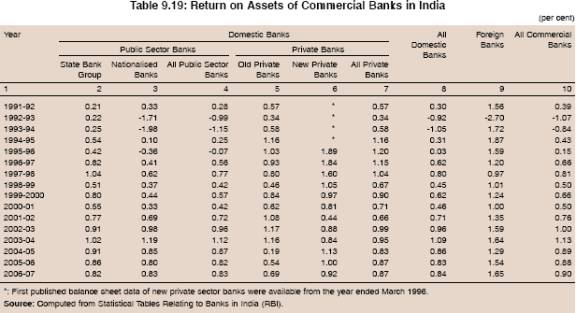
9.51 Notwithstanding increased competition in the banking system in India, the return on assets improved significantly from 0.39 per cent in 1991-92 to 1.13 per cent in 2003-04, albeit with some fluctuations, before stabilising at around 0.90 per cent in the following three years (Table 9.19). The significant improvement in the profitability ratio is all the more significant as the intermediation cost of the bank declined during the same period.
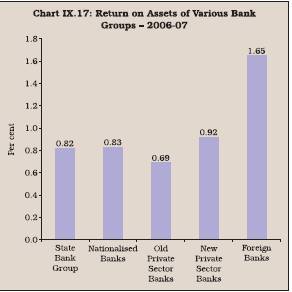
9.52 Amongst the bank groups, the ratio improved significantly for the State Bank group and nationalised banks. The ratio for nationalised banks had turned negative in the initial years of reforms, following the application of prudential norms, which revealed large NPAs and required huge provisioning by banks, resulting in net losses by some banks. In 1992-93, 13 banks reported net losses as against 3 in 1991-92. The RoA of all banks fluctuated widely during the 1990s. The RoA of public sector banks increased significantly during 1997-98 due to rise in net profit to total assets because of lower provisions on account of decline in NPAs. On the other hand, the ratio for new private banks declined during the year due to higher provisions on account of ‘mark to market’ losses on their investment portfolios. However, the RoA of old private sector banks declined sharply during the last three years of the 1990s. Overall, it may be observed that the RoA of public sector banks and private sector banks has almost converged, while that of foreign banks continues to be high, reflecting to a large extent profits generated from off-balance sheet business (Chart IX.17).
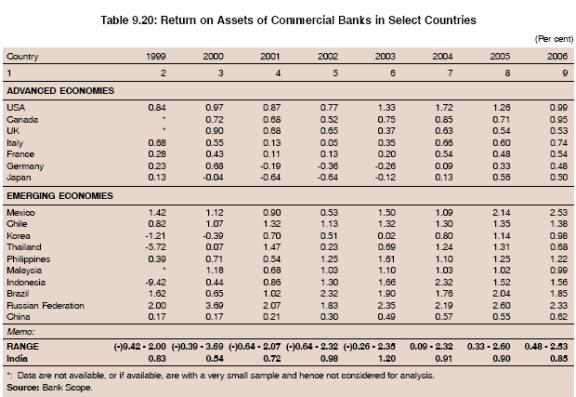
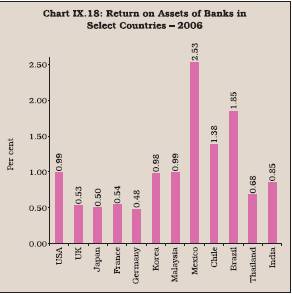
9.53 The RoA of banks in countries across the globe vary significantly. However, the ratio in most advanced countries and some emerging market economies was less than one. Banks in Brazil and Russia exhibited relatively high levels of ROA due to the above average spreads enjoyed by the banks possibly due to low competition (Table 9.20 and Chart IX.18).
Return on Equity (RoE)
9.54 The return to asset ratio as analysed before would impart upward bias to some foreign banks as they are able to generate large profits from off-balance sheet exposures. The return on equity, defined as the ratio of net profits after tax to total equity capital, is, therefore, used as an alternative measure of profitability. The disadvantage of this measure, however, is that equity may vary significantly across the banks, even though their asset size may be identical. However, this problem is not encountered for various domestic bank groups as their equity level (as percentage of their risk-weighted assets) is not significantly different. The RoE indicates the amount of profits a business unit is generating for its equity investors. The ratio is widely used by equity investors in their decision making. Higher value of the ratio is indicative of higher profitability, and hence, productivity.
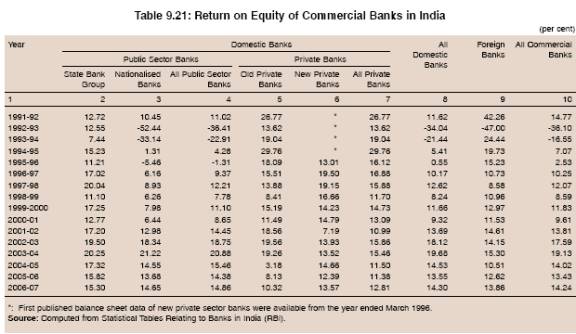
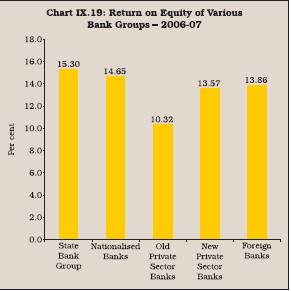
9.55 The return on equity in the case of Indian banks exhibited almost similar trends as that of RoA. The RoE of all commercial banks fluctuated widely during 1991-92 to 2006-07 in consonance with the profitability and prevailing capital position in India. However, unlike RoA, RoE of public sector banks was comparable even with foreign banks. In fact, RoE of public sector banks, new private sector banks and foreign banks converged to around 14-15 per cent in 2006-07, while that of old private sector banks lagged behind somewhat (Table 9.21 and Chart IX.19). The RoE declined drastically during 2000-01 due to fall in net profits in all bank groups except new private sector banks. Decline in case of public sector banks was particularly due to higher wage bills, inter alia, on account of VRS payments during the period.
9.56 The RoE of banks in different countries varied widely between 1999 and 2006. The ratio during 2006 varied between 8.10 (Thailand) and 19.21 (Mexico). The RoE of Indian banks was comparable with the banks in the USA, Italy, Germany, and some EMEs such as Korea and Indonesia. The RoE in Brazil and Russia were much higher than many other countries, indicating the very high spread levels enjoyed by the banks in these countries, as alluded to earlier (Table 9.22 and Chart IX.20).
9.57 To sum up, the analysis of various accounting measures suggests a significant improvement in the efficiency/productivity of the Indian banking sector in the post-reform period, although the degree of improvement varied across the bank groups. The performance, especially of public sector banks, worsened in the initial years of reforms as eight public sector banks suffered net losses in 1992-93 and six in 1993-94. However, the performance improved thereafter gradually, especially beginning 2001-02. The most significant improvement was observed in intermediation cost, which has declined significantly in the last few years, reflecting the impact of intensifying competitive pressures. Despite this, however, the profitability of banks improved as was reflected in the return on assets. This was achieved by cutting operating costs and increasing recourse to non-interest sources of income measured by the cost to income ratio and the non-interest income to total asset ratio, respectively. The recovery of past dues locked in non-performing assets, reduction in statutory pre-emptions in the form of CRR and SLR and reduction in corporate tax rates also played a significant role in improving the profitability. As a result of significant improvement over the years,efficiency/productivity of the Indian banking sector as measured by the various ratios has moved closer to the global levels.
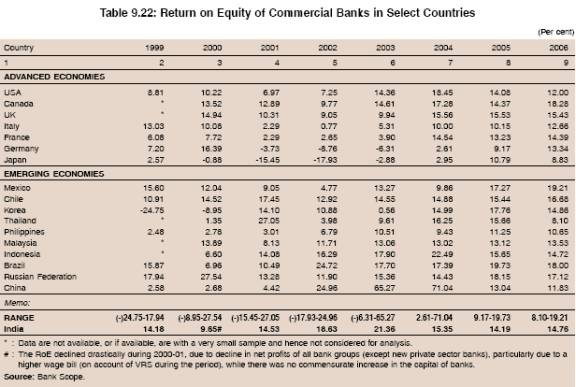
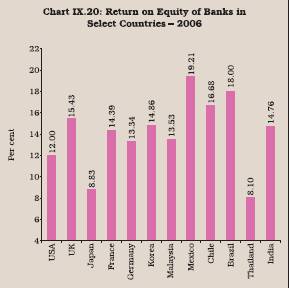
9.58 The improvement in different efficiency/ productivity measures, however, was different for different bank groups. Between 1991-92 and 2006-07, the largest decline in the NIM was noticed in the case of old private sector banks. However, it was nationalised bank group which showed the largest improvement in the cost to income ratio. The large increase in the business per employee was observed in the case of old private sector banks. Non-interest sources of income of new private sector banks registered the largest increase. The public sector banks exhibited the highest degree of improvement in the return on assets and return on equity. The performance of various bank groups in respect of most of the ratios has tended to converge. During 2006-07, new private sector banks were the most efficient in terms of intermediation cost (measured by net interest margin), followed closely by nationalised banks. It is significant to note that the cost of deposits of foreign bank group was about 100 basis points lower than that of public sector banks. This, however, was not reflected in their lending rates, resulting in higher net interest margins. However, the operating cost to income ratio was the lowest for foreign banks and the highest for the State Bank Group. In fact, the State Bank group and foreign banks were the two groups, whose cost to income ratio increased between 1991-92 and 2006-07. This, to a large extent, reflected the labour cost, which was almost the same for both bank groups. However, foreign banks generate significantly a larger portion of income from off-balance sheet exposure than the State Bank and other bank groups, resulting in low operating cost to income ratio. Business per employee and business per branch of both foreign and new private bank groups were far better than those of public sector banks. This was despite the fact that labour productivity of public sector banks increased by about 10 times in a span of 15 years. This, to a certain extent, may be explained by the fact that public sector banks, unlike foreign and new private bank groups, maintain rural branches where the transaction size is small.
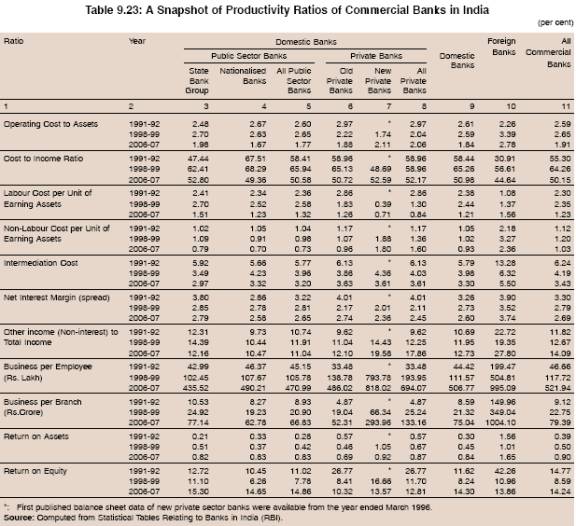
9.59 The profitability ratio of foreign bank group during 2006-07 was the highest on account of higher net interest margins combined with higher share of non-interest sources of income. However, the return on equity during 2006-07 was the highest for the State Bank group, followed by nationalised banks (Table 9.23).
9.60 Most of the performance indicators of the Indian banking sector compare favourably with banks in advanced and other emerging economies. For instance, the cost to income ratio in India was better than banks in many developed countries such as Canada, France and Germany. Similarly, in terms of operating cost to total assets, banks in India were better placed than those in several EMEs such as Mexico, Chile, Thailand, Philippines, Indonesia, Brazil and Russia. Although labour cost experienced a steady decline between 1999 and 2006, it was still above 1 per cent of earning assets in banks in India, unlike banks in many EMEs such as China, Korea and Malaysia and most of the advanced countries in the developed world. This suggests that there is a scope for improvement in labour cost. On the other hand, in terms of net interest margin (NIM), banks in China, Korea and Malaysia were better placed than those in India. The contribution of non-traditional sources to banks’ income (non-interest income) was higher in India than in many advanced economies such as UK, Italy and Germany. Similarly, return on equity in India in 2006 was higher than that in many advanced economies such as US, Italy, Germany and Japan as well as most emerging market economies.
IV. MEASUREMENT OF EFFICIENCY AND PRODUCTIVITY OF THE BANKING SECTOR IN INDIA - ECONOMIC MEASURES
9.61 In the previous section, efficiency/ productivity was measured using the traditional accounting measures. However, such measures have limitations in that the choice of a single ratio does not provide precise information about various dimensions of the performance of a bank, which uses multiple inputs to produce multiple outputs. Moreover, these measures also do not differentiate between efficiency and productivity clearly. This problem is better addressed through economic measures that capture all aspects of banking operations in a single measure.
9.62 Among the several techniques for economic measures (refer Appendix IX.1), the data envelopment Analysis (DEA) approach used in this chapter has several advantages over others. One, it provides bank-level efficiency score. Two, it does not require a prior specification about the underlying technologies.
9.63 Under the DEA approach, a best practice frontier which represents optimal utilisation level of resources is prepared and efficiency of banks is measured relative to that best frontier (benchmark). If a bank lies on the frontier, it is referred to as an efficient bank, otherwise it is termed as less efficient. More away the bank is from the frontier, lower is its efficiency level (Box IX.6). Since, in practice, the true ideal technology is not observable, the DEA analysis attempts to define the feasible technology frontier.
9.64 In order to estimate the best practice frontier, labour, fixed assets, deposits and borrowings have been treated as inputs, while credit, investments and asset equivalent of off-balance sheet operations5 have been used as outputs.
Efficiency Estimates in India
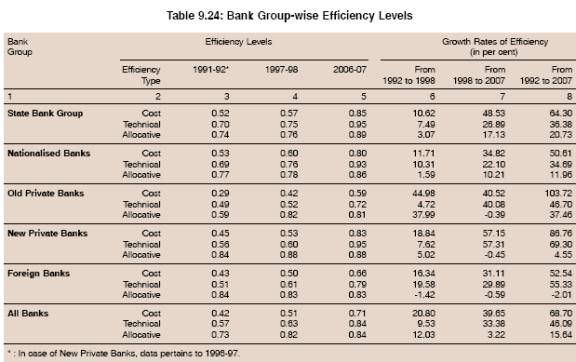
9.65 According to the DEA estimates, there has been a significant improvement in efficiency levels across the bank groups after the initiation of reforms. The improvement in efficiency was significantly more pronounced between 1998 and 2007 than between 1992 and 1998. During 1991-92, the cost-efficiency based on DEA estimates of the banking sector was 0.42 (implying that given the observed input-output bundles and feasible technology, 58 per cent of cost could have been reduced to produce the same level of output), which rose to 0.71 by 2006-07 (Table 9.24). In terms of bank groups, the gains in cost efficiency were more significant in the case of old private sector banks between 1992 and 2007 compared to other bank groups largely due to their low base in the early 1990s. Despite the large gains by private bank groups, public sector banks, particularly the State Bank group, continued to be the market leader insofar as absolute efficiency levels were concerned.
9.66 During 2006-07, the State Bank group was the most cost efficient with efficiency level of 0.85, followed by new private sector banks with the efficiency level of 0.83, nationalised banks with the efficiency level of 0.80, foreign banks with the efficiency level of 0.66 and old private sector banks with the efficiency level of 0.59 (Table 9.24). In other words, the old private sector banks were the least cost efficient in absolute terms. Significantly, foreign banks were found to be less efficient than public sector banks.
Box IX.6 Data Envelopment Analysis
Data envelopment analysis (DEA) is a non-parametric method of measuring efficiency of a decision making unit (DMU) such as bank/ firm. DEA employs mathematical programming to construct a best practice frontier from the observed data and to measure efficiency relative to the constructed frontier. The DEA frontier is formed by connecting the set of best practice observations (the piece-wise linear combination). Thus, the DEA efficiency score for a DMU or bank is not defined by an absolute standard but is defined relative to other banks. For an industry where one output is produced using two inputs, it can also be represented by a unit isoquant.
The best way to explain DEA is by way of ratio form. For each DMU, we would like to obtain a measure of the ratio of all outputs (y) over all inputs (x), such as u’y/v’x, where u is output weight and v is input weight. To select optimal weights, we specify the mathematical programming problem:

This involves finding values for u and v, such that the efficiency measure of the ith DMU is maximised, subject to the constraint that all efficiency measures must be less than or equal to one. One problem with this particular ratio formulation is that it has an infinite number of solutions. To avoid this, an equivalent envelopment form of this problem is estimated, i.e.,
This may be explained with the following hypothetical example: To evaluate the technical efficiency ( ) of firm C, the following linear programming problem is solved:
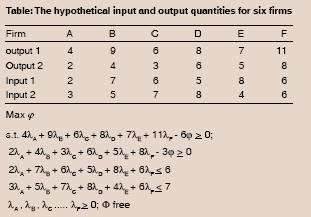
The output quantities of firm C appear as coefficients of - in the left-hand sides of the inequalities, where its input quantities appear on the right-hand sides of the constraints. The optimal solution of this problem is

This means that if we construct a reference firm (say C*) by combining 66.7 per cent of the input-output bundles of firm F with input-output bundle of firm A, then this new firm would produce 11.33 units of y1 and 7.33 units of y2 using 6 units of x1 and 7 units of x2. Comparison of this potential output bundle with the actual output levels of firm C reveals that output y1 can be expanded by a factor of 1.889, while output y2 can be increased by a factor of 2.444. This is measured by * in the optimal solution. Hence, a measure of technical efficiency of firm C is
TE(C ) = 1/1.889 = 0.529
The DEA was first introduced into operations research literature by Charnes, Cooper and Rhodes (CCR Model, European Journal of Operations Research; 1978) (Ray; 2004). Although the original CCR model was applicable only to technologies characterized by constant returns to scale, Banker, Charnes and Cooper (BCC) (Management Science, 1984) extended the CCR model to accommodate technologies that exhibit variable returns to scale.
Although prima facie, DEA appears to be relatively new methodology, the intellectual underpinnings of DEA in economics date back to the 1950s. Debreu (1951) defined the ‘coefficient of resource utilisation’ as a measure of technical efficiency for the economy as a whole and any deviation of this measure from unity was interpreted as a deadweight loss suffered by society due to inefficient utilisation of resources. Farell (1957) constructed a linear programming model using actual input-output data of sample of firms. He approximated the underlying production possibility set by convex hull of a cone containing observed input-output bundles. A group of agricultural economists at University of California, Berkeley further improved upon Farell’s measure. Aigner and Chu retained a parametric specification of production frontier but constrained observed data points to lie below the function. They proposed using mathematical programming to fit the specified function as close to the data as possible.
In other words, non-parametric analysis of efficiency using linear programming in economics bears a long history prior to the formal introduction of DEA into the literature.
References:
Banker, R. D., A. Charnes and W. W. Cooper. 1984. “Some Models for Estimating Technical and Scale Inefficiencies in Data Envelopment Analysis.” Management Science, 30(9): 1078-1092. Charnes, A., W. W. Cooper, and E. Rhodes. 1978. “Measuring the Efficiency of Decision Making Units.” European Journal of Operational Research, 2(4): 429-444.
Debreu, G. 1951. “The Coefficient of Resource Utilisation.” Econometrica, 19: 273-92.
Farell, M. J. 1957. “The Measurement of Productive Efficiency.”
Journal of Royal Statistical Society, 120(A): 253-81.
Ray, S., 2004, Data Envelopment Analysis, Techniques for Operations Research and Economics.
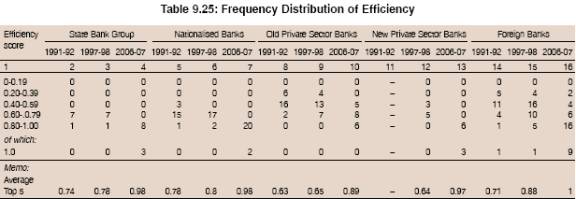
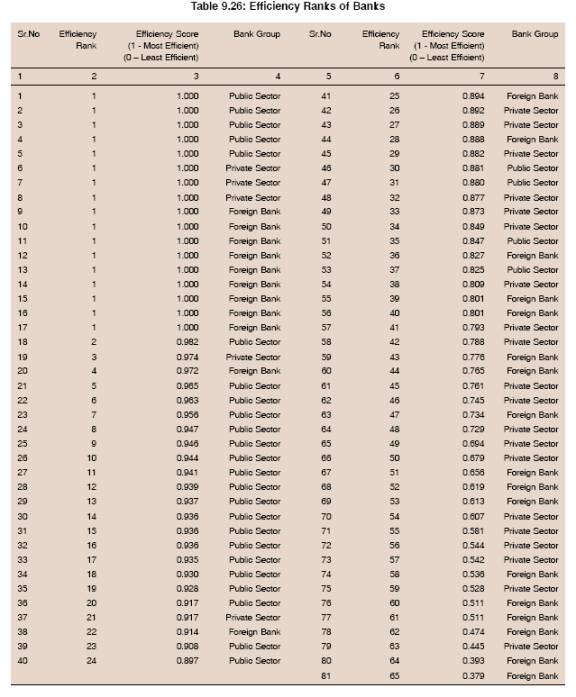
9.67 With regard to relatively low efficiency levels observed in the case of foreign bank group, it may be noted that it is quite a heterogeneous group with efficiency levels varying from as low as 0.37 to the maximum level of 1.0. Moreover, banks with very low efficiency among the group are also the banks with very small size and limited business operations. The average efficiency level of foreign bank group, excluding these outliers (with low efficiency), which together do not account for more than 20 per cent of the overall size of this group (in terms of total assets), worked out to more than 0.66 in 1997-98 and almost 1.0 in 2006-07. Of the total 28 foreign banks, as many as 9 banks had efficiency score 1.0 during 2006-07; in 1997-98 only one foreign bank was with efficiency score of 1.0, which incidentally was the only bank with 1.0 efficiency score in any bank group. On the other hand, all the 28 public sector banks were in the efficiency range of 0.8 and 1.0, of which, 5 were with efficiency level of 1.0. As many as 24 public sector banks migrated from the efficiency score of 0.60-0.79 in 1997-98 to 0.80-1.0 in 2006-07. Of the six new private sector banks, three were with efficiency level of 1.0. No old private sector bank had efficiency level of 1.0. Out of total 17 banks in the industry, which recorded 1.0 per cent efficiency score in 2006-07, 9 were foreign bank group, 3 each from new private sector bank and State Bank group and 2 from the nationalised bank group (Table 9.25).
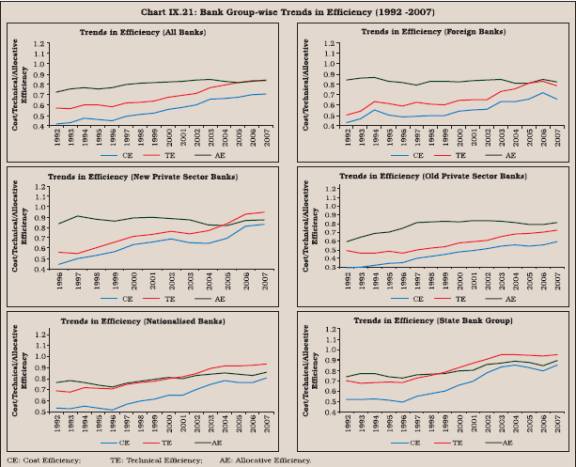
9.68 Cost efficiency estimates drawn through DEA could be decomposed into technical and allocative efficiency. Technical efficiency refers to the ability of a bank to obtain maximum output from a given set of inputs, while allocative efficiency refers to ability of the bank to use inputs in optimal proportions, given their respective prices. Most of the gains in the overall efficiency have emanated from improvement in technical efficiency (from 0.57 in 1991-92 to 0.84 in 2006-07) than in allocative efficiency (from 0.73 in 1991-92 to 0.84 in 2006-07). Relative gains in terms of technical and allocative efficiency provide further insight into the performance of different bank groups (Chart IX.21). Significantly, gains in the case of foreign and private banks were restricted to technical efficiency only. Allocative efficiency of these banks has always been high since the
early 1990s. In the case of public sector banks, gains have been distributed over both technical and allocative efficiency. Gains in allocative efficiency of public sector
banks could be attributed to recovery of past NPAs and improvement in credit risk environment as a result of which incremental NPAs declined sharply in the
post-reform period. Sizeable gains made by public sector banks in allocative efficiency may also be a pointer that rural and priority sector lending, which
constitutes a significant proportion of total business of public sector banks, is a commercially sound and viable business proposition.
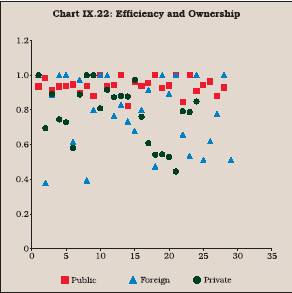
Efficiency and Ownership
9.69 The literature suggests that ownership could be a significant factor explaining the differential performance of individual banks or bank groups. The theoretical underpinning of different ownership forms leading to different efficiency level of banks can be traced to the principal-agent framework. Managers in private institutions are supposed to be more constrained by the capital market discipline. On the contrary, a lack of owner’s control makes management more free to pursue its agenda and have few incentives to be efficient. Based on this argument, private sector banks would be expected to be more efficient than public sector banking institutions.
9.70 Evidence in the case of India, however, suggests that ownership has no definite relationship with efficiency. During 2006-07, the State Bank group in the public sector was the most efficient, followed by new private sector banks, nationalised banks (in the public sector), foreign banks and old private sector banks (refer Table 9.22). However, aggregated information at times could be misleading due to large differences at individual bank level comprising the group. In particular, the foreign bank group is quite heterogeneous, as alluded to earlier. Therefore, the relationship between ownership and efficiency can be more clearly assessed at an individual bank level. The DEA efficiency analysis suggests that most efficient banks are found both in the public and private sectors. In all, there are seventeen most efficient banks, which belong to public, private as well as foreign bank groups. In fact, all the 28 least efficient banks are in the private sector (old private or foreign) (Chart IX.22 and Table 9.26). This would suggest that in the Indian context, the relationship between ownership and size is not significant.
What explains the Differences in Efficiency of Banks in India?
9.71 In the previous section, we assessed the efficiency of the banking sector as well as various bank groups. As in many other countries, efficiency levels of various bank groups and individual banks were found to be different. In the international context, there is a large body of literature that provides explanations as to why the efficiency levels could be different within and across the countries (Box IX.7).
9.72 While there is no consensus about the factors that explain the underlying differences in efficiency, two specific factors have often been debated. These are size and diversification, i.e., as to whether large and diversified banks are more efficient than smaller and specialised banks (Box IX.7). These two aspects have assumed added significance in view of the consolidation process that is underway in many countries. In fact, one of the reasons for the consolidation process that is underway all over the world is the desire to achieve economies of scale. Likewise, banks are diversifying into non-traditional activities also to reap the benefit of economies of scope. Researchers have found several cost efficiency gains associated with combining multiple product lines. One, a diversified bank with a common information system that can be used across product lines incurs the cost of gathering information only once. Two, delivery, marketing and physical inputs can be combined in production of a larger set of services. Finally, when risks in different services are imperfectly correlated, there is a potential for economies in risk management through a diversified risk portfolio. Profits of diversified organisation may also be less volatile insofar as they can efficiently diversify their risk and revenue profits. However, the empirical evidence of both economies of scale and scope is mixed.
9.73 In India also, banks are of different sizes. These banks, irrespective of their size, have diversified into new activities such as merchant banking, insurance and several other fee based activities6 . In this section, therefore, we specifically examine as to whether large and more diversified banks in India are more efficient. Further, since the level of NPAs is a drag on bank’s performance, it is, therefore, also examined whether banks with large NPAs are less efficient. These investigations have been conducted using the technical efficiency scores obtained from DEA and ranking them in the descending order. Scatter diagram and rank correlation were used to compare the association between efficiency on the one hand and size, diversification measured by non-interest income and NPAs on the other.
Efficiency and Bank Size
9.74 As the theory suggests, size appears to have a significant association with efficiency for banks in India. There is a high degree of positive association between size and efficiency (Box IX.8, Chart IX. 23). That is, in general, large sized banks are more efficient than small sized banks. The rank correlation between size measured by total assets and efficiency worked out to be 0.74, 0.55 and 0.55 in 1992, 1998 and 2007, respectively.
Efficiency and Diversification
9.75 Financial innovations triggered by economic and technological forces have created new forms of intermediation and other fee-based activities not traditionally captured on the balance sheet such as loan securitisations, back up lines of credit and financial derivatives. Thus, traditional bank efficiency measures, excluding off-balance sheet activities, may not provide accurate evaluation of a bank’s condition (Siems and Clark 1997).7 Of late, off-balance sheet exposures have been increasing in Indian banks too.
9.76 Diversification also appears to bear a significant co-movement with efficiency of banks in India as is evident from the rank correlation coefficients of 0.67, 0.55 and 0.61 for 1992, 1998 and 2007 respectively. Thus, banks which have diversified into various other financial services and earn more fee-based income are also relatively more efficient (Chart IX.24).
Efficiency and NPAs
9.77 Net non-performing assets are expected to show a negative association with efficiency. However, in the Indian context, they do not show a clear relationship with efficiency as is evident from the scatter diagrams and the rank correlation coefficients. The rank correlation coefficients are negative but not significant enough to establish a firm relationship between the two variables (Chart IX.25).
9.78 An attempt was also made to ascertain the determinants of efficiency in India through a more rigorous method (panel least squares estimates, which take into account relationship for cross section of banks over the years). The analysis corroborates the earlier findings that size and diversification are important factors affecting efficiency. That is, large and well diversified banks are more efficient than the small and not so diversified banks, suggesting economies of scale and scope in the Indian banking sector. The regression analysis, however, also establishes a negative relationship between the size of NPAs and efficiency (Box IX.9).
Measurement of Productivity
9.79 Productivity is a measure as to how efficiently the banking unit transforms its inputs into outputs, as alluded to earlier. When a firm uses a single input for producing a single output, it is easier to calculate productivity level by simply taking a ratio of its output to input. However, in case of a bank, which uses multiple inputs and outputs, such a ratio would only provide a partial measure of productivity that ignores variations in other inputs used. To overcome this limitation, productivity could be measured by computing an aggregate index of total factor productivity. One of the methods to compute productivity indices in such cases is the Malmquist Productivity Index (Box IX.10).
9.80 Productivity scores for the banking sector as well as for various bank groups suggest that there has been an across the board rise in productivity. Productivity change which was gradual till 1997-98, gathered momentum after 1997-98. Compared with 1991-92 levels, the rise in productivity of Indian banks was of the order of 5.5 per cent over the period till 1997-98, whereas it rose by 43.5 per cent by 2006-07. In terms of individual bank groups, the largest improvement was noticed in the case of foreign banks (70.6 per cent), followed by old private sector banks (44.7 per cent) and nationalised banks (35.4 per cent) (Table 9.27).
Box IX.7
What Explains the Differences in Efficiency of Different Banks? An International Perspective
Differences in measured efficiency of banking institutions broadly arise on account of (i) different efficiency concepts used; (ii) different measurement methods used to estimate efficiency; and (iii) a host of other exogenous and endogenous factors. One of the major sources of difference in the measured efficiency is the different concepts of efficiency used and measurement methods applied to test the efficiency. Estimates of efficiency have been found to be substantial across studies depending on the data source and also efficiency concepts and measurement methods used in the studies. Berger and Humphrey (1997) documented 130 studies on financial institution efficiency, using data from 21 countries, from multiple time periods and from various types of institutions including banks, bank branches, savings and loans, credit unions, and insurance companies. They concluded that the variations in the data sets from which efficiencies are measured make it virtually impossible to determine how important the different efficiency concepts, measurement techniques, and other factors are to the outcomes of these studies. However, another study, which explored the effects of a number of different efficiency measurement methods on three different efficiency concepts (cost, profits and alternative profit efficiency), concluded that choices made concerning measurement techniques, different functional forms and other variables usually make very little difference to efficiency (Berger and Mester, 1997).
Besides conceptual and measurement methods, the differences could arise on account of several other factors, both exogenous and endogenous. Differences in the regulatory environment can be a significant factor in the performance of banks in different countries. Banks in countries with fewer restrictions are expected to be more efficient than those with more restrictions. The competitive conditions of the market in which banks operate also play a role. It is expected that the market power is negatively related to cost efficiency but positively related to profit efficiency. Banks in less competitive markets can charge higher prices for their services, but might feel pressure to keep costs down. It has been empirically found that more competitive the banking system is, the more efficient it is. Thus, apart from conceptual and measurement methods, regulatory environments and competitive conditions appear to be the major sources of differences in efficiency of banking institutions across countries. Exogenous conditions would be the same for all domestic banks. The differences in efficiency of different banks within the country, therefore, could be attributed to the endogenous factors. Some of the major factors that are believed to impact efficiency are financial capital, size, quality of service rendered, liability structure and NPLs. A bank’s insolvency risk depends on its financial capital available to absorb losses. Insolvency risks affect banks’ costs and profits through the risk premium the bank has to pay for uninsured debt. In addition to risk, a bank’s capital level directly affects costs by providing an alternative to deposits as a funding source for loans. Interest paid on debt is reckoned as a cost, but dividends paid do not. On the other hand, raising equity typically involves higher costs than raising deposits. If the first effect dominates, measured costs will be higher for banks using a higher proportion of debt financing; if the second effect dominates, measured costs will be lower for these banks. The difference could also arise if some banks being more risk averse as they may hold a higher level of financial capital, may maximise profits or minimize costs, than others. Thus, to the extent, the capital structure of banks differs, it may impart upward or downward bias to efficiency. Several studies in the US have found that well capitalised banks are more efficient. It could also be the case that since less efficient institutions have lower profits, they have lower capital.
Size is normally associated with higher efficiency due to economies of scale. Large banks are in a better position to introduce technology and reduce costs than small banks. Improvements in information processing can reduce the costs of extending small business loans for larger banks. Similarly, improved automation also allows large banks to expand faster and at lower cost by setting up ATM machines in place of adding more expensive brick-and-mortar branch offices. Large banks are in a better position to take advantage of the new tools of financial engineering such as derivative contracts and other off-balance-sheet activities. Large size also confers diversification benefits as it allows banks to spread the cost across the products (economies of scope). Large banks normally also have large capital and, as alluded to earlier, better capitalised banks are more efficient. However, empirical evidence does not suggest a consistent relationship between size and efficiency. While a study found a significant positive relationship between size and efficiency (Berger et al, 1993), some other studies found a significant negative relationship between size and efficiency (Hermelin and Wallace, 1994; Kaparakis et al, 1994). Yet some other studies found an insignificant relationship between size and efficiency [Cebenoyen et al, (1993); Mester (1993); and P.L. Timme (1993)]. Yet another set of studies found that efficiency measures display very little potential scale biases financing large firms. It was found that as banks grow larger, they are equally able to control costs but it becomes harder to create revenues efficiently. Thus, the empirical evidence on size and efficiency is mixed (see also Box IX.9).
Another source of difference could be the level of non-performing loans. Non-performing loans and loan losses could be exogenous if caused by negative economic shocks (bad luck) or endogenous either because the management is inefficient (bad management) or because it has made a conscious decision to reduce short-term expenses by cutting back on loan origination and monitoring (skimpimg). Banks with problem loans tend to have high cost and low profits, consistent with bad management hypothesis. The skimping hypothesis –under which non-performing loans may be associated with low costs from choosing to put less effort into loan monitoring and control – was generally not supported by the data or its consequences were overwhelmed by bad management effects. That is, there is no much evidence of the skimping hypothesis. Thus broadly, it can be concluded that banks with low NPLs are more efficient. There are also unmeasured differences in the quality because the banking data do not fully capture the heterogeneity in the bank output. For instance, commercial loans can vary in size, repayment schedule, risk, transparency of information, type of collateral and covenants to be enforced, among others. These differences are likely to affect the costs to the bank of loan origination, ongoing monitoring and control, and financing expense. Unmeasured differences in product quality may be incorrectly measured as differences in cost inefficiency. At least a part of the explanation may lie in differing degrees of service quality or market power. That is, if some banks are providing service qualities that are more in demand and, therefore, are able to charge higher prices, or if some banks are able to exercise market power to raise profits substantially through higher loan prices, this would yield higher efficiency.
There is limited evidence that banks operating in more concentrated markets are less efficient. The empirical findings on the impact of merger and acquisitions are also mixed. Not all the mergers have unambiguously yielded efficiency and profitability improvements (Rhodes, 1995). Nevertheless, the fact that in some cases mergers/ amalgamations activity has led to improved efficiency suggests that M & A activity is one of the factors that could explain differences in efficiency. The empirical findings suggest that the more complex structure of multilayered holding companies does not harm bank efficiency. The evidence also suggests that all else equal, publicly traded banks are more efficient. The differences in managerial ability and corporate governance practices are also the crucial factors in explaining the differences in efficiency.
References :
Berger, A. N., D. Hancock, and D. B. Humphrey. 1993. “Bank Efficiency derived from the profit function.” Journal of Banking and Finance, 17: 317-47.
Berger, A.N., Humphrey, D.B., (1997). Efficiency of financial institutions. International Survey and Directions for Future Research. European Journal of Operational Research 98.
Berger, A. N., and L.J. Mester. 1997. “Inside the Black Box : What Explains Differences in the Efficiencies of Financial Institutions.” Journal of Banking and Finance, 21: 895-947.
Cebenoyan, A.S., Cooperman, E.S., Register, C.A., Hudgins, S.C., 1993. The Relative Efficiency of Stock vs. Mutual S&Ls: A Stochastic Frontier Approach. Journal of Financial Services Research 7.
Hermalin, B.E., Wallace, N.E., 1994. The Determinants of Efficiency and Solvency in Savings and Loans. R and
Journal of Economics, 25.
Kaparakis, E.I., Miller, S.M., Noulas, A.G., 1994. Short-run Cost Inefficiency of Commercial Banks: A Flexible Stochastic Frontier Approach. Journal of Money, Credit, and Banking 26.
Mester, L.J., 1993. Efficiency in the savings and loan industry. Journal of Banking and Finance 17.
Pi,L., Timme, S.G., 1993. Corporate Control and Bank Efficiency. Journal of Banking and Finance 17.
Rhodes, Stephen A. (1998): The Efficiency Effects of Bank Mergers. An Overview of Case Studies of Nine Mergers,
Journal of Banking and Finance, 22, 273-291.
9.81 These productivity estimates based on Malmquist productivity index could be decomposed into two mutually exclusive and exhaustive components: changes in technical efficiency, i.e., change in output for given inputs (catching up) and shifts in technology over time, i.e., technological improvements or technical progress (innovation). Relative trends in technical efficiency and technical progress reveal that between 1991-92 and 1997-98, technical efficiency of the banking sector and all bank groups, other than State Bank group, improved.However, the trend reversed if the period of analysis is extended to 2006-07. Between 1997-98 and 2006-07, all bank groups were slow to catch up (technical efficiency) with steep rise in technical progress of the industry. Efforts at computerisation, which are mainly hardware installations, were largely channelled into book-keeping and reconciliation. The IT infrastructure was driven by technology and not business and customer needs. As a result, even infrastructure that was set up, was not used by customers to the extent necessary to break even. Hence, consequential catching up benefits were not accruing to banks (RBI, 2003; World Bank, 2002). The slower catching up with enhanced potential output levels, however, needs to be interpreted cautiously. It should be seen that apparent fall in efficiency levels (catching up) was against the enhanced level of potential output. Otherwise as shown in the earlier section on efficiency, there was a significant improvement in efficiency or utilisation levels, if compared to a constant benchmark or a frontier (Table 9.25 and Chart IX.26).
Box IX.8
Does Size Matter? – Cross Country Empirical Evidence
A well known concept in production/cost theory relates to the operation of economies of scale (cost concept) or returns to scale (production concept), that is whether as output increases, the cost of production declines (economies of scale), increases (diseconomies of scale) or remains unchanged. Over the years, research has tried to explore the applicability of this concept to the production of banking services. The motivation behind larger banks being more scale efficient can be traced to a more efficient organisation of resources in large banks. For example, in small banks, where volumes cannot permit specialisation, the same machines and workers must often be employed for a variety of tasks such as tellers may be sorting cheques as well as auditing accounts part time. Large banks, on the other hand, may divide tasks so that employees and machines can be used in one facet of their operations. Similarly, some types of technological innovations such as computers may be economically more feasible for large banks. Kolari and Zardkoohi (1987) state that the law of large numbers accounts for certain scale economies. Large banks do not need to hold cash balances in the same proportion as smaller banks and hence to that extent, law of large numbers smoothens the transaction demand. Murphy examined the sources of economies of scale in the US banking industry, and suggested that for the processing of chequeing accounts, economies of scale arise partly from the use of different kinds of equipment and partly from the specialisation of labour and machines. The first systematic study of scale economies was undertaken by Alhadeff who compared the costs of Californian branch and unit banks of different size using data covering the period 1938-50. The study found that branch banks produced greater output per dollar resources than unit banks. However, these early studies were criticized for using an exclusive measure like earning assets as a measure of output which tended to inflate the average unit cost of large banks. Schweiger and McGee (1961) and Gramley (1962) experimented with total assets as measure of bank output and found that large banks have a cost advantage over small banks. Benston found the presence of economies of scale in banking by fitting Cobb Douglass cost function. Bell and Murphy (1968) found branching to be more costly than unit-banking operations. Greenbaum (1997) concluded that economies of scale were generally exhausted after banks exceeded US$ 10 million in asset size because of high overhead unit costs, high transactions costs, lack of sufficient specialisation and limited diversification. However, in the early 1980s, translog functional form emerged as a more stronger\theoretical alternative to the hitherto used Cobb Douglass Production Function approach as it allowed the adaptation of U-shaped cost curve and the computation of economies of scope. Benston et al found evidence of the existence of U-shaped cost curves for US banks. US unit banks with more than US$ 50 million in deposits recorded diseconomies of scale, while those operating in branching states experienced small economies of scale. White examined the production technology of credit unions in Canada and found that large multi- product credit unions were more efficient than small, single-product credit unions.
However, the scale economies hypothesis concerns the number of banks that can operate given existing cost and demand conditions. It tells little, however, about inequalities within the existing size distribution of banks.
References:
Bell, F. W. and N. B. Murphy. 1968. “Economies of Scale and Division of Labour in Commercial Banking.” Southern Economic Journal, 131-139, Oct.
Gramley L. E. 1962. A Study of Scale Economies in Banking. Federal Reserve Bank of Kansas City, USA.
Greenbaum. 1967. “A Study of Bank Cost.” National Banking Review, 415-434. June.
Kolari & Zardkoohi. 1987. Bank Cost, Structure and Performance. Lexington Books, Mass, USA.
Murphy. 1972. “Cost of Banking Activities: Interaction Between Risk and Operating cost: A Comment”, Journal of Money, Credit and Banking, 4, August: 14-15.
Schweiger and McGee. 1961. “Chicago Banking”, Journal of Business, 34(3): 203-366.
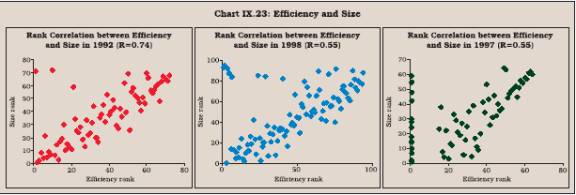
9.82 To sum up, the economic measures of efficiency and productivity substantiate the results arrived at through the accounting measures. That is, efficiency has improved across all bank groups when measured from a grand frontier for all banks for the period 1991-92 to 2006-07 and most of these efficiency gains have emanated after few years of reforms, i.e., from 1997-98 onwards.
9.83 Beginning with the efficiency levels in 1991-92, efficiency gains were found to be the largest for old private sector banks. However, since their efficiency levels were very low at the beginning of the reform period, they still continue to lag far behind the other bank groups. As of now, the new private sector banks as a group are the most efficient, followed by the State Bank, nationalised banks, foreign banks and old private sector bank groups. In the foreign bank group, there are several banks with very low efficiency score, which pulled down the overall efficiency score of foreign bank as a group. Otherwise, nine of the seventeen most efficient banks were in foreign bank category. Significantly, gains in the case of foreign and private banks were restricted to technical efficiency only. Allocative efficiency of these banks has always been high since the early 1990s. In the case of public sector banks, gains have been distributed over both technical and allocative efficiency. Relatively more gains in allocative efficiency of public sector banks could be attributed to recovery of past NPAs and improvement in credit risk environment as a result of which incremental NPAs declined sharply in the post-reform period.
9.84 The analysis also found a positive and significant relationship of efficiency with size and diversification. That is, large and diversified banks, in general, were found to be more efficient. The results also suggested that NPAs have a negative impact on efficiency.
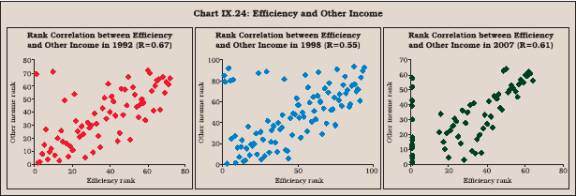
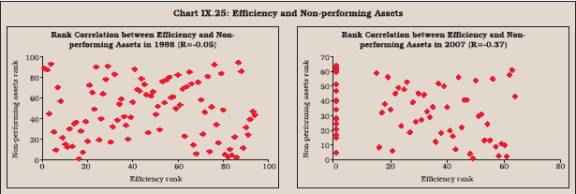
9.85 The analysis suggests that efficiency level has no definite relationship with ownership of banks, i.e., public or private in India. There are most efficient and least efficient banks both in the public and private sectors.
Box IX.9 Determinants of Efficiency of the Banking Sector in India
In order to ascertain the determinants of bank efficiency at aggregate level as well as bank group level, the panel least square model was used for the period 1996-2006. Technical efficiency for all the banks calculated from the grand frontier was utilised as the dependant variable, while total assets (as an indicator of the size of the bank), net non-performing assets to net advances (as a proxy for quality of management) and ratio of other income to total income (as a measure of diversification) were used as the explanatory variables. As per Hausmann test, random effects model was fitted for estimation.
The panel least squares estimates, which take into account relationship over the years, show that increase in total assets, a proxy for bank size, raises the technical efficiency. For one unit (Rs. 1 crore) increase in total assets, technical efficiency score increases by0.0003. In terms of bank groups also, size was found to bear a significant positive influence on efficiency, especially for old private and foreign banks (Table). The literature also suggests that technical efficiencydifferences among banks cannot be explained solely in terms of differences in scale. Technological, managerial and off-balance sheet items also have significant impact on technical efficiency. Panel estimates for the period 1996-2006 suggest that decline in quality of management (proxied by increase in net non-performing loans) reduces the level of technical efficiency. Understandably, as NPAs come down, banks may recycle available resources, including tangible (provisions) and intangible capital (human capital) from monitoring NPAs to more productive uses, thereby raising efficiency levels of banks. This is broadly supportive of bad management hypothesis. However, bank group-wise estimates do not reveal a uniform picture. While bad loans bear a significant negative impact on efficiency in case of public sector banks (State bank and nationalised banks), the variable was found to be insignificant in the case of private (old and new) and foreign banks. This may be attributed to better risk management practices in such banks, which helps them to keep their balance sheets clean.
Similarly, diversification has also been found to bear a significant influence on bank efficiency. Fee and consumer based activities and off-balance sheet exposure thus appeared to have generated economies of scope. This would suggest that traditional bank efficiency measures, excluding off-balance sheet activities, may not provide accurate evaluation of a bank’s condition.
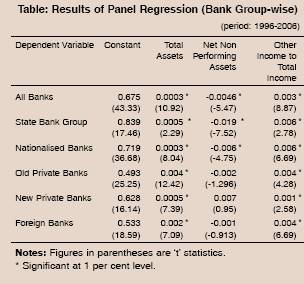
Box IX.10Malmquist Productivity Index
Three popular measures of total factor productivity used in the literature are Tornquist, Fisher and Malmquist indices.
Tornquist and Fisher use price information along with quantity data to construct indices of output and input. The ratio of the output and input quantity indices is the TFP index. However, both are descriptive measures of productivity change. Neither of the two measures requires the knowledge of the underlying production technology faced by the firm.
In contrast, the Malmquist Productivity Index (MPI) introduced by Caves, Christensen and Diewert (1982) is a normative measure that constructs a production frontier representing the technology and uses the corresponding distance functions evaluated at different input-output combinations for productivity comparison that is by comparing the proportion of output to input over two periods of time. The index ascertains up to what extent input in period 2 could be decreased by holding the output to the same level as in period 1. For computing the index, either of the periods could be taken as a reference point. In case technology in period 1 is taken as reference and computed value index exceed, it implies gain in productivity. On the other hand, index less than 1 indicates decline in productivity. An illustration using the one input and one output case is shown in Chart below.
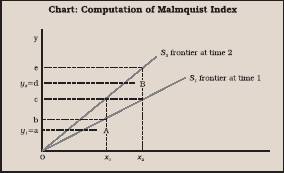
Points A and B represent observations in periods 1 and 2, respectively. The rays from the origin S1 and S2represent frontiers of production for periods 1 and 2, respectively. Relative efficiency of production at A compared to the frontier S1 (period 1) is d(y1, x1)=0a/ 0b. But compared with the frontier S2 (period 2), it is d2(y1,x1) = 0a/0c. The relative efficiency of production at B compared to the frontier S2 is d2(y2,x2) = 0d/0e. Compared with the frontier S1, the relative efficiency is d1(y2,x2) = 0d/0c. The Malmquist index of total factor productivity change is the geometric mean of the two indices based on the technology for periods 1 and 2, respectively. In other words:
M = [{d1(y1,x1) d2(y1,x1)}/{d1(y2,x2) d2(y1,x1)}]1/2 ...........(1)
Equivalently,
M=[d1(y1,x1)/d2(y2,x2)] [d2(y2,x2) d2(y1,x1)/d1(y2,x2) d1(y1,x1)]1/2 ...........(2)
Wherein, it is the distance function and the value of M in the Malmquist Productivity Index. A value greater than one (i.e., M>1) represents productivity growth, a value less than one (M<1) indicates productivity decline and M=1 represents no productivity change. Change in M represents two elements, i.e.,
M = ET
Where,
M = The Malmquist Productivity Index
E = A change in technical efficiency, i.e., change in output given the input between the period t and t+1 (the term outside the square bracket)
T = A measure of technological change in production technology (technological improvements) between the two periods (two ratios )
Reference:
Matthews, K., and M. Ismail, 2006. “Efficiency and Productivity Growth of Domestic and Foreign Commercial Banks in Malaysia.” Cardiff Business School Working Paper Series.
9.86 The productivity of the banking sector as well as various bank groups improved between 1991-92 and 2006-07. However, most of the gains resulted from the period 1997-98 onwards. The rise in productivity emanated primarily from technical progress (innovation) while banks, particularly in the public sector, were lagging behind in catching up/ absorption of enhanced technological capability into the system.
V. SOUNDNESS OF THE BANKING SECTOR IN INDIA
9.87 A key role of a country’s financial regulator is to limit the systemic risk - the risk that arises with the spread of problems related to a few institutions to other institutions that are otherwise solvent and liquid. The regulator accomplishes this task by ensuring that institutions are sound or adequately capitalised to withstand any unanticipated risks both due to its own operations or any disruptive market movements. However, with the growing globalisation of the financial sector, the concept of soundness has broadened. In addition to solvency, sound management today requires that the banks have in place systems and procedures that permit reaction with increased speed to market and price changes and also recover quickly from crisis that affects the system or the individual banks. This, in turn, requires that every bank evaluates the risks emerging from different operations and is able to map it into models of analytics, assumptions and parameters on which the risk exposure is predicated. For instance, in off-balance sheet deals, it is important to be aware of the soundness of counterparties with which the bank strikes the deals.
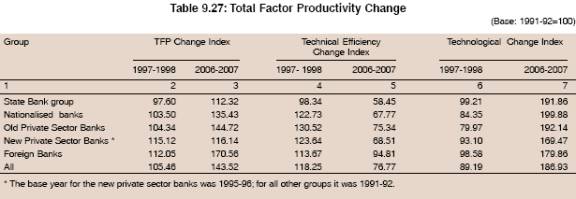

9.88 With the proliferation of new financial instruments and across the border activities of financial intermediaries, regulators are increasingly seized of the aspects related to the soundness of the banking system. Deregulation, market fluctuations, foreign exchange rate and interest rate volatility have provided a fertile ground for new financial instruments such as trading in swaps, options, futures and foreign exchange forwards as well as granting of standby commitments and letters of credit, collectively known as off-balance sheet items. Such instruments expose the institution to risk of accounting loss, which tends to exceed the amount recognised in the statement of financial position. It transfers risks to a different reference level due to a number of unknowns involved in off-balance sheet processes and consequently creates demands for novel risk management practices. Similarly, banks’ operations today are spread over internationally, enlarging their arena of risk exposure to new rules of game, behavioural risk of clientele, apart from the more traditional operational risk. Given the growing integration of financial operations across markets and economies, any eventuality in one market or economy can have potential domino effect on domestic financial systems. Thus, the significance of sound institutions has never been felt as strong as now. In this section, therefore, we assess the soundness of banking institutions in the country in terms of capital to risk-wighted assets ratio (CRAR). Since poor asset quality has the potential to erode the bank’s capital position, asset quality of banking institutions is also assessed.
Capital to Risk Weighted Assets Ratio (CRAR)
9.89 The capital adequacy ratio measures the amount of a bank’s capital in relation to its risk-weighted credit exposures and is most widely used measure of soundness of banks. It determines the capacity of a bank to withstand the unexpected losses arising out of its operations. The risk weighting process takes into account, in a stylised way, the relative riskiness of various types of credit exposures that banks have, and incorporates the effect of off-balance sheet contracts on credit risk. The higher the capital adequacy ratio a bank has, the greater the capacity it has to absorb the unexpected losses before becoming insolvent. It, thus, provides a “cushion” for potential losses, which protects the bank’s depositors or other lenders.
9.90 The CRAR of all the bank groups in India has improved over the years (Table 9.28). The CRAR of nationalised banks and old private sector banks, which was quite low at end-March 1996, gradually improved to more than 12 per cent by end-March 2007. On the other hand, the CRAR of State Bank group, new private sector banks and foreign banks was always above the minimum stipulated level of 8 to 9 per cent (9 per cent from March 31, 2000). In the case of new private sector banks, one bank reported significantly low CRAR, which pulled down the group average at end-March 2003. However, subsequently, the bank was merged with the healthier bank, thereby imparting strength to the system as a whole. 9.91 A cross-country comparison reveals that at the end of 2006, the capital to assets ratio (CAR) varied significantly among countries between 5 per cent and 16 per cent8 (Table 9.29). At the end of 2006, the capital to total assets ratio (CAR) in the banking system in most countries was more than 8 per cent. The CAR of banks in most of the developed countries ranged between 5 and 9 per cent. On the other hand, the CAR of banks in developing countries such as Mexico, Chile, Brazil and Russian Federation was at considerably higher levels. India’s CAR at 8.29 per cent compared favourably with several advanced and emerging market economies.

Asset quality
9.92 The soundness of a bank may be seriously impaired if its asset quality is poor. Non-performing assets require provisioning/write-off, which affects banks’ profitability and their ability to strengthen their capital position. In case the provisioning/write-off results in net losses, it could also erode bank’s capital position. Therefore, apart from sound capital position, it is necessary that banks maintain high asset quality. In India, non-performing assets of commercial banks gradually declined over the years (gross NPAs from 15.7 per cent at end-March 1997 to 2.5 per cent at end-March 2007 and net NPAs from 8.1 per cent at end-March 1997 to 1.0 per cent at end-March 2007). The most significant improvement in asset quality was observed in respect of nationalised banks, followed by old private sector banks and the State Bank group. As a result, net NPA ratios of all bank groups have converged to around 1 per cent (Chart IX.27 and Table 9.30). The improvement in the asset quality is all the more significant as income recognition, asset classification and provisioning norms were tightened periodically. The improvement in asset quality has been brought about by initiating several institutional measures such as balance sheet cleansing through compromise settlements of chronic non-performing assets, corporate debt restructuring, setting up of debt recovery tribunals and enforcement of security interest for realisation of dues without the involvement of judiciary.
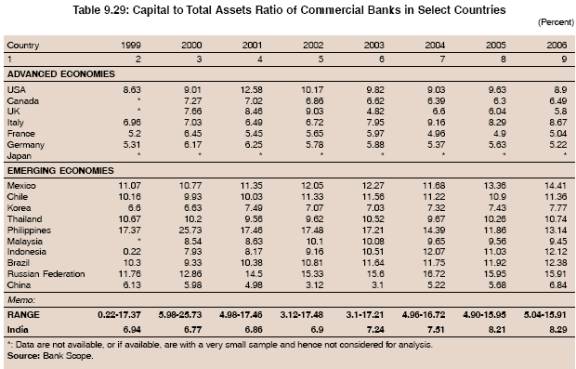
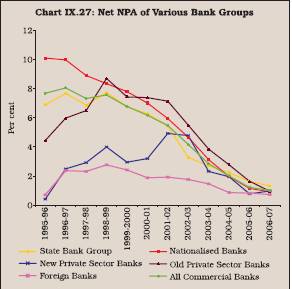
9.93 The ratio of impaired loans to gross loans, i.e., the ratio of non-performing assets (NPAs) to total advances declined in almost all the select countries studied during the period 1999-2006. The ratio of impaired loans to gross loans in India is currently comparable with most of the developed countries such as France, Germany and Japan and better than several EMEs such as Brazil,Thailand, Philippines, Malaysia and Indonesia (Table 9.31).
Relationship Between Efficiency and Soundness
9.94 Internationally,cost efficiency studies have been instrumental in detecting the symptoms of a bank failure, if any, ex-ante. This has saved costs on bailout and regulatory intervention. Various bank failure prediction models have been constructed around CAMELS as it serves as an effective warning system that can complement the on-site examination process by identifying troubled institutions that need early examination or possible intervention. Studies have found that banks on the verge of failure bear a history of low efficiency parameters such as low net profit per employee, business per employee, high non-performing assets, among others. This is also evident from the case study of a failed bank (Box IX.11)
9.95 A large body of research literature exploring relationship between asset quality and efficiency suggests four alternative hypotheses, namely, bad management, bad luck, skimping and moral hazard, as alluded to earlier. As per bad luck hypothesis, extraneous events may cause an increase in problem loans for the bank which, in turn, may lead to additional operating costs on the additional monitoring of delinquent borrowers, costs of seizing, maintaining and eventually disposing of collateral in the case of default, and additional costs of defending banks’ safety and soundness record to bank supervisors, among others. Thus, under this hypothesis, one expects increase in non-performing loans, would cause decline in measured cost efficiency. Poor management practices may result in increased operating expenses which may be reflected in low measured cost efficiency immediately. Managerial lacunae may also result in inadequate loan underwriting, monitoring and control, poor credit scoring and choice of relatively high proportion of loans with low or negative present values. This is the bad management hypothesis and under this, low cost efficiency is expected to cause higher non-performing loans.
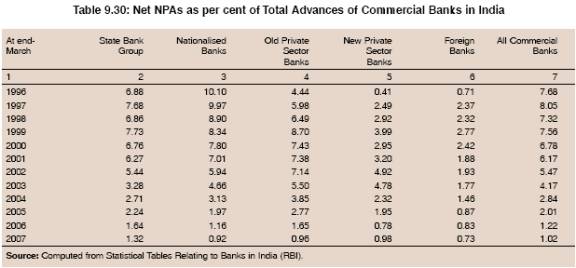
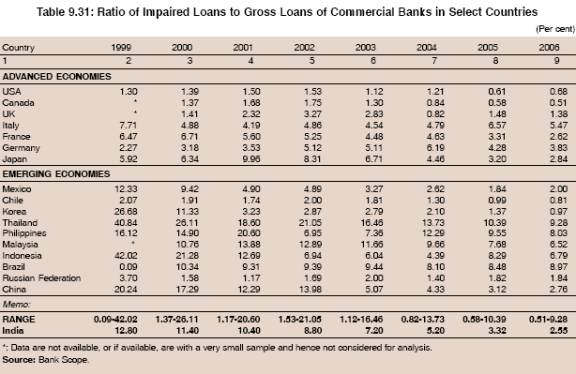
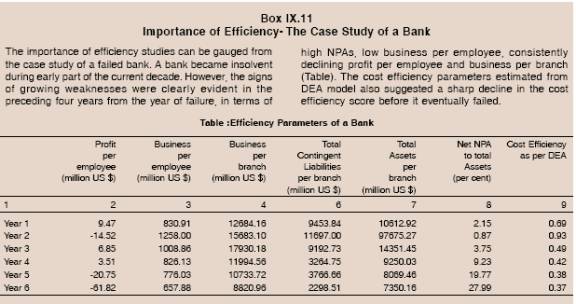
9.96 In terms of the skimping hypothesis, a bank may be cost efficient in the short run due to saving on resources devoted to underwriting and monitoring loans but only at the cost of future loan performance problems. Hence, under this hypothesis, low cost efficiency may be positively related to loan quality. The moral hazard hypothesis, as the name suggests, indicates tendencies of banks with low capital to assume greater risk, leading to higher non-performing loans. Hence, under this hypothesis, low financial capital may cause high non-performing loans.
9.97 The empirical tests reveal that both bad luck and bad management hypotheses are significantly valid for Indian banks. That is, poor macroeconomic performance results in an increase in NPAs and impinges on efficiency. Poor quality of management also results in higher non-performing loans (Box IX.12). 9.98 To sum up, the analysis of soundness indicators suggests that the CRAR of various bank groups improved significantly in the post-reform period. The ratio for the banking industry at end-March 2007 at 13 per cent and for various bank groups in the range of 12-14 per cent was significantly higher than the stipulated level of 9 per cent. The strengthening capital position was accompanied by a significant improvement in asset quality. Net NPAs of the Indian banking sector are now at the global levels. The empirical analysis revealed that both macroeconomic developments and quality of management affect the efficiency of the banking sector. That is, poor macroeconomic performance and poor quality of management result in low efficiency.
VI. FACTORS BEHIND THE IMPROVEMENT IN EFFICIENCY AND PRODUCTIVITY
9.99 The improved efficiency and productivity of the Indian banking sector in the post-reform period was due to several structural changes. The emergence of private sector banks and their growing significance in the overall structure has played a crucial role. From the very beginning, new private sector banks have been more efficient than many of
Box IX.12 Efficiency and NPAs Relationship in India
In order to test for the presence or absence of the four alternatives hypotheses, i.e., bad luck, bad management, skimping and moral hazard, explaining relationship between asset quality and efficiency, Granger causality tests were conducted based on the panel VAR with technical efficiency (TE) and net non-performing assets (NNPA) as the variables. The period for the study was 1996-2006. The Granger causality results show that NPAs Granger cause efficiency and vice-versa, implying that both bad luck and bad management hypotheses were significantly true for Indian banks for the period under review (1996-2006).
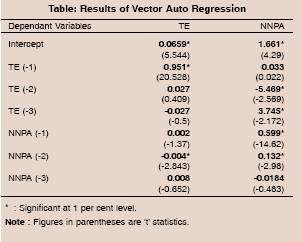
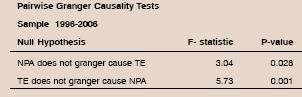
the existing public sector, old private sector and foreign banks. The share of private sector banks in the industry gradually increased from 1.5 per cent at end-March 1996 to 16.9 per cent by end-March 2007. Therefore, as the share of new private sector banks rose, the overall efficiency of the banking sector improved. Besides, increased competition also put pressure on other banks to improve their performance, resulting in the overall efficiency of the banking sector. Owing to increased competition, banks’ margins, especially in recent years, have come under pressure. Banks have endeavoured to counter these by expanding volumes, seeking non-interest sources of income and by improving operational efficiency. India has moved on to a higher growth trajectory. The robust economic growth has not only enabled banks to increase credit volumes but has also resulted in improved credit risk environment as a result of which the incremental NPAs have declined sharply. Banks have also been able to recover their past dues, encouraged by robust macroeconomic environment and various institutional measures initiated by the Central Government and the Reserve Bank. These factors have played a major role in improving the efficiency and profitability of the banking sector. 9.100 Increased application of technology also appeared to have played an important role in improving efficiency and productivity of the banking sector. Progress after 1997-98 was directly traceable to several technological changes that have taken place on a continuous basis. These include improvements in payment and settlement systems, customer service, internal controls and audit. Beginning with the MICR cheque clearing system, the Indian retail payment system got a major boost during the reform period with the introduction of technologically advanced and secure systems such as electronic fund transfer, electronic clearing system, the special EFT and card based systems that greatly enhanced efficiency levels in banking operations. The introduction of RTGS helped improve the cash management by banks. Another technology induced cost effective initiative was the introduction of virtual banking services through the establishment of ATMs, shared ATM networks, smart cards, stored-value cards, phone banking and ultimately internet and intranet banking. These services economised on the staff and branch infrastructure expenses and also boosted the volume of transactions per unit of input used. The Reserve Bank also operationalised the Very Small Aperture Terminal (VSAT) network to provide reliable communication backbone to the financial sector. To facilitate connectivity within the banking sector, the Reserve Bank, public sector banks and IDBRT collectively set up the Indian Financial Network (INFINET) based on satellite communication. Currently, INFINET is being migrated to a multi-protocol layer switching technology that offers economies of scale, apart from ease of operation. Such technological changes led to outward shift in the production frontier of banks.
9.101 As regards bank groups, the State Bank group and nationalised banks adopted technology long after foreign and new private sector banks. Hence, while foreign banks were mostly defining the grand technological frontier of the Indian banking system, public sector and nationalised banks closely pursued the frontier to stay competitive. Many public sector banks also computerised their branches and introduced core banking solutions. Although in the initial years, it pushed up the cost, it however, appeared to have resulted in cutting operating cost and improving efficiency in the subsequent years. New private sector banks such as ICICI Bank and HDFC Bank were relatively better off due to their access to the frontiers of technology assisted by foreign direct investment. 9.102 The Indian banking sector also witnessed several mergers and acquisitions in the post-reform period. As a result, merged entities have become large in size and able to reap the benefit of economies of scale. Diversification of banking business has been another factor which has contributed to the increased efficiency. One of the major elements in diversification of income was trading profits from treasury operations made during 2001-02 to 2003-04.
9.103 All interest rates, barring savings deposits, loan up to Rs. 2 lakh and export credit, have been deregulated. Deregulation of interest rates has enabled banks to price the products keeping in view the risk and return perceptions. It also enabled banks to introduce innovative deposit products. Significant reductions in the statutory pre-emptions in the form of CRR and SLR during the latter half of the 1990s and the early part of the current decade freed the resources of the banks to be deployed in the market9. Besides, the introduction of auction system for government securities also enabled banks to earn a market related interest rates on their SLR investments. These relaxations allowed banks to seek for more profitable avenues of business. With rapid economic growth and deregulation of the credit market, new sources of credit such as housing loans, auto loans, educational loans, have emerged in a big way and banks have been able to expand their retail loan portfolio significantly. As retail loans fetch higher interest rates than conventional loans, banks were able to improve their net interest income and shore up their profits.
9.104 The structure of assets and liabilities also has implications for the efficiency of banks. Not all the liabilities of the banks carry the same cost. Short-term liabilities are less expensive than medium and long-term liabilities. Medium to long-term liabilities are also more interest rate sensitive than short-term liabilities. As discussed in Chapter IV, the share of short-term deposits (i.e., with maturity less than 1 year) in total deposits increased gradually to 40 per cent by 2006 from 13 per cent in 1990. On the asset side, banks now extend loans not only for working capital finance but also for medium and long-term purposes. The share of medium and long-term in total loans increased from 17.4 per cent at end-March 1995 to 53.9 per cent by end-March 2007. To the extent banks extend medium and long-term loans, they do not have to take the onus of cash management, which entails both financial and administrative costs. Medium and long-term loans are also more expensive than short-term working capital finance, i.e., they are more beneficial to banks. Thus, the shortening of the maturity profits of liabilities on the one hand, and the lengthening of asset profile on the other, have enabled banks to improve their profitability. This may have implications for asset liability management and the banks may be trading off between risk and return. However, in the international context, it has been seen that banks that are good at operations are also good at risk management. It is, therefore, believed that improved efficiency is not at the cost of risk management.
9.105 The improvement in the performance of public sector banks, in particular, has been a major factor in the overall improvement of the banking sector. Almost all public sector banks have gone public and raised capital from the market after the Banking Companies (Acquisition and Transfer of Undertakings) Acts 1970/ 1980 were amended in July 1994. Earlier, the State Bank of India (SBI) Act, 1955 was amended by promulgating an Ordinance in October 1993 to enhance the scope of the provision for partial private shareholding. This has not only strengthened their capital structure10 , but has also subjected them to market discipline which has encouraged them to improve their efficiency. As alluded to earlier, well capitalised and publicly traded banks tend to be more efficient. After the introduction of prudential norms in the early 1990s, twelve public sector banks reported net losses (14 banks in all). By 1999-2000, however, all the loss-making public sector banks were able to turn around. This helped in improving the overall efficiency of public sector banks as a group. Between November 15, 2000 and March 31, 2001, all public sector banks barring Corporation Bank, introduced voluntary retirement scheme. About 12 per cent employees took the offer before March 2001. This enabled the banks to rationalise the labour force which had a significant positive impact on the productivity of public sector banks.
9.106 Corporate income tax rates have also been brought down significantly over the years, which have resulted in improvement in the overall profitability of the banking sector.
9.107 On the whole, the confluence of several well articulated and some fortuitous factors contributed to the improved efficiency and productivity of the banking sector.
VII. THE WAY FORWARD
9.108 The analysis in the previous sections suggests that efficiency/productivity of the banking sector on the whole and of the various bank groups has improved significantly over the years. However, there is considerable scope for further improvement. Some of the areas which need attention by the banks are set out below.
Need to Reduce Intermediation Cost
9.109 The intermediation cost of the banking sector in India has come down significantly, reflecting the growing competitive pressures. However, the intermediation cost for banks, in general, in India is still high as compared with the banking systems in other countries. While the intermediation cost of all bank groups was high, it was particularly high for the foreign banks group11. High intermediation cost can affect the level of investment and hurt growth. The high intermediation cost also results in misallocation of resources as the borrower in order to cover the increased cost could choose the riskier projects, resulting ultimately into NPAs for the banking sector. Thus, high intermediation cost hurts both the banking sector and the economy. Banks, therefore, need to make concerted efforts to bring down the intermediation cost further to the global levels.
Need to Bring Down the Operating Cost
9.110 One of the major reasons of high intermediation cost is the high operating cost. Although banks have been able to bring down the operating cost, the operating cost to income ratio for all bank groups is still not in sync with the international best practice. The cost to income ratio of all bank groups was more than the best practice norm of 40 per cent (Ghosh, C.R, 2004). The lowest cost to income ratio was 45 per cent for foreign bank group, while the ratio of all other bank groups was more than 50 per cent. In order to reduce the intermediation cost and yet sustain profitability, it is necessary that banks bring down the operating cost. Technology can play a major role not only in reducing operating cost but also improving productivity. Banks, therefore, need to look at technology both from the point of view of increasing labour productivity and cutting operating cost in the long run. About 15 per cent of State Bank group branches and 20 per cent branches of nationalised banks are yet to be computerised. This needs to be pursued vigorously. As public sector banks complete the computerisation of remaining branches and implement core banking solutions, non-labour costs are expected to move up initially. However, in the long run, it should help bring down the operating costs.
Need to Improve Labour Productivity in Public Sector Banks
9.111 A major reason for high operating cost for public sector banks is the low labour productivity. Although the labour productivity of public sector banks has improved, it continues to be far below that of foreign banks and new private sector banks. Public sector banks, therefore, need to look into various aspects of labour productivity and take necessary measures to improve it further. Banking has become a very complex business and in order to survive competition, banks are required to introduce new products. Risk management is also becoming increasingly complex. Thus, the development of human resource skills assumes significance and public sector banks need to pay greater attention to the training requirements of their staff. Another factor which needs urgent attention is the pay structure in public sector banks. At present, the pay structure in public sector banks is fixed at industry level, irrespective of the capacity of a particular bank to pay and its efficiency level. This needs to be looked into.
Need to Increase Non-Interest Sources of Income
9.112 Banks’ main source of income is net interest income, which provides stability to earnings. However, non-interest sources of income can help in sustaining the earnings. This is particularly the case when activity of non-interest source of income and the main activity are negatively co-related. At present, banks’ non-interest sources of income constitute very small portion of their total income. This is particularly so in the case of public sector banks as their non-interest income ratio in 2006-07 was more or less at the same level as in 1991-92, although there were periods (between 2001-02 to 2003-04) when non-interest income ratio improved significantly mainly due to trading profits on Government securities. As net interest income margins are expected to come further under pressure in future, banks need to seek newer non-interest sources of income to sustain their profitability.
Need to Improve Overall Efficiency and Productivity Further
9.113 DEA estimates indicate considerable improvement in the efficiency of the banking sector with efficiency score rising from 0.42 in 1992 to 0.71 in 2007 (the maximum achievable efficiency level being 1.0). There is also evidence that banks in the public and private sectors are gradually catching up with their more efficient peers. However, the banking sector is still below the efficiency frontier and there is a scope to save inputs by 29 per cent to produce the existing level of output. At the individual bank level efficiency scores/levels vary considerably from as low as 0.38 to the maximum level of 1.0. Of the 81 banks, only 17 banks were on the efficiency frontier, while all other banks were below the efficiency frontier. Of these, as many as 22 banks operated at two-thirds of the feasible efficiency level, while four banks operated at less than one half the level of the most efficient banks in industry. These banks are in the private and foreign bank segments. The need is to bring improvement in the efficiency of all those banks which are far away from the efficiency frontier by identifying the underlying causes of their low efficiency.
9.114 The rising efficiency levels were accompanied by impressive growth in productivity as well. Productivity of the banking sector rose by more than 40 per cent between 1991-92 to 2006-07 with growth being more pronounced in the case of private sector banks. However, in general, growth in productivity was largely the result of innovation or technological progress while absorption of this enhanced technological progress in most of the banks lagged behind. Given this, the issue that needs to be asked is as to whether productivity improvements built just on the strength of technology are sustainable. The need is to achieve higher levels of technical efficiency. For this, it is necessary to focus on bringing appropriate changes in processes and improve human resource skills.
VIII. SUMMING UP
9.115 In an increasingly globalised and competitive world, it is imperative that financial institutions not only follow global practices, but also that they are globally competitive, efficient and sound. In order to achieve this objective, India initiated financial sector reforms, of which the banking sector was the key component. Reforms are now one and half decades old and the question needed to be asked as to how the banking sector has responded to the changed operating environment. Keeping this in view, a detailed analysis of efficiency, productivity and soundness of the banking sector in India was attempted in this chapter. The focus was to assess the efficiency, productivity and soundness parameters in the post-reform period for the entire banking sector as well as various bank groups. Besides, the analysis attempted to answer the three specific questions: (i) Are private sector banks more efficient than public sector banks? (ii) Are large sized banks more efficient than small banks? (iii) Are diversified institutions more efficient than those which specialise in niche areas? The analysis was conducted using the conventional accounting measures (ratio analysis) and economic measures.
9.116 The accounting measures revealed that there has been an all-round improvement in the productivity/efficiency of the banking sector in the post-reform period. At the time of initiation of financial sector reforms, most of the efficiency ratios did not compare well with the banks in most advanced countries and emerging market economies. The performance of the banking sector, especially nationalised banks, worsened in the initial years of reforms as they took time to adjust to the new environment. However, a distinct improvement was discernable thereafter, especially beginning 2001-02. As a result, various efficiency/productivity and soundness parameters have moved closer to the global levels. The most significant improvement has taken place in the performance of public sector banks, as a result of which the performance of various bank groups has now converged with that of foreign banks and new private sector banks in respect of most of the parameters.
9.117 The intermediation cost as also the net interest margin declined across the bank groups. Despite this, however, the profitability of the banking sector improved. Thus, it is not the higher interest rate spreads but rather increased efficiency that led to higher profitability. While competitive pressures led banks to finely price their products, increased volumes resulting from robust economic growth and large trading profits from treasury operations during 2002-03 to 2004-05 also enabled banks to sustain their profitability. Business per employee and per branch also increased significantly across the bank groups. As a result of all these factors, return on assets and return on equity improved during the post-reform period.
9.118 The improvement of various accounting measures, however, varied across the bank groups. In terms of cost ratios (operating cost to income), foreign banks were more efficient than domestic banks. Similarly, in terms of labour productivity also foreign and new private banks were ahead of their peer groups. Labour productivity reflected by business per employee in public sector banks was about one-half of that of industry’s best performers, viz., foreign banks and new private banks. The apparent reasons could be traced to the transaction size, which is significantly large in the case of foreign and private sector banks as they deal largely with premium corporates and high net worth individuals.
9.119 In terms of net interest margins and intermediation cost, new private sector banks and public sector banks, respectively, were more efficient than the other bank groups. The cost of deposits of foreign banks in the industry was the lowest. However, this was not passed on the borrowers, leading to higher net interest spread. The empirical exercise suggested that the operating cost was the main factor affecting the net interest margin. Non-interest income and asset quality were the other determinants of net interest margin.
9.120 Efficiency and productivity based on economic measures corroborated the findings of the accounting measures or financial ratios. That is, efficiency has improved across all bank groups when measured from a grand frontier for all banks for the period 1991-92 to 2006-07 and most of these efficiency gains have emanated after few years of reforms, i.e., from 1997-98 onwards. The analysis suggests that in the Indian context, there is no relationship between ownership and efficiency. That is, most efficient banks were from all the three segments, i.e., public, private and foreign. Most of the 30 banks that were at the bottom, in terms of efficiency, belong to the private sector. The evidence, however, suggests that size has a significant relationship with efficiency. That is, large banks were found to be more efficient. Similarly, diversified banks were also more efficient than not so diversified banks. The analysis also suggests that non-performing assets had a negative impact on efficiency. Productivity in banks rose many fold largely driven by technological innovation and enabling policy environment. However, while some domestic banks, especially public sector and new private sector banks, were able to reach the enhanced output potential, some other domestic banks were not able to catch up or utilise the enhanced output potential resulting from technological innovations. There are a number of inter-related factors, which in the backdrop of enabling policy environment, facilitated the growth in efficiency/productivity.
9.121 The soundness of the banking sector as well as all bank groups in terms of CRAR also improved over the years. There has also been significant improvement in the asset quality of banks, which is now close to the global levels. Providing evidence for both bad luck and bad management hypotheses, the analysis showed that macroeconomic factors as well as management skills affect asset quality in India.
9.122 Notwithstanding significant improvement, there are several areas which need attention of banks. The intermediation cost in India is still high as compared with banks in many other countries and banks should strive to bring it down to the global levels. Net interest margin of foreign banks, in particular, was very high. Their cost of funds is significantly lower than that of other bank groups. However, the low cost is not being passed on to the borrowers. The high intermediation cost of banks in India, to a large extent, was due to high operating costs. The need, therefore, is to bring down the high operating costs. One area of concern for public sector banks is the business per employee, which is almost one half of new private sector banks. Public sector banks, therefore, should strive to improve labour productivity and bring it on par with new private sector banks. Non-interest sources of income constitute a very small share in total income of banks in India. In future, net interest margins are likely to come under pressure. Banks, therefore, need to seek new non-interest sources of income to sustain their profitability. Although overall efficiency and productivity have improved, there is evidence to suggest that resources are not being utilised in the most efficient manner. That is, banks can increase output by reducing significantly the level of inputs. Several banks operated at the three-fourths of the efficiency levels of the most efficient banks. A special attention, therefore, needs to be paid to improve the efficiency of the least efficient banks by identifying the underlying causes. Similarly, there is a need for increased absorption of enhanced technological capability (innovation) by several banks to further augment productivity of the banking sector. This would call for changes in processes and improvement in human resource skills.
9.123 The challenge in future for the banking sector in India is to bring down the intermediation cost and at the same time maintain high profitability. This can be achieved only by improving efficiency and tapping non-interest sources of income. Higher efficiency and productivity of the banking sector could lead to enormous benefits for the resource allocation and growth potential of the real economy.
Appendix
IX.1 Accounting Versus Economic Measures of Efficiency
Accounting Measures of Efficiency
Financial managers frequently resort to ratio analysis to assess the performance of business units. Some of the most frequently used ratios are liquidity ratio, return on assets (RoA), return on equity (RoE), among others. These ratios are computed from various items in balance sheet and profit and loss statement/income-expenditure statement. While in financial management, these ratios are not termed as accounting measures, economic literature on estimating productivity and efficiency terms them as accounting measures as these ratios are essentially computed from certain accounting entries in financial statements. These ratios are highly popular in financial analysis, even in economic literature, mainly on account of the ease with which they can be understood. Nonetheless, it needs to be recognised that these ratios are only relative measures of productivity and at best can only partly indicate the efficiency of business units. Moreover, these ratios may lead to the danger of imputing economic significance to accounting numbers. Further, they also suffer from accounting biases. That is, the accounting practices and norms in different economic environments can be significantly different and hence, comparison between the ratios computed from two business units operating in differing economic environments may not be suitable for drawing economic conclusions. Nonetheless, the popularity of the ratio analysis emanates on three counts. One, as long as accounting biases remain more or less the same over the years, meaningful inferences can be drawn by examining trends in raw data and financial ratios. Two, since similar biases characterise various firms in the same industry, inter-firm comparisons are useful. Three, experience seems to suggest that financial analysis ‘works’ if one is aware of accounting biases and makes adjustments for the same (Chandra, 2004). Further, their popularity also emanates from the fact that most of the supervisory systems across the globe have put in place regulatory frameworks (such as CAMELS rating) based on these ratios. In addition, some parametric and semi-parametric survival models such as extension of Cox Partial Hazards Model to banks also use these financial ratios for estimating regression outputs. Since it is difficult to precisely measure the productivity and efficiency of banks with accounting measures, alternative techniques, which compute total factor productivity of the banking unit, have evolved over the years.
Economic Measures of Efficiency
Modern efficiency measurement begins with Farell (1957) who drew upon the work of Debreu (1951) and Koopmans (1951) to define a simple measure of firm efficiency which could account for multiple inputs. Farell proposed that efficiency of a firm consists of two components, namely, technical efficiency which reflects ability of a firm to obtain maximal output from a given set of inputs, and allocative efficiency which reflects ability of a firm to use inputs in optimal proportions, given their respective prices. These two measures are then combined to provide a measure of economic efficiency. Economic efficiency, in turn, has two variants viz. cost efficiency and revenue efficiency. Cost efficiency is estimated through ‘input oriented approach’ wherein cost is minimised, while revenue efficiency follows ‘output oriented approach’ and the objective is to maximise revenue.
Output-oriented technical efficiency : Given the input bundle, the maximum output producible from the same input bundle measures the output oriented technical efficiency. Suppose that * is the maximum value of such that (xt, yt) lies within the technology set. Then y* = *yt and the output-oriented technical efficiency of firm t is TEt = TE (xt, yt) =1/ *. The output oriented measure of technical efficiency is obtained as
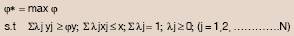
Input- oriented technical efficiency: Under this, output bundle of the firm may be treated as an assigned task and the efficiency of the firm is judged by the maximum equiproportionate reduction in all of its inputs without reducing the output. It is measured as s.t S

Cost Efficiency: In measuring the input oriented technical efficiency, all inputs are treated equally and the objective is to reduce all inputs by the same proportion. If some inputs become non-substitutable beyond point that is the input becomes binding, then further reduction in any other input is not feasible. But when input prices are available, reducing the more costly input assumes a greater priority than reducing the less costly ones. In other words, cost efficiency measures the cost performance of a banking firm relative to the best practice (least cost) bank that produces the same output under exogenous conditions. Hence, the objective function in this case becomes minimising the cost of the target output bundle. C* = min w’x s.t S j yj = y; S jxj = x; S j = 1; j = 0; (j = 1,2, ………….N)
Revenue Efficiency: In the measurement of output-oriented efficiency, the objective is to achieve the maximum rate of increase that would be feasible for all outputs. But as in the case of inputs, some outputs are more valuable than others, when output prices are available.
Various efficiency measures could be estimated with broadly two types of approaches - parametric and non-parametric approach.
Parametric: There are three main parametric approaches to the estimation of best practice frontier as explained below:
i) Stochastic frontier approach: In this approach, the cost, profit or production function of the most efficient producers is estimated and an institution’s deviation from the frontier comprises two components, a random error and an inefficiency term. The part of the error term which represents deviations from the frontier is assumed to be drawn from a two-sided distribution, while the inefficiency is assumed to be drawn from a one-sided distribution, because inefficiency increases cost. The stochastic frontier approach can be estimated using cross-sectional data.
ii) Distribution free approach: Under this approach, efficiency differences are assumed to be stable over time, but no specific distributional assumptions are required (Goddard, Molyneux and Wison; Wiley 2001). The estimate of inefficiency for each firm is the difference between its average residual and the average residual of the firm on the frontier, with some truncation performed to account for the failure of the random component to average out to zero. Estimation through distribution free approach model requires panel data set.
iii) Thick frontier approach: The thick frontier approach (TFA) assumes that deviations from predicted costs within the lowest average-cost quartile of banks in a size class represent random error. Deviations in predicted costs between the highest and lowest quartile represent productive inefficiencies (Goddard, Molyneux and Wison; Wiley 2001). This approach imposes no distributional assumptions on either the inefficiencies or the random error. The TFA itself does not provide exact point estimates of efficiency for individual firms, but does provide an estimate of the overall level of efficiency.
Non-parametric: The main non-parametric approaches are data envelopment analysis (DEA) and free disposal hull (FDH). DEA employs mathematical programming to construct a best practice frontier from the observed data and to measure efficiency relative to the constructed frontier. The DEA does not require output or output prices for identifying the best practice production frontier. The best practice frontier is identified as piece-wise linear combination that connects the set of best practice observations, given the specifications of inputs and outputs. The outcome is to produce a convex production frontier for output oriented DEA and concave production frontier for input oriented DEA (Berger and Humphrey, 1997). As a consequence, DEA efficiency score for a decision making unit (DMU) is not defined by an absolute standard but is defined relative to other forms (Refer Box IX.6).DEA generates a within sample efficiency score between 0 and 1, with 1 being the most efficient.
Under FDH approach, the assumption of convexity is dropped and it is expected to allow for a better approximation of observed data and generate larger efficiency estimates than DEA. However, a significant advantage of DEA is that it does not superimpose a particular functional form on the data in determining the most efficient decision making units and so captures the interplay between inputs and outputs of different dimensions. On the other hand, DEA’s major shortcoming is that it assumes data to be free of measurement error and could, therefore, give inaccurate results if the integrity of data is not assured (Avkiran; 1998).
References:
Gomez-Gonzalez, Jose E., Nicholas M. Keifer (2006): Bank
Failure: Evidence from the Colombian Financial Crisis, Cornell University, Ithaca, New York.
Indian Institute of Banking and Finance (2005): Financial Management, Macmillan, Mumbai.
Prasanna Chandra (2004): Financial Management: Theory and Practice, Tata McGraw Hill, New Delhi.
Reserve Bank of New Zealand: Capital Adequacy Ratios for Banks – Simplified Explanation and Example of Calculation.
|