| I. Macroeconomic Outlook Aggregate supply conditions are improving. This augurs well for demand ahead of the festival season. Consumer price inflation is ruling above the upper threshold around the target. Monetary policy has moved into the withdrawal of accommodation mode and remains focussed to ensure that inflation returns to the target while supporting growth. The daunting global environment imparts considerable uncertainty to the outlook. I.1 Key Developments since the April 2022 MPR Since the release of the April 2022 Monetary Policy Report (MPR), the global economic environment has been marked by slowing growth with rising risks of recession, elevated inflationary pressures, and tightening financial conditions engendered by aggressive and synchronised monetary policy actions and stances. For emerging market economies (EMEs), these developments have translated into currency depreciations brought on by a surging US dollar and capital outflows, leading to reserve losses. The conflict in Ukraine lingers on and the pandemic continues to weigh on economic activity even as issues in green transition, real and financial fragmentation, trade restrictions and reshoring pose formidable challenges to the global economy. Financial markets remain volatile and global spillovers pose significant headwinds. Brent crude prices remain at elevated levels, given the tight demand-supply balance, despite recent correction. Global food prices have declined by 14 per cent from an all-time high in March but are ruling 8 per cent over last year’s level1. The Bloomberg commodity index was 10 per cent higher on September 27 (year-on-year (y-o-y) basis), notwithstanding some easing since June. Sovereign bond yields have hardened and reached multi-year highs in major advanced economies (AEs) as investors brace for the future course of monetary policy across the world. Yield curves have inverted, foretelling future recession. Equity markets in AEs and EMEs corrected sharply by 21 per cent and 18 per cent, respectively, since end-March (upto September 27, 2022) amidst high volatility. In currency markets, the US dollar has strengthened to a 20-year high while all other major currencies have depreciated. Turning to the domestic economy, real gross domestic product (GDP) rose by 13.5 per cent (y-o-y) in Q1: 2022-23, driven by base effects, even as momentum slipped due to the drag from net exports and restrained government spending. Aggregate supply conditions have been steadily improving and this augurs well for demand, both urban and rural, ahead of the festival season. The late pick-up in south-west monsoon and the recent spread of it to deficient regions is enabling a catch-up in kharif sowing, though paddy and pulses remain undersown relative to a year ago. Manufacturing is steadily gaining strength and services are posting strong growth, led by contact-sensitive sectors. Inflationary pressures, however, persisted at elevated levels during H1:2022-23 and remain a key policy concern. Consumer price index (CPI) inflation has been at or above the upper tolerance threshold of 6 per cent since January 2022, driven by adverse supply shocks emanating from geopolitical tensions. While inflation has eased from its April peak of 7.8 per cent, it remains at unacceptably high levels. In order to anchor inflationary expectations and contain the second round effects, the Reserve Bank of India (RBI) narrowed the policy corridor in April and the Monetary Policy Committee (MPC) increased the policy repo rate by 140 basis points (bps) during May-August. Monetary policy remains focussed on withdrawal of accommodation. Monetary Policy Committee: April-September 2022 During April-September 2022, the MPC met four times, including an off-cycle meeting in May 2022. At the time of the MPC meeting in April 2022, the global economic and financial environment had turned challenging due to the sharp jump in international commodity prices and uncertainties around the pace of monetary policy normalisation globally. CPI inflation was at or above the upper threshold of 6 per cent for two successive months in January and February 2022. The MPC assessed that the ratcheting up of geopolitical tensions, the generalised hardening of global commodity prices, the likelihood of prolonged supply chain disruptions, dislocations in trade and capital flows, divergent monetary policy responses and volatility in global financial markets posed sizeable upside risks to the inflation trajectory and downside risks to domestic growth. Accordingly, the inflation forecast for 2022-23 was raised by 120 bps (relative to the February 2022 projections) to 5.7 per cent while the real GDP growth forecast was revised downward by 60 bps to 7.2 per cent. Faced with the twin challenge of high inflation and worsening growth outlook, the MPC decided to keep the policy repo rate unchanged at 4 per cent. Although still accommodative, the stance of monetary policy focused on withdrawal of accommodation to ensure that inflation remains within the target going forward, while supporting growth. Concomitantly, the Reserve Bank introduced the standing deposit facility (SDF) at 40 bps above the fixed rate reverse repo rate as the floor of the liquidity adjustment facility (LAF) corridor, thus making the corridor symmetrical with a width of +/- 25 bps around the policy repo rate (see Chapter IV).2 With the CPI inflation print of March 2022 rising sharply to 7 per cent and significant upside risks to the near-term trajectory from higher food, crude oil and commodity prices materialising due to geopolitical tensions and sanctions, the MPC decided to hold an off-cycle meeting in May 2022. It noted that while economic activity was resilient, inflation at elevated levels warranted resolute and calibrated steps to anchor inflation expectations and contain second round effects. The MPC voted unanimously to increase the policy repo rate by 40 bps and reiterated the stance as set out in the April resolution. By the June 2022 MPC meeting, CPI inflation had risen further to 7.8 per cent in the April 2022 print, with considerable uncertainty around the outlook on account of the geopolitical situation. The MPC was of the view that continued shocks to food inflation, elevated international crude oil prices and pending pass-through of input costs to selling prices were likely to sustain pressures on headline inflation. Accordingly, the inflation forecast for 2022-23 was revised upwards by 100 bps from the April meeting to 6.7 per cent. Against this backdrop, the MPC judged that there was a need for calibrated monetary policy action to keep inflation expectations anchored and restrain the broadening of price pressures. Accordingly, it unanimously decided to increase the policy repo rate by 50 bps. The MPC focused the stance of policy on withdrawal of accommodation. At the time of the MPC’s August 2022 meeting, CPI inflation had eased to 7 per cent during May-June 2022 from 7.8 per cent in April but remained above the upper tolerance threshold of 6 per cent. The MPC observed that while there was some let up in global commodity prices, spillovers from geopolitical shocks were imparting considerable uncertainty to the inflation trajectory. Domestic economic activity was seen as resilient. With inflation projected to remain above the upper tolerance level of 6 per cent through the first three quarters of 2022-23, entailing the risk of destabilising inflation expectations and triggering second round effects, the MPC was of the view that further calibrated monetary policy action was needed to contain inflationary pressures, pull back headline inflation within the tolerance band closer to the target, and keep inflation expectations anchored to ensure sustained growth. Accordingly, the MPC unanimously decided to increase the repo rate by 50 basis points and maintained its stance of June 2022 with a majority of 5 to 1. The MPC’s voting pattern reflects the diversity in individual members’ assessments, expectations and policy preferences, a characteristic also reflected in voting patterns of other central banks (Table I.1). Macroeconomic Outlook Chapters II and III analyse macroeconomic developments related to inflation and economic activity during H1:2022-23 (April-September). The evolution of key macroeconomic and financial variables over the past six months warrants revisions in the baseline assumptions (Table I.2). | Table I.1: Monetary Policy Committees and Policy Rate Voting Patterns | | Country | Policy Meetings: April-September 2022 | | Total meetings | Meetings with full consensus | Meetings without full consensus | Variation in policy rate (basis points) | | Brazil | 4 | 3 | 1 | 200 | | Chile | 4 | 3 | 1 | 375 | | Colombia | 3 | 1 | 2 | 400 | | Czech Republic | 3 | 0 | 3 | 200 | | Hungary | 6 | 6 | 0 | 735 | | India | 4 | 4 | 0 | 140 | | Israel | 4 | 4 | 0 | 190 | | Japan | 4 | 1 | 3 | 0 | | South Africa | 3 | 0 | 3 | 200 | | Sweden | 3 | 3 | 0 | 175 | | Thailand | 3 | 1 | 2 | 50 | | UK | 4 | 0 | 4 | 150 | | US | 4 | 3 | 1 | 275 | | Sources: Central bank websites. |
| Table I.2: Baseline Assumptions for Projections | | Indicator | MPR April 2022 | MPR September 2022 | | Crude Oil (Indian basket) | US$ 100 per barrel during 2022-23 | US$ 100 per barrel during H2:2022-23 | | Exchange rate | ₹ 76/US$ during 2022-23 | ₹ 80/US$ during H2:2022-23 | | Monsoon | Normal for 2022-23 | 7 per cent above long period average for 2022-23# | | Global growth | 3.5 per cent in 2022
3.5 per cent in 2023 | 3.2 per cent in 2022
2.9 per cent in 2023 | | Fiscal deficit (per cent of GDP) | To remain within
BE 2022-23
Centre: 6.4
Combined: 9.0 | To remain within
BE 2022-23
Centre: 6.4
Combined: 9.3 | | Domestic macroeconomic/ structural policies during the forecast period | No major change | No major change | #: as on September 29, 2022.
Notes: 1. The Indian basket of crude oil represents a derived numeraire comprising sour grade (Oman and Dubai average) and sweet grade (Brent) crude oil.
2. The exchange rate path assumed here is for the purpose of generating the baseline projections and does not indicate any ‘view’ on the level of the exchange rate. The Reserve Bank is guided by the objective of containing excess volatility in the foreign exchange market and not by any specific level of and/or band around the exchange rate.
3. BE: Budget estimates.
4. Combined fiscal deficit refers to that of the Centre and States taken together.
Sources: RBI estimates; Budget documents; and IMF. | First, international crude oil prices have exhibited large volatility in H1. Brent crude oil prices hardened to US$ 121 per barrel by mid-June, driven by supply concerns due to sanctions on Russia. Prices have cooled off since then, as global demand is weakening. Continued supply management by the Organization of Petroleum Exporting Countries (OPEC) plus and gas-to-oil switching due to record natural gas prices have supported crude oil prices while the geopolitical conflict and sanctions weigh heavily on the outlook (Chart I.1.a & Chart I.1.b). Taking into account these developments, crude prices (Indian basket) are assumed at US$ 100 per barrel in the baseline, same as in the April MPR baseline. 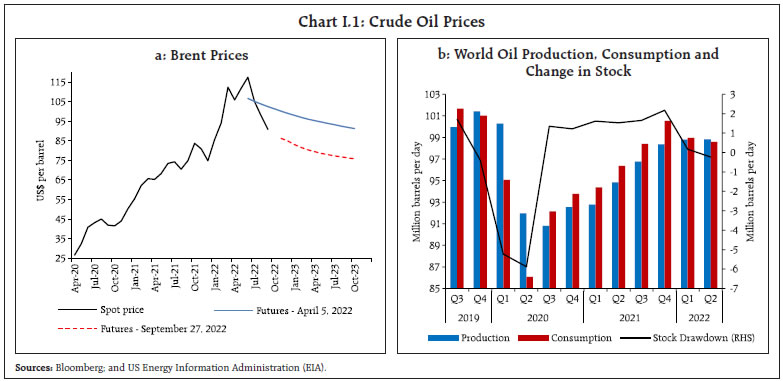 Second, the INR exhibited a depreciating bias vis-à-vis the US dollar during H1 on the back of generalised strengthening of the US dollar against currencies, elevated crude oil prices and portfolio outflows. The US dollar index strengthened by 16 per cent between end-March 2022 and September 27, reflecting aggressive monetary policy tightening by the US Fed and expectations of future hikes. Taking these developments into consideration, the exchange rate is assumed at INR 80 per US dollar in the baseline as against INR 76 in the April 2022 MPR, a depreciation of 5 per cent. Third, global economic prospects have weakened significantly since the April MPR, due to multi-pronged headwinds discussed earlier (Chart I.2). Global trade is slowing down and there are increasing concerns of recessions in major economies. The global composite Purchasing Managers Index (PMI) fell into contraction zone in August 2022 for the first time since June 2020. Global factors exert downward pressures on domestic activity and upward pressures on domestic inflation through a variety of channels (Box I.1). 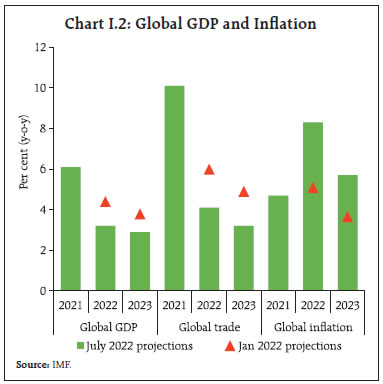
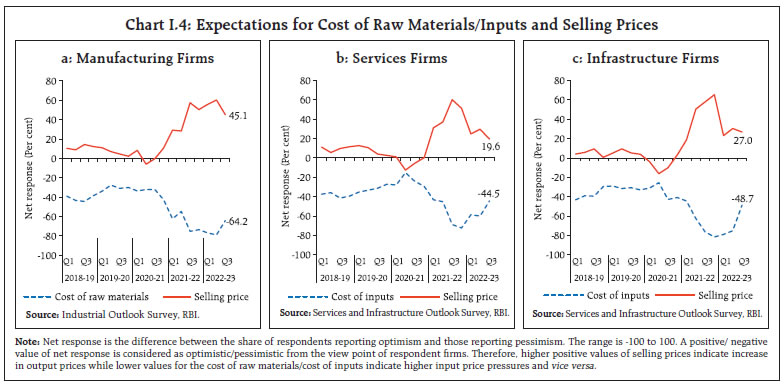
Box I.1: Macroeconomic Implications of Low Global Growth and High Global Inflation Global growth is expected to slow down from 6.1 per cent in 2021 to 3.2 per cent in 2022 and the outlook is “gloomy and more uncertain”, with risks tilted to the downside (IMF, 2022). Global consumer price inflation is projected by the IMF to increase from 4.7 per cent in 2021 to 8.3 per cent in 2022. These global stagflationary impulses can impact domestic growth and inflation through multiple channels. First, lower external demand drags down export demand and overall domestic demand and growth. At the same time, weak global demand can soften global commodity prices. Second, higher global commodity prices increase domestic inflation through direct and cost-push channels and dampen domestic growth through weakening of aggregate demand. Third, higher global inflation and global interest rates impact capital flows, put downward pressures on the domestic currency and lead to higher imported inflation. Based on the ‘Rest of the World (RoW) Block’ of the RBI’s Quarterly Projection Model3, the peak impact on India’s inflation and growth through all the channels occurs by four quarters. Second-round effects can keep inflation at elevated levels even beyond 8 quarters, necessitating appropriate monetary policy actions to anchor inflation expectations (Chart I.1.1). In such circumstances, frontloaded monetary policy actions by showing a strong commitment to the inflation target add to credibility gains and help in reining in inflation with lower output losses (John, Kumar and Patra, 2022). References: Benes, J., K. Clinton, A. George, P. Gupta, J. John, O. Kamenik, D. Laxton, P. Mitra, G. Nadhanael, R. Portillo, H. Wang, and F. Zhang (2016), “Quarterly Projection Model for India: Key Elements and Properties”, RBI Working Paper Series No. 08. International Monetary Fund (2022), World Economic Outlook, July. John, J., D. Kumar, and M. D. Patra (2022), “Monetary Policy: Confronting Supply-driven Inflation”, RBI Bulletin July, Volume LXXVI (7), pp. 97-109. | I.2 The Outlook for Inflation CPI inflation has ruled at or above the upper tolerance threshold of 6 per cent since January 2022 albeit with some moderation in recent months (Chapter II). Looking ahead, the three months and one year ahead median inflation expectations of urban households increased by 50 bps each in the September 2022 round of the Reserve Bank’s survey compared to the previous round4. The proportion of respondents expecting the general price level to increase by more than the current rate also increased in both the three months and one year ahead horizons vis-à-vis the previous round (Chart I.3). Manufacturing firms polled in the July-September 2022 round of the Reserve Bank’s industrial outlook survey expected reduction in cost of raw materials as well as selling prices in Q3:2022-23 (Chart I.4a).5 Services and infrastructure sector companies also expected softening in input costs and selling prices in Q3:2022-23 (Charts I.4b and I.4c).6 The respondents in manufacturing and services PMI reported increase in input and output prices in August 2022, although with some moderation in the pace of inflationary pressures. 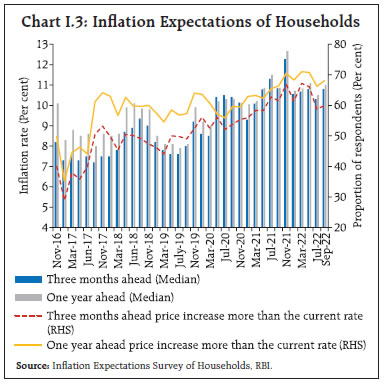
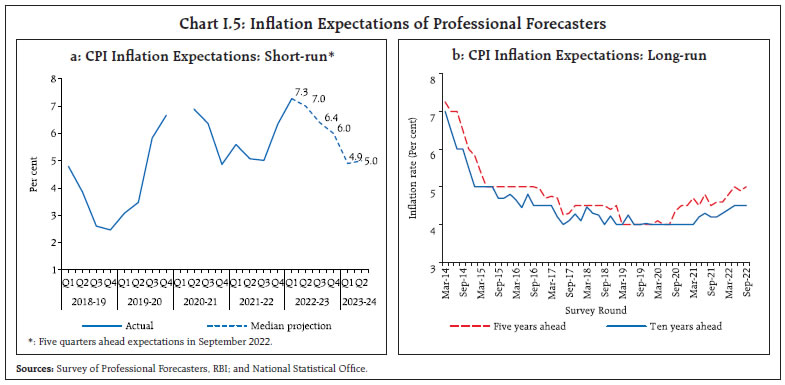
 Professional forecasters surveyed by the Reserve Bank in September 2022 expected CPI inflation to soften from 7.3 per cent in Q1:2022-23, to 6.0 per cent in Q4, and 4.9-5.0 per cent in H1:2023-24 (Chart I.5a and Table I.3).7 Long-run inflation expectations of professional forecasters – measured by their 5- and 10-year ahead expectations – remained broadly aligned around the inflation target, albeit with a slight upward drift during the pandemic period. In the September round, the 5-year ahead expected inflation rose by 10 bps to 5.0 per cent while the 10-year ahead expectation remained unchanged at 4.5 per cent (Chart I.5b). Looking ahead, several exogenous factors – global and domestic – will impinge on the inflation outlook. Global commodity prices have come off their highs on weaker global prospects but remain elevated and volatile. Global supply chains are gradually normalising, although they remain vulnerable to geopolitical disturbances, pandemic-related lockdowns in major production hubs, and financial market volatility. Domestically, the record foodgrains production in 2021-22, the above normal south-west monsoon during 2022, the recovery in kharif sowing, ample buffer stocks and improved reservoir position augur well for agricultural prospects and the future trajectory of food inflation. Taking into account the initial conditions, signals from forward-looking surveys and estimates from structural and other time-series models, CPI inflation is projected to average 6.7 per cent in 2022-23 – 7.1 per cent in Q2, 6.5 per cent in Q3 and 5.8 per cent in Q4, with risks evenly balanced (Chart I.6). The 50 per cent and the 70 per cent confidence intervals for headline inflation in Q4:2022-23 are 4.7-6.9 per cent and 4.0-7.6 per cent, respectively. For 2023-24, assuming a normal monsoon, a progressive normalisation of supply chains, and no further exogenous or policy shocks, structural model estimates indicate that inflation will average 5.2 per cent. In Q4:2023-24, CPI inflation is projected at 5.2 per cent, with the 50 per cent and the 70 per cent confidence intervals at 3.5-7.0 per cent and 2.5-7.9 per cent, respectively. | Table I.3: Projections - Reserve Bank and Professional Forecasters | | (Per cent) | | | 2022-23 | 2023-24 | | Reserve Bank’s Baseline Projections | | | | Inflation, Q4 (y-o-y) | 5.8 | 5.2 | | Real GDP growth | 7.0 | 6.5 | | Median Projections of Professional Forecasters | | | | Inflation, Q4 (y-o-y) | 6.0 | 5.0@ | | Real GDP growth | 7.0 | 6.1 | | Gross domestic saving (per cent of GNDI) | 28.0 | 28.7 | | Gross capital formation (per cent of GDP) | 31.3 | 31.5 | | Credit growth of scheduled commercial banks | 13.0 | 11.0 | | Combined gross fiscal deficit (per cent of GDP) | 9.7 | 9.0 | | Central government gross fiscal deficit (per cent of GDP) | 6.4 | 6.0 | | Repo rate (end-period) | 6.00 | 6.00@ | | Yield on 91-days treasury bills (end-period) | 6.2 | 6.0 | | Yield on 10-year central government securities (end-period) | 7.5 | 7.4 | | Overall balance of payments (US$ billion) | -57.6 | -7.4 | | Merchandise exports growth | 7.2 | 6.3 | | Merchandise imports growth | 19.0 | 5.7 | | Current account balance (per cent of GDP) | -3.4 | -2.7 | @: Q2:2023-24
Note: GNDI: Gross National Disposable Income.
Sources: RBI staff estimates; and Survey of Professional Forecasters (September 2022). |
 The baseline forecasts are subject to several upside and downside risks. The upside risks emanate from a further ratcheting up of geopolitical tensions, higher global crude and commodity prices, escalation in global financial market volatility due to aggressive monetary policy actions, longer-than-expected supply chain disruptions with shocks getting transmitted through highly integrated global supply chains (Box I.2), shortfall in kharif production, unseasonal rainfall and larger pass-through of input cost pressures to output prices as demand strengthens. The downside risks could arise from an early resolution of geopolitical tensions, further correction in global commodity prices due to slowing global demand, and further improvement in supply conditions with the ebbing of the pandemic. 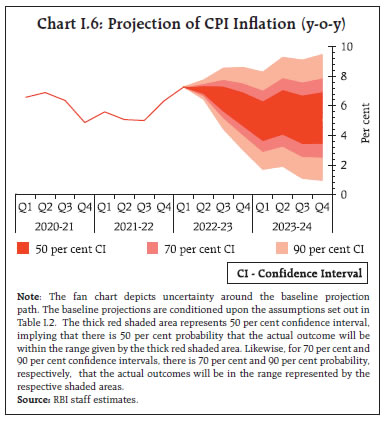
Box I.2: Global Cost-Push Spillovers on Inflation: Insights from World Input-Output Tables The global surge in inflation draws its origins from two large adverse shocks in quick succession – the COVID–19 pandemic and the conflict in Ukraine – reinforced by demand pressures emanating from sizeable monetary-fiscal stimuli. With more integrated global value chains, sectoral and country-specific shocks now transmit more swiftly than ever before (de Soyres and Franco, 2020)8. The cost-push inflationary impact of global shocks on the Indian economy can be captured through Inter-Country Input-Output (ICIO) tables (OECD, 2021). The potential impact of country-specific sectoral shocks is estimated by using the Leontief Inverse Matrix to identify the countries and sectors that can pose highest cost-push inflationary risks. 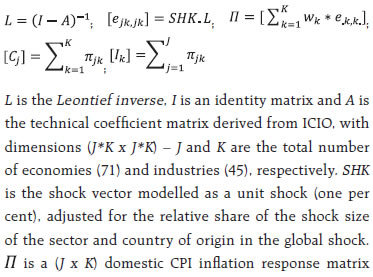
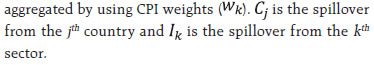 The empirical analysis indicates that a global inflation shock of one percentage point - modelled as a simultaneous one per cent increase in prices across all the countries and sectors – could increase inflation in India by around 63 bps through second round effects comprising domestic indirect effects (46 bps) and global spillovers (17 bps)9, in addition to the direct impact of 100 bps (Chart I.2.1). Domestic sources of inflation (direct as well as indirect) mainly stem from agriculture and allied activities, housing, textiles, and pharmaceutical sectors. Global spillovers, representing the imported inflation channel, are driven by price pressures in energy, mining, chemicals, trade, basic metals and machinery. In terms of source countries, the most important contributors to inflation in India are oil exporting countries, China and the United States. 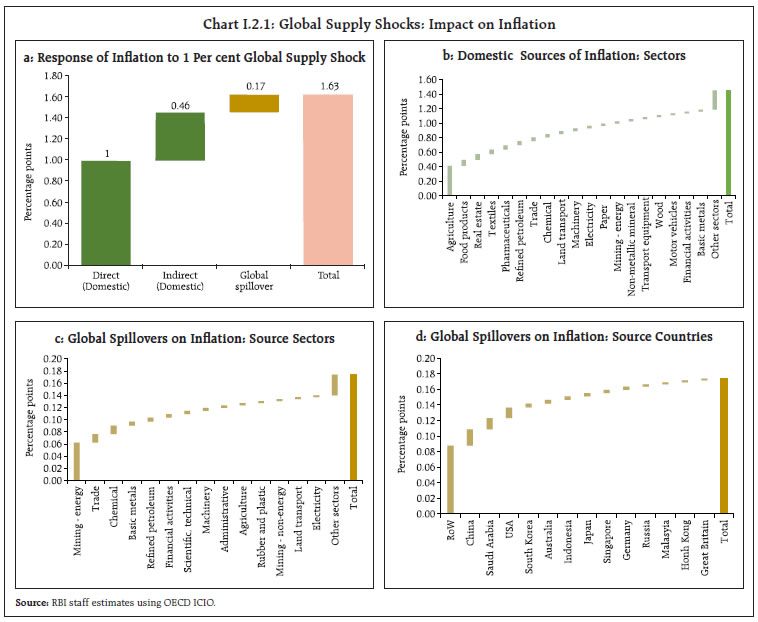 The current bout of global inflation is mainly driven by the jump in global energy and agricultural product prices (which rose by almost 40 per cent and 10 per cent, respectively, during H2:2021-22). The empirical analysis suggests that the global food and energy shocks experienced during H2:2021-22 could ceteris paribus impart upward pressure of around 2.5 percentage points on domestic inflation over time through the cost-push channel. References: de Soyres, F. and S. Franco. (2019), “Inflation Dynamics and Global Value Chains”, World Bank Policy Research Working Paper No. 9090. UNCTAD (2022), “The Effects of the COVID-19 Pandemic on International Trade”, Key Statistics and Trends in International Trade 2021, https://unctad.org/system/files/official-document/ditctab2022d3_en.pdf OECD (2021), Inter-Country Input-Output Tables, available at https://www.oecd.org/sti/ind/inter-country-input-outputtables.htm | I.3 The Outlook for Growth Ebbing COVID-19 infections and improving consumer sentiment facilitated a rebound in demand for contact-intensive services and supported domestic demand in H1:2022-23. Industry and services sectors are holding up well and kharif sowing has seen a smart recovery. The above-normal south-west monsoon has improved reservoir levels which bodes well for the winter crops. Investment activity is expected to benefit from the government’s capex push, growth in bank credit, improving demand conditions and rising capacity utilisation. Geopolitical tensions, the upsurge in global financial market volatility and tightening global financial conditions, however, weigh heavily on the outlook. Turning to the key messages from forward-looking surveys, consumer confidence (the current situation index) increased further in the September 2022 survey round on account of improved perception on general economic situation and overall spending, though overall confidence remained in the pessimistic zone. Households remained optimistic for the year ahead, with the future expectations index remaining unchanged vis-à-vis the July 2022 survey round (Chart I.7).10
Optimism on demand conditions in the manufacturing sector for the quarter ahead waned marginally in the July-September 2022 round of the Reserve Bank’s industrial outlook survey, though it remained well in the expansion zone (Chart I.8a). Services sector companies expected slight moderation while infrastructure companies expected a minor uptick in Q3:2022-23 in terms of the overall business situation (Charts I.8b and I.8c). Recent surveys by other agencies indicate a dip in business expectations over their respective previous rounds (Table I.4). In the August 2022 round of the PMI survey, business expectations of manufacturing and services firms improved to multi-year highs on optimism over strengthening demand. Professional forecasters polled in the September 2022 round of the Reserve Bank’s survey expected real GDP growth at 6.3 per cent in Q2:2022-23, 4.8 per cent in Q3 and 4.2 per cent in Q4, and at 6.4-6.6 per cent in H1:2023-24 (Chart I.9 and Table I.3). Taking into account the baseline assumptions, survey indicators and model forecasts, real GDP growth is expected at 7.0 per cent in 2022-23 – 6.3 per cent in Q2; and 4.6 per cent each in Q3 and Q4 – with risks broadly balanced around this baseline path (Chart I.10 and Table I.3). For 2023-24, assuming a normal monsoon, and no major exogenous or policy shocks, the structural model estimates indicate real GDP growth at 6.5 per cent. There are upside and downside risks to the baseline growth path. Upside risks to the baseline trajectory could emanate from stronger-than-expected expansion in demand for contact-intensive services with the receding threat of the pandemic and festival spending; a boost to private investment activity from government’s capex push, improving bank credit, rising capacity utilisation, and healthier corporate balance sheets; and a favourable terms of trade shock in the case of a sharp correction in crude and commodity prices. On the contrary, an escalation in geopolitical tensions, further hardening of international crude oil and other commodity prices, sustained disruptions to supply chains, the upsurge in global financial market volatility, and a sharper loss of momentum in global trade and demand pose downside risks to the baseline growth path. | Table I.4: Business Expectations Surveys | | Item | NCAER Business Confidence Index (July 2022) | FICCI Overall Business Confidence Index (August 2022) | Dun and Bradstreet Composite Business Optimism Index (September 2022) | CII Business Confidence Index (September 2022) | | Current level of the index | 138.5 | 65.0 | 69.9 | 62.2 | | Index as per the previous survey | 142.9 | 67.6 | 96.6 | 66.9 | | % change (q-o-q) sequential | -3.1 | -3.8 | -27.6 | -7.0 | | % change (y-o-y) | 124.1 | -8.8 | -5.8 | -0.6 | Notes: 1. NCAER: National Council of Applied Economic Research.
2. FICCI: Federation of Indian Chambers of Commerce & Industry.
3. CII: Confederation of Indian Industry.
Sources: NCAER; FICCI; CII; and Dun & Bradstreet Information Services India Pvt. Ltd. |
I.4 Balance of Risks Baseline projections of inflation and growth are conditional on assumptions of the future course of key domestic and international macroeconomic variables set out in Table I.2. There are, however, sizeable uncertainties around the baseline assumptions, as stated earlier. This section explores plausible alternative scenarios to assess the balance of risks around the baseline projections. (i) Global Growth Uncertainties The downside risks to global growth flagged in the April 2022 MPR have materialised. Headwinds from the war, elevated commodity prices, tightening financial conditions, capital outflows from emerging economies, and the slowing global activities could pull global growth further below the baseline. There are growing concerns of recession in major economies and the global outlook is bleak and risks are tilted to the downside. In such a scenario, if global growth is 100 bps below the baseline, domestic growth and inflation could be around 40 bps and 20 bps, respectively, below the baseline trajectories. Conversely, if there is an early de-escalation in geopolitical tensions, the recent trend in falling commodity prices continues, and global inflation ebbs faster than expected, there can be a fillip to global growth. In this scenario, assuming that global growth surprises by 50 bps on the upside, domestic growth and inflation could edge higher by around 20 bps and 10 bps, respectively (Charts I.11a and I.12a). 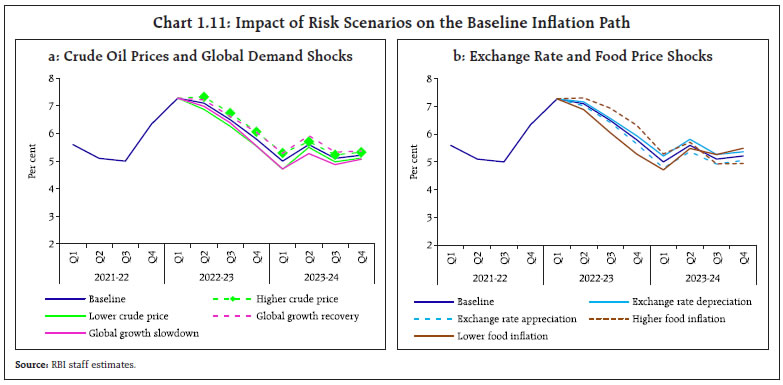 (ii) International Crude Oil Prices Global crude oil prices remain at elevated levels, driven by geopolitical tensions, sanctions and supply management by OPEC plus. Further production curtailment by OPEC plus and the spike in the seasonal winter demand for energy amidst high natural gas prices could harden international crude oil prices. Assuming crude oil prices (Indian basket) to be 10 per cent above the baseline of US$ 100 per barrel, domestic inflation and growth could be higher by 30 bps and weaker by around 20 bps, respectively, over the baseline. Conversely, crude oil prices could soften below the baseline owing to global demand losing momentum and an easing of geopolitical tensions. As a result, if the Indian basket of crude prices falls by 10 per cent relative to the baseline, inflation could ease by around 30 bps with a boost of 20 bps to growth (Charts I.11a and I.12a). (iii) Exchange Rate The INR depreciated in H1, driven by the generalised strengthening of the US dollar, higher crude oil prices and sales by foreign portfolio investors. Volatility in global financial markets is expected to persist due to the uncertainty around monetary policy normalisation in the US and other major advanced economies, which could put downward pressure on the INR. Should the INR depreciate by 5 per cent from the baseline, inflation could edge up by around 20 bps while GDP growth could be higher by around 15 bps through boost to exports. On the other hand, given India’s relatively better growth performance and outlook and strong domestic macroeconomic fundamentals, portfolio equity flows turned significantly positive in August 2022 and could increase further. In this scenario, if the INR appreciates by 5 per cent relative to the baseline, inflation and GDP growth could moderate by around 20 bps and 15 bps, respectively (Charts I.11b and I.12b). (iv) Food Inflation Food inflation remained high during H1, driven by the war-induced jump in global food prices. Global food prices have started correcting and these are being reflected in the softening of domestic edible oil prices. Furthermore, kharif sowing has caught up with its long-term average. Reservoir levels are above last year’s and the decadal average, which augur well for the rabi crop. Although the area under paddy sowing has been lower than a year ago due to uneven distribution of south-west monsoon rainfall, ample buffer stocks of rice and effective supply management measures could soften food inflation more than anticipated, and push headline inflation 50 bps below the baseline. Conversely, global food prices could harden in view of the fragile geopolitical outlook and sustained input price pressures on critical inputs like energy and fertilisers. Furthermore, unseasonal heavy rainfalls during the harvesting period could impact the domestic crop. In such a scenario, there could be upward pressures on food prices and headline inflation could be around 50 bps above the baseline (Charts I.11b and I.12b). I.5 Conclusion The Indian economy is advancing steadily, and is expected to be one of the fastest growing major economies in 2022. The above-normal south-west monsoon, improved reservoir position, government’s capex push, improvement in capacity utilisation, a broad-based revival in credit growth, strong corporate and bank balance sheets, upbeat consumer and business confidence and receding threat of the pandemic are all factors likely to provide impetus to growth. While inflation has eased somewhat from the April high, supported by some correction in global prices, it has ruled above the upper tolerance threshold around the target since January 2022. Monetary policy has moved into the withdrawal of accommodation mode and remains focussed to ensure that inflation returns to the target while supporting growth. The daunting global environment, however, imparts considerable uncertainty to the outlook. __________________________________________________________________________________
II. Prices and Costs The trajectory of consumer price index (CPI) inflation since February 2022 has been altered by spillovers from the conflict in Ukraine. CPI inflation peaked in April 2022 and has since then moderated but persists above the pre-war levels and also above the upper tolerance band. During H1:2022-23, industrial and farm input pressures remained firm, notwithstanding some softening. Nominal rural wage growth was muted. Since February 2022, the trajectory of headline CPI inflation1 has been altered by spillovers from adverse global commodity price shocks triggered by the conflict in Ukraine. In February, it was anticipated that the pandemic-induced global supply chain disruptions would ease with the ebbing of COVID-19 infections, the combination of domestic supply side measures and a normal monsoon would bring about a durable softening of domestic inflation over the course of the year. The war upended this narrative with a broad-based spike in global commodity prices, the resurgence of supply chain and logistics bottlenecks, sanctions and second-round effects. Global financial market volatility engendered by aggressive monetary tightening and consequent spillovers to domestic financial markets exacerbated inflationary pressures. Headline CPI inflation was already testing the upper tolerance threshold of 6 per cent during January-February 2022, due to adverse base effects, and a sticky core component.2 Starting March, the fallout of the adverse global commodity price shocks spread across items. In April, the heat wave and consequent production losses added to a sharp pick-up in prices. As a result, headline inflation surged by 173 basis points in two months – from 6.1 per cent in February to 7.8 per cent in April across food, fuel and core components. Judicious supply side interventions by the government and some softening of global commodity prices from their peak March 2022 levels enabled inflation to moderate to 6.7 per cent in July before it edged up to 7.0 per cent in August on a surge in food inflation (Chart II.1). The Reserve Bank of India (RBI) Act enjoins the RBI to set out deviations of actual inflation outcomes from projections, if any, and explain the underlying reasons thereof. The April 2022 MPR projected inflation at 6.3 per cent for Q1:2022-23 and 5.8 per cent for Q2. War-induced price pressures as well as domestic supply shocks turned out to be stronger and more persistent than anticipated, resulting in actual inflation exceeding projections by around 100 bps each in Q1 and Q2 (July-August) (Chart II.2). This came about largely from substantial upward surprises in food inflation.3 The unprecedented increase in global food prices in March led to sharp increases in domestic prices of edible oils, animal-based proteins through high feed costs, and wheat through export linkages. At the same time, the adverse impact of the intense heat wave caused damage to the rabi wheat crop, and tomato prices jumped by 158.4 per cent (on a year-on-year basis) in June 2022. Processed food prices also registered increases as higher input costs were passed on to selling prices. The depreciation of the Indian rupee from the baseline of ₹76 per US$ to around ₹79-80 per US$ by August-September also contributed to projection errors, partly offset by the cut in excise duties on petrol and diesel in May 2022. 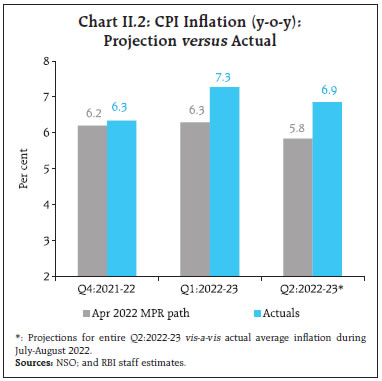 II.1 Consumer Prices As explained in the preceding section, the surge in headline inflation in April was sharp and broad-based. Thereafter, a deceleration of the momentum of prices, supported by a large favourable base effect, brought down inflation to 7.0 per cent in May-June.4 The deceleration in momentum in May was located in the core component, even as food price momentum remained robust. In June, headline momentum moderated further, across all major groups. In July, even as headline CPI momentum remained unchanged at June level, favourable base effect led to a softening in inflation by 30 bps to 6.7 per cent. August was the third successive month with a steady momentum of 0.5 per cent; inflation, however, edged up by around 30 basis points as the favourable base effects waned (Chart II.3). 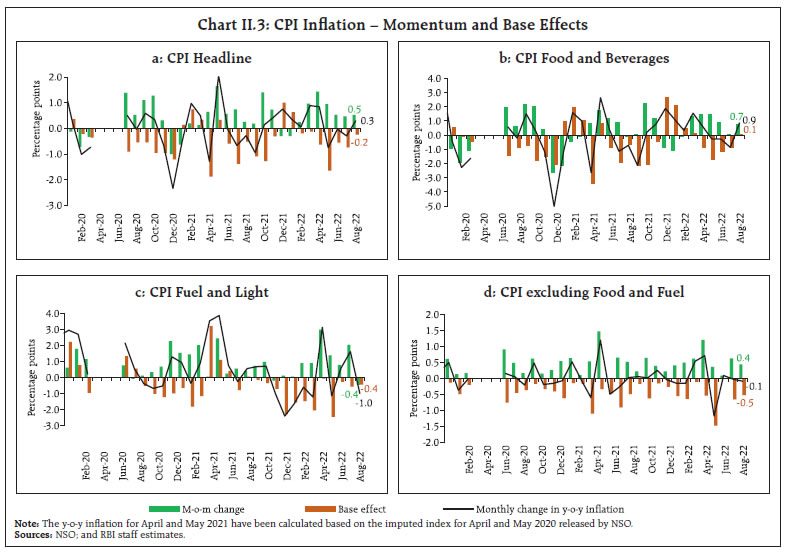 The mean of the CPI inflation distribution rose to 6.8 per cent in 2022 (January-August) from 5.3 per cent during the corresponding period in 2021 and the pre-COVID average of 3.4 per cent for 2017-19 (January-August). This was accompanied by higher median rates and lower dispersion in the sub-group/group-wise distribution of inflation rates signifying generalisation of inflation (Chart II.4), and heightened uncertainty about future inflation (Box II.1). 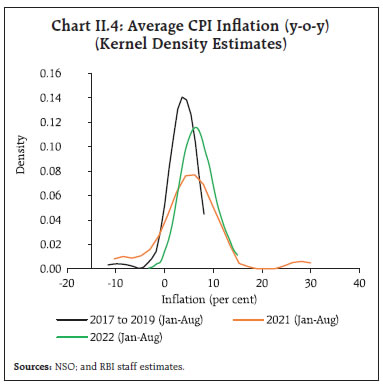
Box II.1: Inflation and Inflation Uncertainty in India Sustained high inflation can lead to higher uncertainty and allocative inefficiency (Friedman, 1977; Ball, 1992). The impact of inflation variability can, however, be ambiguous, depending on whether the central bank tolerates higher inflation (Cukierman and Meltzer, 1986) or it is committed to the inflation target and adopts a contractionary policy (Holland, 1995). Using CPI data (month-on-month percentage changes of seasonally adjusted data) for the period April 2005 to July 2022, time-varying inflation uncertainty (or inflation volatility) is estimated by employing a generalized autoregressive conditional heteroskedasticity (GARCH) model. Three specifications are estimated to address the various hypotheses using GARCH (2,1)5 estimates. Model I is the baseline model; in Model II, inflation rate is added to assess the Friedman-Ball hypothesis; in Model III, uncertainty (i.e., the variance of inflation) is included in the mean equation to explore the Cukierman–Meltzer/Holland hypothesis (Table II.1.1). | Table II.1.1: Inflation and Inflation Volatility: Estimates of GARCH Models | | Variable | Model I | Model II | Model III | | Mean Equation | | | | | Constant | 0.46***
(0.05) | 0.32***
(0.04) | -0.37***
(0.14) | | Inflation (-1) | 0.22***
(0.06) | 0.27**
(0.06) | 0.25***
(0.06) | | Log(GARCH) | - | - | -0.50***
(0.07) | | Variance Equation | | | | | Constant | 0.04
(0.03) | -0.01
(0.01) | 0.01*
(0.01) | | ARCH(-1) | 0.25***
(0.09) | 0.15**
(0.07) | 0.47***
(0.10) | | ARCH(-2) | -0.23***
(0.08) | -0.15**
(0.06) | -0.45***
(0.10) | | GARCH(-1) | 0.83***
(0.18) | 0.82***
(0.06) | 0.94***
(0.03) | | Inflation | - | 0.09***
(0.02) | - | | Diagnostics | | | | | ARCH-LM (3) | 0.43
(0.73) | 1.58
(0.20) | 0.46
(0.71) | | ARCH-LM (6) | 0.61
(0.72) | 0.94
(0.47) | 0.82
(0.55) | | Q2(3) | 1.41
(0.77) | 4.20
(0.24) | 1.39
(0.71) | | Q2(6) | 3.21
(0.78) | 6.01
(0.42) | 4.85
(0.56) | | Engle-Ng Sign-Bias Test | 2.20
(0.53) | 4.34
(0.23) | 2.69
(0.44) | Note: ***, ** and * indicate significance at 1, 5 and 10 per cent levels, respectively. Figures in parentheses indicate standard errors for mean and variance equations and p-values for the diagnostic tests. Inflation has been calculated as the seasonally adjusted month-over-month increase in prices. The sample period for the analysis is April 2005-July 2022.
Source: RBI staff estimates. | The sum of ARCH and GARCH coefficients is in the range of 0.83 to 0.96 (i.e., less than 1), suggesting that inflation volatility exhibits high degree of persistence but is mean reverting (Chart II.1.1). The level of inflation is seen to have a positive impact on the variance of inflation (Model II), providing support for the Friedman-Ball hypothesis. Inflation volatility is seen to have a negative impact on the rate of inflation in line with the Holland hypothesis (Model III). Granger causality analysis indicates causality running from inflation to inflation volatility (Table II.1.2). Overall, the analysis suggests that high levels of inflation can raise uncertainty about future inflation and impinge upon inflation expectations, stressing the need for keeping inflation around the target.
| Table II.1.2: Causality between Inflation and Inflation Volatility | | Null Hypothesis | Lag 3 | Lag 6 | | Inflation does not Granger cause Inflation Volatility | 6.75*** | 3.54*** | | Inflation Volatility does not Granger cause Inflation | 1.90 | 1.02 | Note: *** indicates significance at 1 per cent level.
Source: RBI staff estimates. | References: Friedman, M. (1977), “Nobel Lecture: Inflation and Unemployment”, Journal of Political Economy, 85(3), 451-472. Ball, L. (1992), “Why does High Inflation Raise Inflation Uncertainty?”, Journal of Monetary Economics, 29(3), 371-388. Cukierman, A., & Meltzer, A. H. (1986), “A Theory of Ambiguity, Credibility, and Inflation under Discretion and Asymmetric Information”, Econometrica, 54(5), 1099-1128. Holland, A. S. (1995), “Inflation and Uncertainty: Tests for Temporal Ordering”, Journal of Money, Credit and Banking, 27(3), 827-837. Balaji, B., Durai, S., & Ramachandran, M. (2016). “The Dynamics between Inflation and Inflation Uncertainty: Evidence from India”, Journal of Quantitative Economics, 14(1), 1-14. | Diffusion indices (DIs)6 also attest to generalised price increases across the CPI basket during March-April 2022 (Chart II.5a). A majority of the items in the CPI basket showed threshold DIs7 in excess of 4 per cent and 6 per cent, based on a seasonally adjusted annualised rate (saar). Though there was some let up during May-June, the spread of price increases accelerated during July-August. In August, a majority of CPI basket registered prices increases in excess of 4 per cent (saar) (Chart II.5b). II.2 Drivers of Inflation A historical decomposition of inflation using vector autoregression (VAR)8 analysis to ascertain the relative role of various macro factors indicates that the rise in inflation during H1:2022-23 can be primarily attributed to adverse supply-side shocks from food along with fuel price shocks, while aggregate demand conditions continued to exert downward pressure on inflation (Chart II.6a). During March-August 2022, goods inflation contributed 86 per cent of headline inflation. Perishables (non-durable goods with a 7-day recall9) like milk, tomatoes, potatoes, edible oils, cooked meals and chicken as well as semi-perishable goods (non-durable goods with a 30-day recall), particularly, petroleum products like kerosene, liquified petroleum gas (LPG) and petrol along with cereals and medicines were the main drivers of goods inflation (Chart II.6b). Durable goods contributed 12.8 per cent of overall inflation. The contribution of services (with a weight of 23.4 per cent in overall CPI) remained muted at around 14 per cent of headline inflation (Chart II.6b). 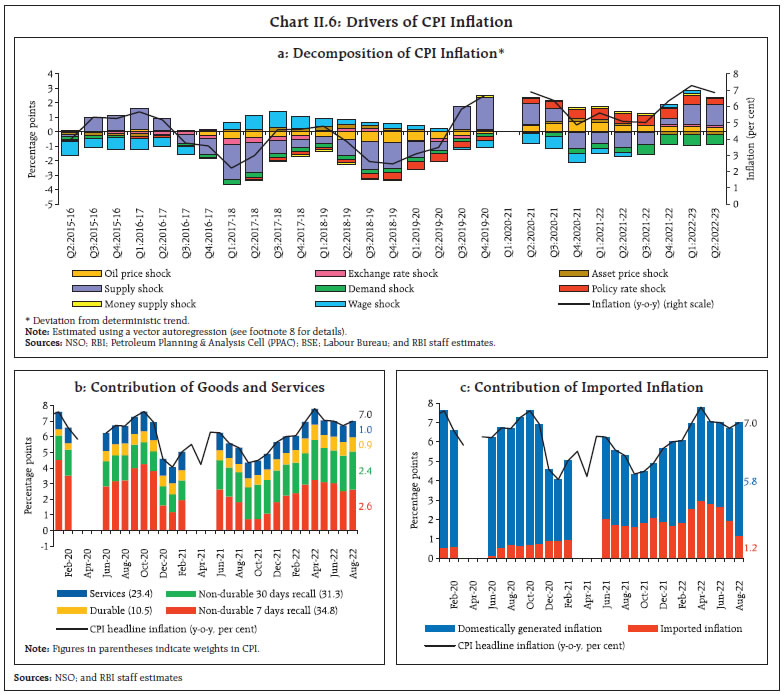 The increase in global commodity prices following the conflict in Ukraine contributed to a surge in the contribution of imported components10 to headline inflation during March-June 2022. Subsequently, the decline in international commodity prices in July-August 2022 lowered imported inflation. The cut in central excise duties on petrol and diesel in May 2022 reduced domestically generated inflation (Chart II.6c). Food Food and beverages (with a weight of 45.9 per cent in CPI) inflation rose to 8.1 per cent in April 2022, owing to global supply shortages and adverse domestic weather conditions. Thereafter, food inflation eased to 6.7 per cent in July, supported by the Government’s supply-side measures, some easing of international food prices and a substantial correction in tomato prices. In August, food inflation turned around to register a substantial pick-up, with cereals and vegetables being its key drivers (Chart II.7a and II.7b). 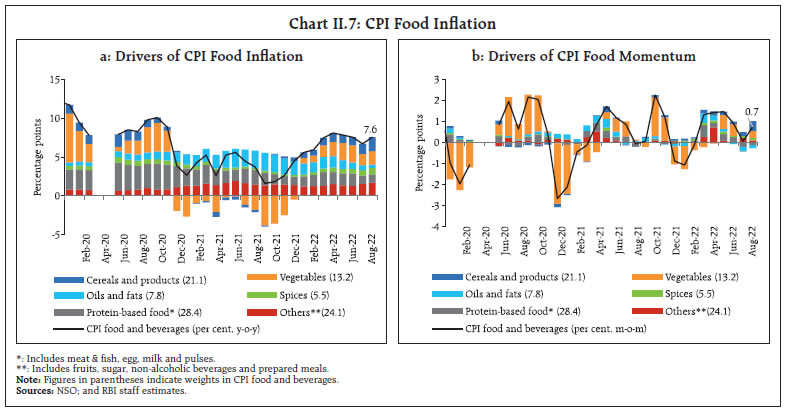
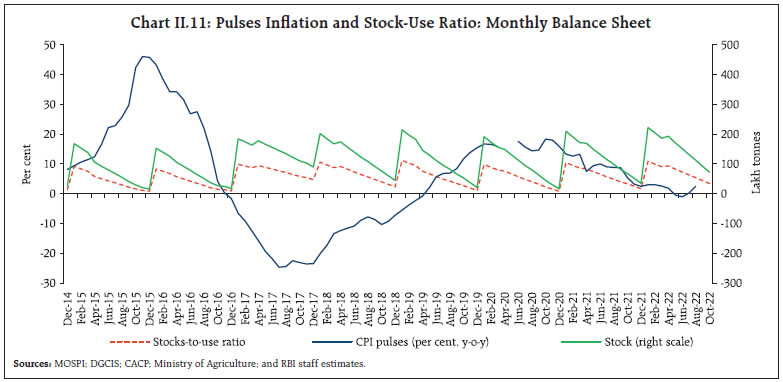
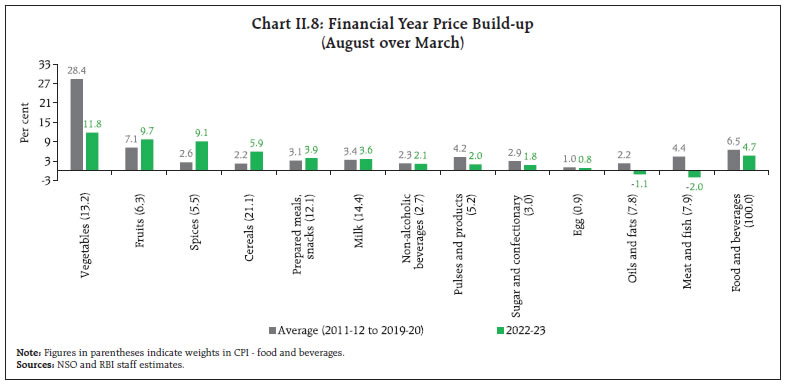 Even as food inflation remained elevated, the food price build-up in the current financial year (August over March) so far was muted relative to historical patterns. First, food prices registered a sharp pick-up in March 2022 itself, primarily on account of meat and fish, and edible oils. Second, while the price build-up in cereals (which constitutes more than a fifth of the food basket) was higher than its long-term average as was those of fruits, spices, prepared meals and milk, these were offset by a substantial correction in edible oils, and meat and fish prices from historic highs in May and June. Third, the summer seasonal increase in vegetable prices was lower than usual due to a softer build-up in onion, garlic and some other vegetables prices in view of higher production (Chart II.8). Inflation in the prices of cereals (weight of 9.7 per cent in the CPI and 21.1 per cent in the food and beverages group) rose from 5.0 per cent in March 2022 to 9.6 per cent in August driven by sharp pick up in momentum (Chart II.9). Within cereals, wheat prices have increased sharply since March on account of lower domestic production ((-) 2.5 per cent in 2021-22) due to heat waves in major wheat producing states, elevated global prices due to the war, higher exports (157 per cent y-o-y during April-July 2022), and decline in stocks (0.9 times the buffer norms as on September 1, 2022). In response, restrictions on wheat exports were imposed since May 2022, and exports of wheat flour were banned from August 27, 2022. Rice prices increased due to the substitution of wheat by rice under Pradhan Mantri Garib Kalyan Anna Yojana (PMGKAY) for May-September 2022, higher exports (9.0 per cent y-o-y during April-July 2022), and a fall in area under kharif sowing and expected lower production. Large stocks of rice (2.6 times the buffer norm as of September 1, 2022) and restrictions on broken rice exports along with imposition of 20 per cent export duty on rice other than basmati and par-boiled rice are expected to withhold undue price pressures. 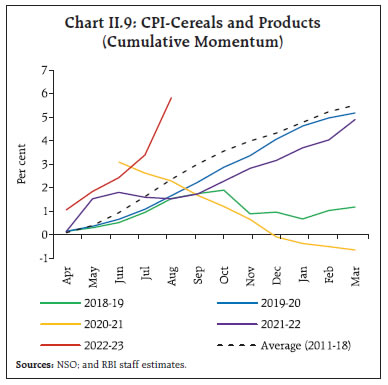 Vegetable prices (weight of 6.0 per cent in the CPI and 13.2 per cent in the food and beverages group) inflation remained in double digits during March-August 2022, peaking in May. The spike in tomato prices (113.5 per cent during April-June 2022), along with price increases in other vegetables reflecting the usual summer uptick, remained the main drivers (Chart II.10). The negative contribution of onions and garlic, on an average, during April-August partly offset the inflationary pressures. Among key vegetables, onion prices moderated during March-May 2022 on account of higher production (an increase of 19 per cent in 2021-22) and record procurement (buffer stock of 2.5 lakh metric tonnes (LMT) in 2022-23). Subsequently, prices rose during June-August 2022 in line with the usual seasonal pattern. Potato prices increased during March-August 2022 due to lower production ((-) 4.6 per cent in 2021-22). To rein in price pressures, free imports of potatoes were allowed from Bhutan until June 30, 2023. Tomato prices picked up dramatically during April-June 2022 due to the decline in production ((-) 4.0 per cent in 2021-22) coming from lower area sown, heat waves in north India and excess rains and cyclone in Karnataka. The upbeat production response to elevated prices led to robust mandi arrivals and the easing of tomato prices during July-August 2022. Inflation in prices of fruits (weight of 2.9 per cent in the CPI and 6.3 per cent within the food and beverages group) increased from 2.5 per cent in March 2022 to 7.4 per cent in August due to higher prices of bananas, apples, grapes and dry fruits. A spike in mango prices in April 2022 due to crop damage caused by heat waves and unseasonal rains also contributed to fruit price momentum. Pulses (plant-based protein) price inflation (weight of 2.4 per cent in the CPI and 5.2 per cent in the food and beverages group) moderated from March 2022 until June after which it picked up during July-August. Prices moderated in Q1:2022-23 in line with supply side measures by the government, including the extension of tur and urad imports under the ‘free category’ until March 31, 2023; the reduction in Agriculture Infrastructure and Development Cess (AIDC) on lentils to 0 per cent from 10 per cent extended till March 31, 2023; and higher production (8.8 per cent in 2021-22). However, inflation in pulses picked up gently during July-August, driven by shortfall in kharif sowing and the expected shortfall in production of tur and urad. Adverse base effects also contributed to the pick up in pulses inflation. The higher stock-to-use (STU) ratio (Chart II.11), aggressive procurement for central pool and supply-side interventions – like open market operations along with the decision to release chana dal at a discount to states and union territories (UTs) for welfare schemes – are, however, expected to contain pressures in pulses price in H2. 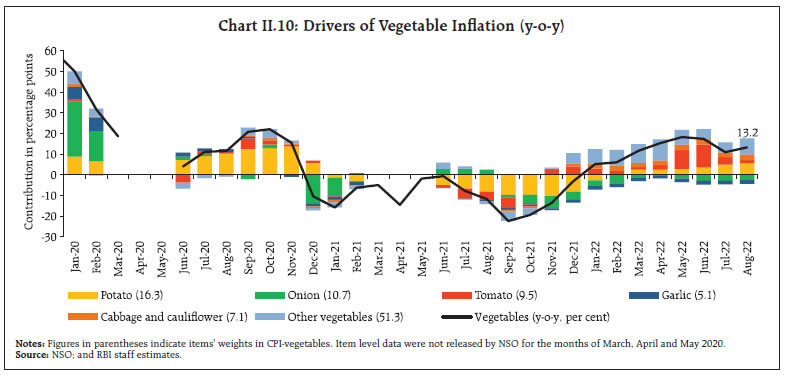
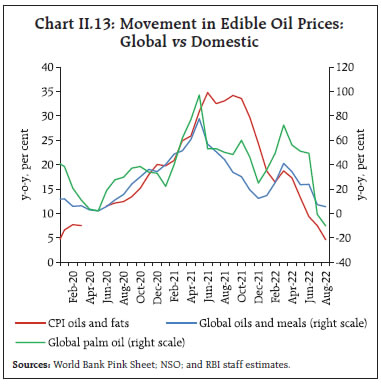
 Regarding animal-based protein items, prices increased sharply in H1:2022-23, driven by meat and fish (weight of 3.6 per cent in the CPI and 7.9 per cent within the food and beverages group) and milk and products (weight of 6.6 per cent in the CPI and 14.4 per cent within the food and beverages group) (Chart II.12). In the case of meat and fish, prices rose during March-June 2022, reflecting feed cost pressures amidst the early onset of summer, accompanied by heat waves. Price pressures eased in July-August 2022 due to reduced seasonal demand (on account of Sravana month) and imports of genetically modified (GM) soymeal. In contrast, a fall in prices along with favourable base effects dragged eggs price into deflation during April-August 2022. Milk and products prices increased consistently during March-August 2022, as major milk cooperatives (like Amul and Mother Dairy) raised retail prices by ₹2 per litre each in March and August 2022, citing an increase in input costs. This was followed by price increases by other state cooperatives. Inflation in prices of oils and fats (weight of 3.6 per cent in the CPI and 7.8 per cent within the food and beverages group) eased during H1:2022-23, reaching 4.6 per cent in August, after remaining in double digits for more than two years (Chart II.13). The moderation in inflation was supported by easing global prices, supply-side measures undertaken by the government and higher domestic production (4.9 per cent in 2021-22). Global prices of edible oils, which had surged in March with the onset of the war, corrected with the lifting of the export ban (imposed on April 28, 2022) effective from May 23, 2022, the removal of export levy until August 31, 2022, and the reduction in export duties by Indonesia. Price pressures also abated due to the supply side steps by the government, including an extension of stock limits on edible oils and oilseeds up to December 31, 2022, the reduction in basic customs duty (BCD) to 0 per cent till March 31, 2023, allocation of tariff rate quota (TRQ) import of 2.0 million tonnes each for crude soybean and sunflower oil for the financial year 2022-23 and 2023-24 at 0 per cent BCD and AIDC and hike in minimum support prices (MSPs) of kharif oilseeds for 2022-23 (5.4 per cent to 8.9 per cent increase). On the other hand, rising milk prices resulted in upside pressures in ghee and butter prices. 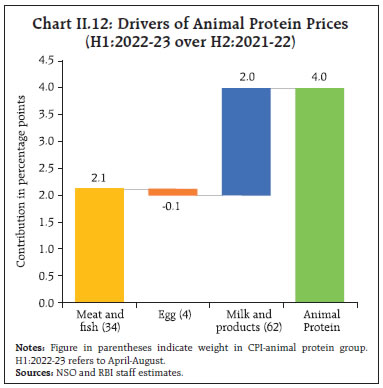
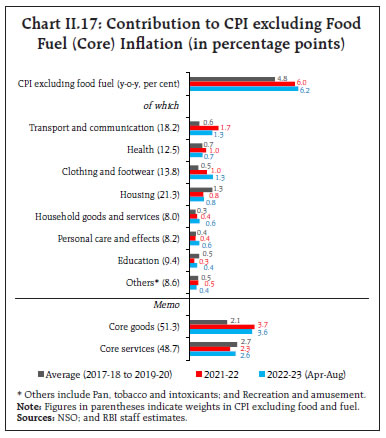
 Prices of sugar and confectionery (weight of 1.4 per cent in the CPI and 3.0 per cent in the food and beverages group) remained muted during March-July 2022 on the back of higher production (7.7 per cent increase in sugarcane production in 2022-23) and export restrictions on sugar effective from June 1, 2022 to ensure ample domestic supplies. However, prices increased in August 2022 on higher exports (which rose by 32.5 per cent y-o-y during April-July 2022) coming from a relaxation of export limits and from expectations of a healthy festive demand. Among other food items, inflation in prices of spices remained in double digits during H1:2022-23, reflecting lower production ((-) 1.9 per cent in 2021-22), especially in the case of key spices like coriander, cumin, black pepper and red chillies. Furthermore, prepared meals witnessed a rise in prices, due to an increase in input costs such as edible oils, LPG and transport charges. Retail Margins Retail price margins – the difference of retail and wholesale prices11 – for cereals and pulses, which had been on the rise since the outbreak of the COVID-19 pandemic, remained at elevated levels during H1. Margins in edible oils moderated somewhat in April 2022 due to a higher degree of softening in retail mustard oil prices relative to wholesale prices. In the case of vegetables, margins rose in May-June 2022, driven by the sharp uptick in tomato retail prices, but they moderated subsequently with the correction in tomato prices (Chart II.14). Fuel CPI fuel inflation surged from 7.5 per cent in March 2022 to 11.8 per cent by July 2022 on the back of sharp increases in LPG and subsidised kerosene (PDS) prices which, in turn, reflected the sharp jump in global energy prices following the conflict in Ukraine. Fuel inflation moderated to 10.8 per cent in August due to decline in kerosene (PDS) prices reflecting pass through of the fall in international prices. Electricity prices have remained in deflation in 2022 so far (Chart II.15). Core Core inflation, i.e., CPI inflation excluding food and fuel, increased sharply after the start of the war to 7.1 per cent in April 2022 from 5.8 per cent in February. It moderated thereafter on favourable base effects, the reduction in excise duties on petrol and diesel and some deceleration in price momentum. During June-August, core inflation remained steady at around 6.0 per cent, including when other volatile items such as petrol, diesel, gold and silver are excluded (Table II.1). Core inflation has been persistent and elevated since 2021, due to repeated cost-push shocks in manufacturing and services (Chart II.16). During 2022-23 (April-August), core inflation averaged 6.2 per cent (5.9 per cent a year ago), with pressures broad-based, particularly in the goods component (Chart II.17).
| Table II.1: Exclusion-based Measures of Core Inflation (y-o-y) | | Month | CPI excluding food and fuel (47.3) | CPI excluding food fuel petrol diesel (45.0) | CPI excluding food fuel petrol diesel gold silver (43.8) | | Jun-21 | 6.1 | 5.3 | 5.4 | | Sep-21 | 5.9 | 5.2 | 5.6 | | Dec-21 | 6.1 | 5.6 | 5.9 | | Jan-22 | 6.0 | 5.6 | 5.8 | | Feb-22 | 5.8 | 5.6 | 5.7 | | Mar-22 | 6.4 | 6.2 | 6.1 | | Apr-22 | 7.1 | 6.5 | 6.4 | | May-22 | 5.9 | 5.5 | 5.5 | | Jun-22 | 6.0 | 6.1 | 6.1 | | Jul-22 | 6.0 | 6.3 | 6.4 | | Aug-22 | 5.9 | 6.2 | 6.2 | Notes: (1) Figures in parentheses indicate weights in CPI.
(2) Derived as residual from headline CPI.
Sources: NSO; and RBI staff estimates. | The jump in core inflation by 126 basis points between February and April 2022 was considerably influenced by spillovers from the increases in international crude oil and gold prices following the start of the war in end-February. As international crude oil prices inched upwards of US$ 120 per barrel in March, domestic petrol and diesel pump prices rose by around ₹10 per litre between March 22 and April 6, 2022 and then remained unchanged till May 22, 2022. Pump prices then fell, following the reduction in excise duties by ₹8 per litre on petrol and by ₹6 per litre on diesel (Chart II.18). 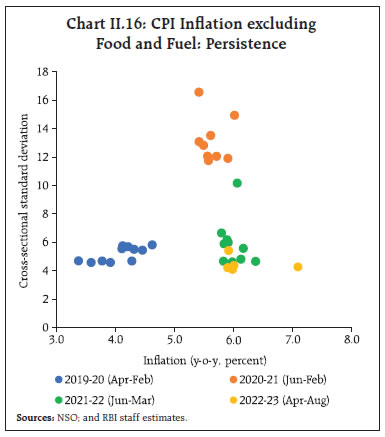
 Coupled with favourable base effects, the cut in excise duties resulted in CPI petrol and diesel prices moving to the deflationary zone by August 2022. Price increases in WPI petrol and diesel were higher at 53 per cent (y-o-y) in August, largely reflecting the fact that indirect taxes are included in CPI but excluded from WPI (Chart II.19). On the whole, the reduction in excise duties had a direct softening impact of 43 bps on core inflation and 20 bps on headline inflation. The decline in gold prices during May-July also contributed to the moderation of core inflation.
Threshold diffusion indices for CPI excluding food, fuel, petrol, diesel, gold and silver indicate that a large majority of items exhibited price increases in excess of 4 per cent and 6 per cent (on a saar basis) during March-April 2022. Although pressures relaxed to some extent during May-July, these firmed up again for a majority of items in August (Chart II.20). Inflation in CPI excluding food, fuel, petrol, diesel, gold and silver registered increases across both goods and services during March-August 2022, reflecting pass-through of pent-up input cost pressures to output prices (Chart II.21a). During this period, core goods inflation remained significantly higher than core services inflation. Inflation in the goods component (with a weight of 20.7 per cent in the headline CPI) increased from 7.1 per cent in February 2022 to 7.7 per cent in April, driven by clothing and footwear items, household goods and personal care items (including fast-moving consumer goods (FMCGs) and household utensils) along with health, transport and communications goods. Though core goods inflation moderated to 6.5 per cent in May, the respite was short-lived as it edged up by around 72 bps during June-August, coming mainly from a further rise in inflation in clothing and footwear, and household goods and personal care items. 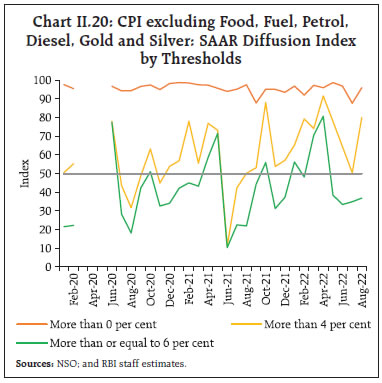 Core services inflation (with a weight of 23.0 per cent in the headline CPI) also rose from 4.7 per cent in February 2022 to 5.2 per cent in August (Chart II.21b), due to pressures from education (tuition and other fees), transport services (bus/tram/taxi fare, airfare, steamer/boat charges) and housing. Despite some rise, inflation in housing, the largest component in services, remained muted in H1 (averaging 3.8 per cent between April-August). Like exclusion-based core inflation indicators, trimmed mean measures12 point towards a generalised upsurge in inflation with a peak in April 2022 and some moderation thereafter till July. The trimmed measures picked up again in August (Table II.2). Other Measures of Inflation Inflation measured by sectoral CPIs for agricultural labourers (CPI-AL) and rural labourers (CPI-RL) remained below CPI headline inflation during July 2020-June 2022. Lower food inflation, combined with the high weightage of food in the CPI-AL and the CPI-RL vis-à-vis the CPI, contributed to the lower inflation prints during this period. In August 2022, with the rise in food prices, CPI-AL and CPI-RL inflation moved close to/marginally above CPI headline inflation. Inflation measured by the CPI for industrial workers (CPI-IW) persisted below the CPI headline during March-July 2022 as food inflation was generally lower in the CPI-IW vis-à-vis the CPI. Moreover, lower housing inflation in CPI-IW, paired with high weightage of housing vis-à-vis the headline, also added to the softness in CPI-IW inflation prints. | Table II.2: Trimmed Mean Measures of Core Inflation (y-o-y) | | Month | 5% trimmed | 10% trimmed | 25% trimmed | Weighted Median | | Jun-21 | 5.7 | 5.2 | 5.0 | 5.2 | | Sep-21 | 5.0 | 4.9 | 4.8 | 4.3 | | Dec-21 | 5.8 | 5.4 | 5.2 | 4.7 | | Jan-22 | 5.9 | 5.6 | 5.3 | 5.1 | | Feb-22 | 6.0 | 5.7 | 5.3 | 5.6 | | Mar-22 | 6.6 | 6.3 | 6.1 | 6.1 | | Apr-22 | 7.3 | 7.0 | 6.6 | 6.5 | | May-22 | 6.4 | 6.1 | 5.5 | 5.7 | | Jun-22 | 6.2 | 6.0 | 5.7 | 5.7 | | Jul-22 | 6.1 | 6.0 | 5.7 | 5.7 | | Aug-22 | 6.6 | 6.4 | 6.2 | 6.5 | | Sources: NSO; and RBI staff estimates. | WPI inflation has been in double digits since April 2021 and increased to an all-time high of 16.6 per cent (as per the WPI series, 2011-12=100) in May 2022 before moderating during June-August. Despite strong favourable base effects, the spike in crude oil and commodity prices following the war drove WPI inflation during March-May 2022. The steep rise in international commodity prices resulted in WPI non-food manufactured products inflation persisting in double digits during May 2021-May 2022. WPI inflation moderated to 12.4 per cent in August 2022 on account of an easing of price pressures in basic metals, textiles, and food products, particularly vegetable and animal oils and fats, in an environment of favourable base effects. In line with WPI inflation, the deflators for gross value added (GVA) and gross domestic product (GDP) edged up sharply between Q4:2021-22 to Q1:2022-23 (Chart II.22a). During March-August 2022, all the major sub-groups of WPI remained substantially above their corresponding CPI subgroups (Chart II.22b). Petrol and diesel prices inflation in WPI exceeded CPI inflation, largely reflecting the reductions in excise duty and state VAT rates which are captured in CPI but are excluded in WPI. High energy prices in the international market are mirrored in the fuel and power group of the WPI. The spike in international commodity prices and industrial intermediaries resulted in a hardening of WPI non-food manufactured products inflation, which also contributed to WPI inflation ruling above the CPI. Within food, WPI inflation was higher than CPI in cereals, vegetables, fruits, eggs and spices. Moreover, WPI does not include services, which is witnessing lower inflation compared with goods inflation in the CPI. II.3 Costs During H1:2022-23 (up to August), cost pressures measured by WPI inflation in industrial raw materials and farm inputs remained firm, notwithstanding some softening. Inflation in the prices of industrial inputs – such as high-speed diesel (HSD), naphtha, aviation turbine fuel (ATF), bitumen, petroleum coke, and furnace oil – which had peaked at 34.1 per cent in May 2022 under the impact of high crude oil prices moderated to 22.1 per cent in August with the correction in crude prices (Chart II.23). After hardening during March-May 2022, the prices of non-food primary articles eased from June 2022 due to the moderation in the prices of fibres and oilseeds mirroring international price trends. Prices of minerals, despite mixed trends and high volatility, broadly eased during March-August 2022. During July-August 2022, the pressures on industrial raw materials prices ebbed in line with the easing global metal prices. The export duty hike on iron ore and certain steel products also helped to contain price pressures (Chart II.23). The farm input price inflation was largely driven by increase in HSD prices, agricultural and forestry machinery, fodder on account of dry weather conditions, and fertilisers. Inflation in price of WPI electricity – a key input in both industrial and farm inputs – increased sharply due to positive momentum as well as adverse base effects. 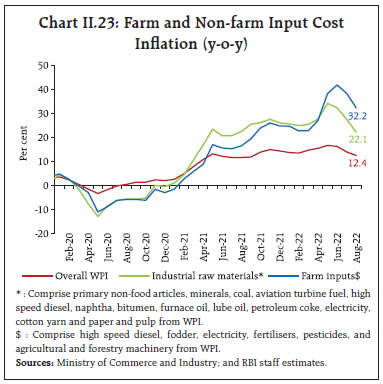 Nominal rural wage growth for both agricultural and non-agricultural labourers remained muted during H1:2022-23 (up to July) (Chart II.24). This can be expected to contain the build-up of a wage-price spiral (Box II.2). 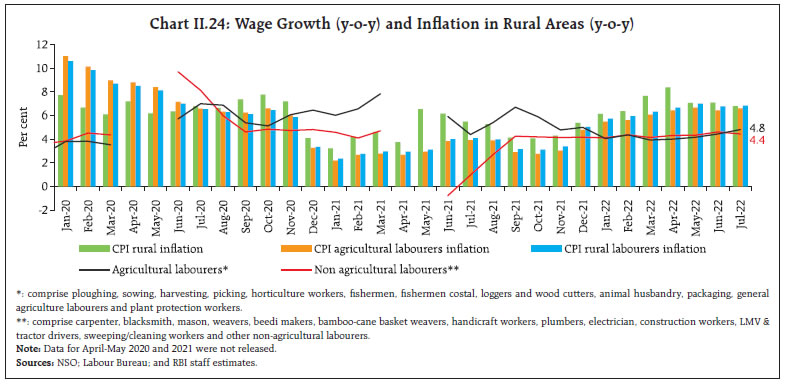
Box II.2: An Examination of the Rural Prices and Wages Dynamics in India Available data on rural wages and rural consumer price indices show episodes of co-movement as well as marked divergences (notably July 2010-October 2013 when rural real wages registered sharp increases, outpacing CPI inflation) (Chart II.2.1). In order to explore wage-price dynamics, a state-level cointegration panel analysis of the relationship between rural prices (using data for CPI-Rural) and rural wages (for agricultural and non-agricultural workers) for the pre-COVID period of April 2017 to February 2020 is undertaken. Pedroni’s panel tests suggest the existence of a long-term cointegrating relation between wages and prices. The long and short-run dynamics are examined on the basis of the Pooled Mean Group (PMG) estimator (Pesaran et al., 1999). The long-run coefficients are below unity in both the prices and wage equations (0.41 and 0.57, respectively), indicating less than proportional increase in prices in response to wage shocks and vice versa. Turning to short-run dynamics, the coefficients of the error correction term (ECT) in both the equations are significant: in the case of any shock, both prices and wages adjust quickly towards their long-run levels, and the speed of adjustment in prices is somewhat faster than in wages (Table II.2.1). 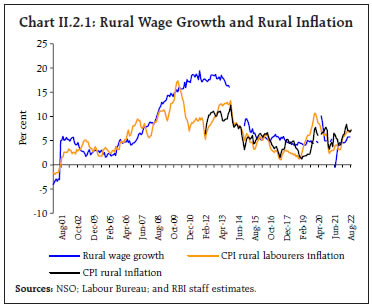
| Table II.2.1: Rural Wages and Rural Prices – Panel Cointegration Results | | Price Equation: Δln(price) | Wage Equation: Δln(wage) | | Long run equation: ln(price) = a x ln(wage) + ECT | Long run equation: ln(wage) = a x ln(price) + ECT | | a | 0.40***
(0.04) | a | 0.57***
(0.07) | | Short run equations | | ECT | -0.14***
(0.02) | ECT | -0.12**
(0.05) | | Δln(wage) | -0.05
(0.06) | Δln(price) | -0.03
(0.08) | | Δln(price) (-1) | 0.16***
(0.05) | Δln(wage) (-1) | -0.00
(0.06) | | Δln(wage) (-1) | -0.11*
(0.06) | Δln(price) (-1) | -0.22
(0.15) | | Rainfall deviation | 0.00***
(0.00) | Rainfall deviation | -0.00
(0.00) | | Constant | 0.37**
(0.05) | Constant | 0.39**
(0.15) | Note: ***, ** and * indicate significance at 1, 5 and 10 per cent levels, respectively. Figures in parentheses indicate standard errors.
1. The sample consists of 17 major states for the period April 2017 to Feb 2020.
2. Rural wages have been calculated as a simple average of the rural agricultural and rural non-agricultural wages, following Kundu (2019).
Source: RBI staff estimates. | References: Pesaran, M. Hashem, Yongcheol Shin, and Ron Smith (1999), “Pooled Mean Group Estimation of Dynamic Heterogeneous Panels”, Journal of the American Statistical Association, 94.446, pp. 621-634. Kundu, Sujata (2019), “Rural Wage Dynamics in India: What Role does Inflation Play”, RBI Occasional Paper, 40, pp. 51-84. | In the organised sector, growth in staff cost (y-o-y basis) decelerated in Q1:2022-23 in both manufacturing and services sectors. The share of staff cost in the value of production was broadly unchanged in the manufacturing sector in Q1 compared to the previous quarter, while it decreased marginally in the services sector (Chart II.25). As per the firms polled in the Reserve Bank’s enterprise surveys13, the pace of salary outgoes for the manufacturing sector is expected to moderate in Q3:2022-23 while the services and infrastructure sectors may see higher pressures. Input costs and selling prices for the manufacturing, services and infrastructure sector firms are likely to soften in Q3 (Chart II.26). One-year ahead business inflation expectations after peaking in April 2022, fell during May-July but ticked up in August 2022, according to the survey by the Indian Institute of Management, Ahmedabad.14 Survey respondents also reported that cost pressures re-emerged in August and optimism on sales and profit margins fell. According to manufacturing firms polled in the purchasing managers’ index (PMI) surveys, while input prices rose, there was an easing of the momentum during May-August 2022 due to softening metal and intermediate goods prices. In PMI services, input prices remained elevated, with an easing of the momentum in June-August 2022. Output price inflation for both manufacturing and services sectors was benign relative to input price inflation and the input-output price gap has moderated due to the softening input prices momentum, coupled with gradual pass-through of cost burdens (Chart II.27). II.4 Conclusion Inflationary pressures have escalated globally due to the successive black swan events – the COVID-19 pandemic and the conflict in Ukraine. Mirroring global developments, India also experienced a sharp pick-up in inflationary pressures in H1, following the jump in global commodity prices as well as due to adverse domestic weather shocks. Consumer price inflation peaked in April 2022. It has since then moderated, but persists above the pre-war levels and also above the upper tolerance band. Its return to the target is expected to be gradual. The outlook is, however, fraught with considerable uncertainties, given the highly volatile geopolitical situation, spillovers from the elevated global financial market volatility and recurring adverse climatic conditions. Monetary policy remains focused on ensuring that inflation remains within the target going forward, while supporting growth. __________________________________________________________________________________
III. Demand and Output Domestic economic activity exhibited resilience in H1:2022-23. The buoyancy in aggregate demand was supported by private consumption and investment demand. Geopolitical tensions, tightening of global financial markets and global economic slowdown, however, pose downside risks to the domestic outlook. Domestic economic activity exhibited resilience in H1:2022-23 in spite of some moderation in momentum relative to H2:2021-22. With the recovery of manufacturing and contact-intensive services, aggregate supply conditions are improving. Aggregate demand is underpinned by private consumption, which is holding up well and set to be boosted in the festival season. Investment activity gained traction with robust government capex. On the other hand, subdued government consumption and the contraction in net exports have operated as drags. Headwinds from intensified geopolitical tensions, elevated international commodity prices, heightened volatility in global financial markets, and slowdown in external demand are the key downside risks to the outlook. III.1 Aggregate Demand Real gross domestic product (GDP) posted a growth of 13.5 per cent (year-on-year, y-o-y) in Q1:2022-23, aided by favourable base effects. Accordingly, real GDP surpassed pre-pandemic level by 3.8 per cent (Chart III.1 and Table III.1). All constituents of aggregate demand recorded expansion in Q1 and were above their respective pre-pandemic levels. The momentum – the quarter-on-quarter (q-o-q) seasonally adjusted annualised growth rate (saar) - was, however, negative in Q1:2022-23, pulled down by government consumption and a sharp jump in imports (Chart III.1a and b). Available data for Q2 indicate that aggregate demand remained buoyant, supported by the ongoing recovery in private consumption and investment demand. 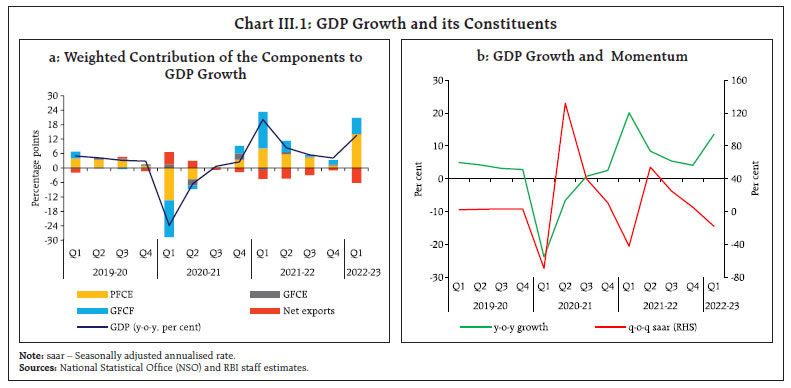
| Table III.1: Real GDP Growth | | (y-o-y, per cent) | | Item | 2020-21 (FRE) | 2021-22 (PE) | Weighted Contribution* | 2020-21 | 2021-22 | 2022-23 | | 2020-21 | 2021-22 | Q1 | Q2 | Q3 | Q4 | Q1 | Q2 | Q3 | Q4 | Q1 | | Private final consumption expenditure | -6.0 | 7.9 | -3.4 | 4.5 | -23.7 | -8.3 | 0.6 | 6.5 | 14.4 | 10.5 | 7.4 | 1.8 | 25.9 | | | | (1.4) | | | | | | | (-12.7) | (1.3) | (8.0) | (8.3) | (9.9) | | Government final consumption expenditure | 3.6 | 2.6 | 0.4 | 0.3 | 13.6 | -22.9 | -0.3 | 29.0 | -4.8 | 8.9 | 3.0 | 4.8 | 1.3 | | | | (6.3) | | | | | | | (8.2) | (-16.1) | (2.6) | (35.1) | (9.6) | | Gross fixed capital formation | -10.4 | 15.8 | -3.3 | 4.8 | -45.3 | -4.5 | -0.6 | 10.1 | 62.5 | 14.6 | 2.1 | 5.1 | 20.1 | | | | (3.8) | | | | | | | (-11.2) | (9.5) | (1.5) | (15.7) | (6.7) | | Exports | -9.2 | 24.3 | -1.8 | 4.6 | -25.5 | -6.4 | -8.6 | 3.7 | 40.8 | 20.7 | 23.1 | 16.9 | 14.7 | | | | (12.8) | | | | | | | (4.8) | (12.9) | (12.5) | (21.2) | (20.2) | | Imports | -13.8 | 35.5 | -3.2 | 7.5 | -41.1 | -17.9 | -5.2 | 11.7 | 61.1 | 41.0 | 33.6 | 18.0 | 37.2 | | | | (16.8) | | | | | | | (-5.1) | (15.7) | (26.7) | (31.8) | (30.3) | | GDP at market prices | -6.6 | 8.7 | -6.6 | 8.7 | -23.8 | -6.6 | 0.7 | 2.5 | 20.1 | 8.4 | 5.4 | 4.1 | 13.5 | | | | (1.5) | | | | | | | (-8.5) | (1.2) | (6.2) | (6.7) | (3.8) | Note: *: Component-wise contributions to growth do not add up to GDP growth because change in stocks, valuables and discrepancies are not included.
Figures in parentheses are growth rates over 2019-20. FRE: First revised estimates, PE: Provisional estimates.
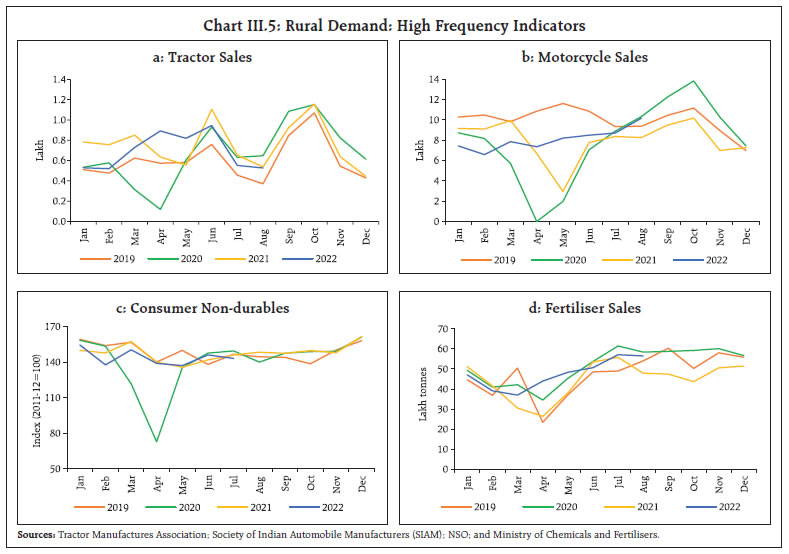
Source: National Statistical Office (NSO). | GDP Projections versus Actual Outcomes The April 2022 Monetary Policy Report (MPR) had projected real GDP growth at 16.2 per cent for Q1:2022-23. Actual growth undershot the projection by 270 basis points (bps) (Chart III.2), due to a larger-than-expected drag from net exports and sluggish growth in government expenditure. The growth in imports at 37.2 per cent in Q1 surprised significantly on the upside. III.1.1 Private Final Consumption Expenditure Private final consumption expenditure (PFCE) – the mainstay of aggregate demand – recorded a solid growth of 25.9 per cent in Q1:2022-23 and its share in overall GDP inched up to 59.9 per cent from 54.0 per cent a year ago. Expanded vaccination coverage and milder new COVID-19 infections (Chart III.3) provided a fillip to consumer confidence and discretionary spending, particularly on travel, hotels and restaurants, recreation and culture. Amongst the high frequency indicators (HFIs) of urban consumption, domestic air passenger traffic recorded a sustained recuperation, albeit still lagging its pre-pandemic levels (Chart III.4a). Passenger vehicle sales posted strong growth in Q1 and Q2, surging past pre-pandemic levels, despite headwinds from protracted supply chain disruptions (Chart III.4b). The production of consumer durables gained traction, boosted by discretionary spending (Chart III.4c). Improving urban consumption was also reflected in the acceleration in bank credit to households (Chart III.4d). 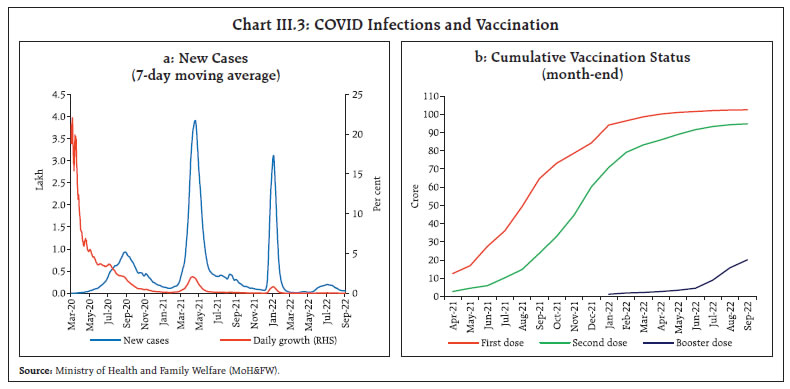 Rural demand remained muted in Q1:2022-23, with some signs of recovery in Q2. Work demanded under the Mahatma Gandhi National Rural Employment Guarantee Act (MGNREGA) declined sharply in July-August 2022, with improving conditions in the rural farm labour market. Motorcycle sales expanded y-o-y and exceeded pre-pandemic levels in August. The production of consumer non-durables remained subdued in H1. Tractor sales remained above their pre-pandemic levels, although they were lower y-o-y in July-August partly due to the high base of record sales registered last year. Fertiliser sales recovered in August with the progress of kharif sowing (Chart III.5). 
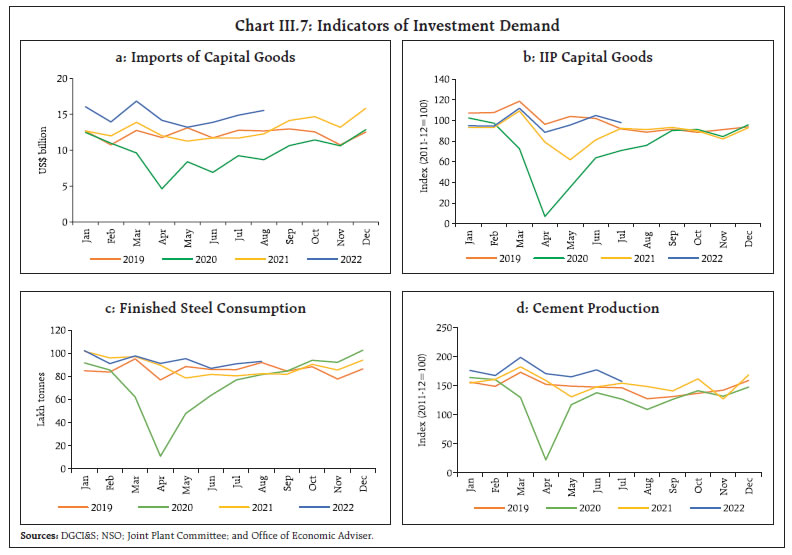
 As per the Centre for Monitoring Indian Economy’s (CMIE) Consumer Pyramids data, the labour force participation rate recovered in Q2 from the dip seen in June, which pulled up the unemployment rate in August across urban and rural segments (Chart III.6a). The Employees’ Provident Fund Organisation (EPFO) payrolls data pointed to improving employment conditions in the organised sector during July 2022 (Chart III.6b). According to Naukri Jobspeak data, increased hiring was witnessed in hospitality, retail, insurance, real estate, banking and financial services segments. III.1.2 Gross Fixed Capital Formation Gross fixed capital formation (GFCF) recorded a growth of 20.1 per cent in Q1:2022-23; consequently, the share of GFCF in GDP rose to 34.7 per cent in Q1 from 32.8 per cent a year ago. Construction activity exhibited buoyancy, with the housing sector recording an uptick in terms of both units launched and sold during Q1. The proximate coincident indicators of construction activity – steel consumption and cement production – posted strong growth in H1 Chart III.7). Imports of capital goods were led by electronics goods while the domestic production of capital goods crossed its pre-pandemic level in June- July 2022. 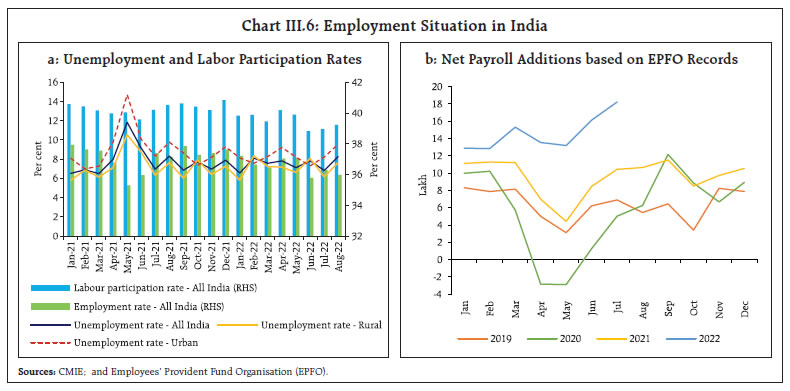
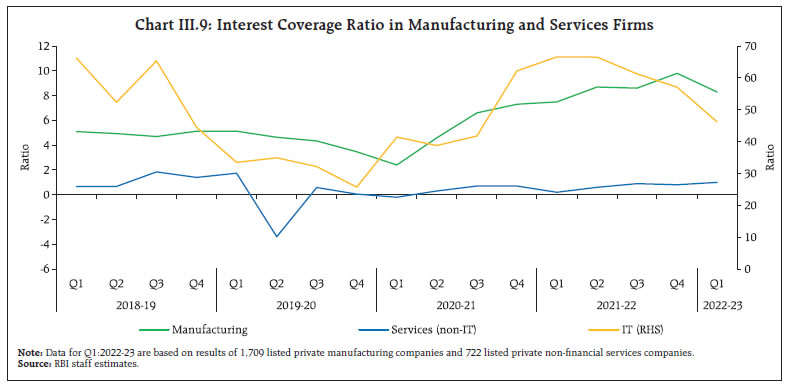
 According to the RBI’s survey1, capacity utilisation (CU) in the manufacturing sector declined to 72.4 per cent in Q1:2022-23 from 75.3 per cent in the previous quarter, reflecting seasonal pattern. Seasonally adjusted capacity utilisation, however, rose to 74.3 per cent in Q1:2022-23 – the highest in the last three years – from 73.0 per cent in the previous quarter (Chart III.8). Manufacturing firms recorded a sequential uptick in new orders during Q1:2022-23. Infrastructure firms displayed optimism on the overall business situation. turnover and employment in Q2:2022-23. The interest coverage ratio (ICR)2 of listed nonfinancial private companies in the manufacturing and information technology (IT) sectors remained high in Q1:2022-23, and indicates comfortable debt servicing capacity and conducive conditions for expansion in capacity (Chart III.9). III.1.3 Government Consumption The growth in government final consumption expenditure (GFCE) remained muted at 1.3 per cent in Q1:2022-23 [(-) 4.8 per cent a year ago], which dampened GDP growth (Table III.1). Revenue expenditure of the central government rose by 4.8 per cent (y-o-y) during April-July 2022 as against a contraction of 7.0 per cent a year ago. Component-wise, the impact of higher outgoes on interest payments was cushioned by lower spending on major subsidies, especially food. Capital outlay, on the other hand, surged by 59.4 per cent during April-July 2022, reflecting the government’s sustained thrust on infrastructure. This led to a qualitative improvement in spending – the revenue expenditure to capital outlay (RECO) ratio decreased to 4.8 in April-July 2022 from 7.3 in the corresponding period of the previous year (Chart III.10a). Frontloaded capital expenditure was driven by increased spending in road and railway sectors (Chart III.10b). 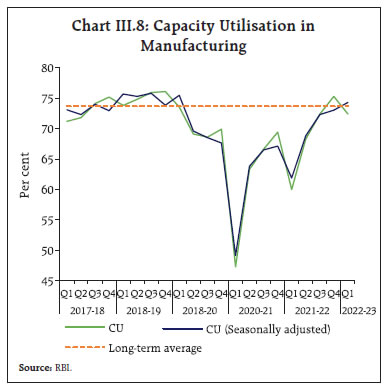
| Table III.2: Central Government’s Tax Collections | | Item | ₹ thousand crore | Per cent | | Budget Estimates | Actuals | Per cent to BE | Growth Rate | | 2021-22 | 2022-23 | Apr-July 2021 | Apr-July 2022 | Apr-July 2021 | Apr-July 2022 | Apr-July 2021 | Apr-July 2022 | | A. Direct taxes | 1,108.00 | 1,420.00 | 314.5 | 446.4 | 28.4 | 31.4 | 110.9 | 41.9 | | Of which | | | | | | | | | | 1. Corporation tax | 547 | 720 | 145.9 | 196.5 | 26.7 | 27.3 | 171.5 | 34.7 | | 2. Income tax | 548.5 | 680 | 161.2 | 241.8 | 29.4 | 35.6 | 76.7 | 50.0 | | B. Indirect taxes | 1,109.10 | 1,337.80 | 381.4 | 423.0 | 34.4 | 31.6 | 65.2 | 10.9 | | Of which | | | | | | | | | | 1. GST | 633.3 | 783.7 | 221.0 | 284.2 | 34.9 | 36.3 | 60.4 | 28.6 | | 2. Custom duties | 136 | 213 | 58.0 | 51.0 | 42.6 | 23.9 | 144.1 | -12.0 | | 3. Union excise duties | 335 | 335 | 100.4 | 85.1 | 30 | 25.4 | 47.9 | -15.2 | | C. Gross tax revenue | 2,217.10 | 2,757.80 | 695.9 | 869.5 | 31.4 | 31.5 | 83.1 | 24.9 | | D. Assignment to States/UTs | 665.6 | 816.6 | 165.1 | 201.1 | 24.8 | 24.6 | -6.2 | 21.8 | | E. Net tax revenue | 1,545.40 | 1,934.80 | 529.2 | 666.2 | 34.2 | 34.4 | 161.0 | 25.9 | Note: GST also includes UT-GST.
Sources: Union Budget Documents and CGA. |
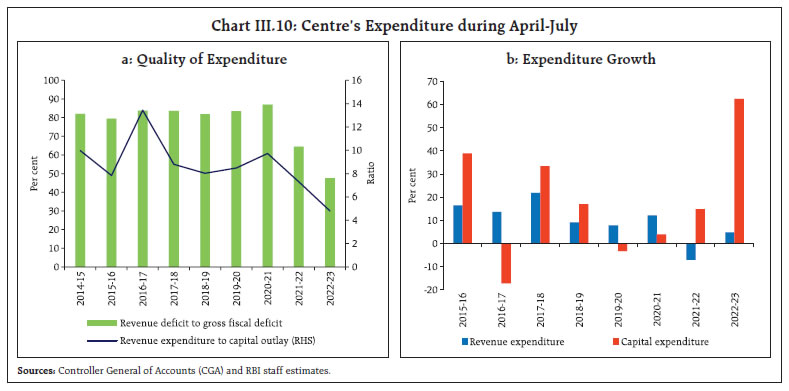
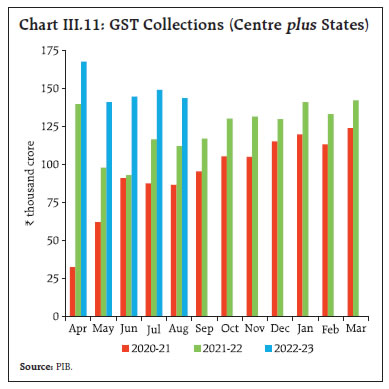 On the receipts side, the central government’s gross tax revenues remained buoyant, registering a growth of 24.9 per cent during April-July 2022, driven by direct tax and GST collections. Monthly GST collections (Centre plus states) remained above ₹1.4 lakh crore since March 2022, benefitting from improving economic activity and compliance (Chart III.11). Union excise duties and customs duties, however, contracted on the back of cuts in excise duty on petrol and diesel in May 2022 and a reduction in customs duty on commodities such as cotton and palm oil. The central government’s non-tax revenues fell during April-July due to lower dividends and profits (Chart III.12). The recently concluded 5G spectrum auctions would provide a total revenue of ₹1.5 lakh crore; of this, the first annual instalment would amount to ₹17,875 crore. Disinvestment receipts jumped to ₹24,560 crore from ₹8,371 crore, driven by the proceeds of the initial public offer (IPO) of the Life Insurance Corporation (LIC). During April-July 2022, the gross fiscal deficit (GFD) and the revenue deficit (RD) of the central government at 20.5 per cent and 16.4 per cent of the full-year budget estimate (BE), respectively, were lower than in the previous year. As regards state governments, their consolidated GFD is budgeted at 3.3 per cent of their conslolidated GSDP in 2022-233 – within the 4 per cent4 limit allowed by the Centre – supported by a healthy growth in revenue receipts (Table III.3 and Chart III.13a). The states have continued their focus on capital expenditure, with a budgeted growth of 36 per cent in capital outlay. This would increase the capital outlay-GSDP ratio to 2.7 per cent in 2022-23 from 2.2 per cent in 2021-22 (PA). According to available data, the states’ GFD declined substantially in Q1:2022-23 on account of higher revenues and devolution from the Centre (Chart III.13b). Revenue expenditure of states grew by 14.3 per cent while capital expenditure contracted by 9.6 per cent. | Table III.3: State Government Finances – Key Deficit Indicators | | (Per cent of GSDP) | | Item | 2020-21 (A) | 2021-22 (BE) | 2021-22 (PA) | 2022-23 (BE) | | Revenue Deficit | 1.8 | 0.8 | 0.4 | 0.4 | | Gross Fiscal Deficit | 3.8 | 3.6 | 2.7 | 3.3 | | Primary Deficit | 2.0 | 1.7 | 1.1 | 1.5 | A: Accounts; BE: Budget Estimates; PA: Provisional Accounts.
Note: Data pertain to 29 states and UTs.
Sources: Budget Documents of State Governments; Comptroller and Auditor General (CAG) of India. |
The Union Budget 2022-23 provided for a 50-year interest-free loan of ₹1 lakh crore to states under the ‘Special Assistance to States for Capital Investment’ scheme, over and above the borrowing limit of 4 per cent of GSDP. In August 2022, the Centre released two instalments of tax devolution amounting ₹1.16 lakh crore to the states to boost their capex. In the Union Budget 2022-23, gross and net market borrowings were placed at ₹14.95 lakh crore and ₹11.19 lakh crore, respectively. Taking into account the switch operations conducted just before the Union Budget 2022-23, the gross market borrowings through dated securities for 2022-23 are estimated at ₹14.31 lakh crore. The centre’s gross issuances of market borrowings during H1:2022-23 (up to September 27, 2022) were ₹7.96 lakh crore (55.6 per cent of the full year’s budgeted amount) as against ₹8.45 lakh crore planned in the calendar for H1 (Table III.4). The weighted average cost and maturity of issuances during H1 (up to September 27, 2022) were 7.3 per cent and 15.7 years, respectively, as against 6.2 per cent and 16.7 years, respectively, during 2021-22. States raised gross market borrowings of ₹2.76 lakh crore during H1 (up to September 27, 2022), 68.8 per cent of the indicative calendar. The Ways and Means Advances (WMA) limit for the Central Government for H1:2022-23 was enhanced to ₹1.5 lakh crore from ₹1.2 lakh crore in H1:2021-22 for bridging temporary mismatches between receipts and expenditure. For states/union territories, the WMA limits were fixed at ₹47,010 crore effective from April 1, 2022 as recommended by the Advisory Committee on Ways and Means Advances to State Governments (Chairman: Shri Sudhir Shrivastava). | Table III.4: Government Market Borrowings | | (₹ crore) | | | 2020-21 | 2021-22 | 2022-23 (up to September 27) | | Centre | States | Total | Centre | States | Total | Centre | States | Total | | Net borrowings | 11,43,114 | 6,51,777 | 17,94,891 | 8,63,103 | 4,92,483 | 13,55,586 | 5,68,639 | 1,79,878 | 7,48,517 | | Gross borrowings | 13,70,324 | 7,98,816 | 21,69,140 | 11,27,382 | 7,01,626 | 18,29,008 | 7,96,000 | 2,76,347 | 10,72,347 | | Sources: Government of India; and RBI staff estimates. | III.1.4 External Demand Amidst persisting geopolitical tensions and slowing external demand, merchandise exports lost pace during Q2 (July-August) after remaining resilient during Q1. Merchandise imports, however, remained buoyant during both Q1 and Q2 (July-August), reflecting strong domestic demand conditions. These developments led to a widening of the merchandise trade deficit (Chart III.14). Services trade, both exports and imports registered an impressive performance in Q1. With the growth of imports well above that of exports, net exports dragged down aggregate demand in Q1:2022-23 [(-) 8.1 per cent of GDP as compared with (-) 5.0 per cent in Q4:2021-22 and (-) 3.0 per cent a year ago]. 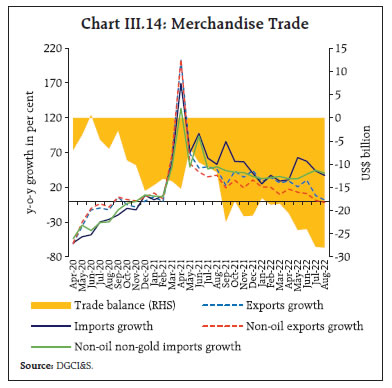 In April-August 2022, merchandise exports were driven by petroleum products, electronics, chemicals, engineering goods and ready-made garments. Exports of iron ore, cotton yarn, plastic and linoleum, handicrafts and carpets were, however, restrained (Chart III.15). Export restrictions on a few commodities such as wheat, steel and sugar due to domestic demand-supply balance also weighed on merchandise exports. 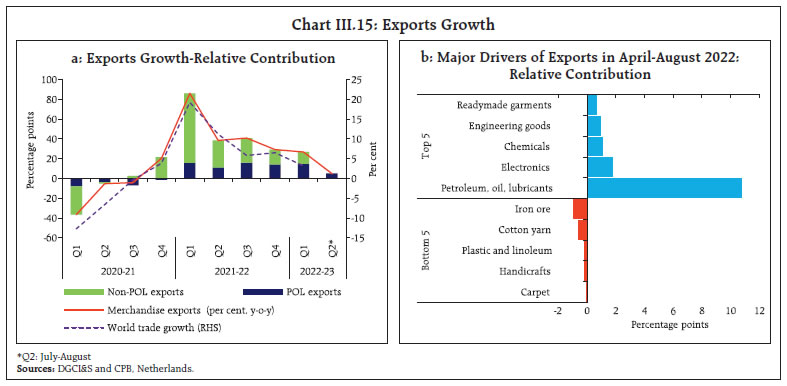
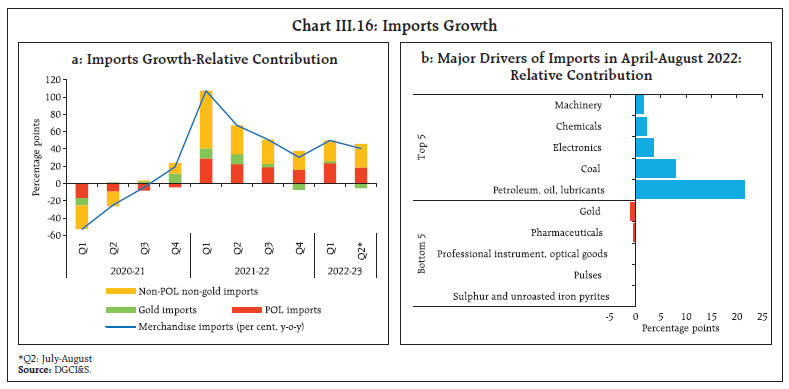 Rising domestic demand and high international commodity prices propelled merchandise imports in H1:2022-23 (April-August). Oil imports accounted for around half of this growth. Non-oil non-gold imports also remained strong led by coal, electronics, chemicals, and machinery. Coal imports grew substantially, despite elevated international prices, as the domestic demand for energy soared. The trade deficit more than doubled to US$ 124.5 billion in April-August 2022 from US$ 53.8 billion a year ago. Merchandise exports are sensitive to global trade volumes while merchandise imports are driven by domestic demand (Box III.1). Services sector trade posted a robust growth in H1:2022-23 (April-July), building upon the significant recovery during 2021-22 (Chart III.17). Services exports growth remained in double digits for the fifth consecutive quarter in Q1, buoyed by software services, business, travel and transportation services. Software and business services together constitute more than 60 per cent share of India’s total services exports. Although the risks of a recession in the US and Europe weigh on the software services sector, India’s offshoring capabilities and competencies and significant investments made by the major IT companies towards automation, cost efficiency, cloud adoption and technology are expected to keep the sector resilient. Services imports increased during Q1 on the back of a significant upsurge in outgoes under travel, transportation and business services. In July, services exports and imports remained buoyant, albeit the growth moderated. Box III.1: Drivers of India’s Merchandise Exports and Imports India’s share in global merchandise exports has risen steadily from 0.9 per cent in 2005 to 1.7 per cent in 2019 (pre-pandemic). After the COVID-19 disruption, both exports and imports rebounded strongly in 2021- 22. It is important to understand the drivers of Indian exports and imports and assess the relevant exchange rate and income elasticities on a disaggregated basis. For this, a panel cointegration analysis of 62 exported goods and 41 imported goods, belonging to four major groups, viz. agriculture commodities, metals, minerals and metal products, petroleum products and chemical and pharmaceutical products is undertaken. The volumes of exports and imports are determined by the item-level relative prices of exports/imports5, real effective exchange rate (REER), global demand (for exports), and domestic demand (for imports) (Raissi et al 2015). Relative prices measure industry-specific competitiveness while the REER (40-currency trade- or export-weighted) is as an indicator of overall external competitiveness; the empirical analysis explores the sensitivity of the results to both these indicators. World trade volume6 and domestic demand (GDP excluding imports at constant prices) are used as indicators of global demand and domestic activity, respectively. The empirical analysis is based on pre-pandemic data (Q1:2011-12 to Q3:2019-20), using the pooled mean group (PMG) estimator (Pesaran et al., 1999). The results indicate the presence of a long-run co-integrating relationship between exports, relative prices, REER and global demand on the one hand, and between imports, relative prices, REER and domestic demand, on the other hand. Productivity gains can support exports which are also highly elastic to global demand. Merchandise imports exhibit a strong co-movement with domestic economic activity, with an elasticity close to unity. The estimated elasticity of exports with respect to REER ranges from (-) 0.37 to (-) 0.39 in alternate specifications and from (+) 0.41 to (+) 0.63 for imports. India’s exports could get some boost from productivity gains, policy initiatives like the One District, One Product (ODOP) scheme and the recently signed and the proposed bilateral trade agreements. | Table III.1.1: Determinants of Indian Merchandise Exports and Imports: Pooled Mean Group Results | | Dependent Variable | Log (Exports Volume) | Log (Imports Volume) | | 1 | 2 | 3 | 4 | 5 | 6 | | Log (REER) | -0.39* | | -0.37* | 0.41** | | 0.63*** | | | (0.22) | | (0.21) | (0.16) | | (0.16) | | Log (Relative Price, item-level) | | -0.43*** | -0.38*** | | -0.17*** | -0.16*** | | | | (0.04) | (0.04) | | (0.04) | (0.04) | | Log (World Trade Volume) | 1.03*** | 1.30*** | 1.48*** | | | | | | (0.15) | (0.11) | (0.15) | | | | | Log (Domestic Demand) | | | | 1.00*** | 0.96*** | 0.86*** | | | | | | (0.05) | (0.04) | (0.05) | | ECT t-1 | -0.46*** | -0.41*** | -0.40*** | -0.58*** | -0.51*** | -0.51*** | | | (0.03) | (0.03) | (0.03) | (0.05) | (0.05) | (0.05) | Notes: ***, ** and * indicate statistical significance at 1 per cent, 5 per cent and 10 per cent level of significance, respectively. Figures in parentheses are robust standard errors. ECT: error correction term.
Source: RBI staff estimates. | References Raissi, M. and Volodymyr Tulin, 2015, “Price and Income Elasticity of Indian Exports – The Role of Supply-Side Bottlenecks,” IMF Working Paper WP/15/161 Pesaran, M. Hashem, Yongcheol Shin, and Ron Smith (1999), “Pooled Mean Group Estimation of Dynamic Heterogeneous Panels”, Journal of the American Statistical Association, 94.446, pp. 621-634. | The current account deficit was 2.8 per cent of GDP in Q1: 2022-23. The merchandise trade deficit was at 8.1 per cent of GDP while the net invisibles surplus was 5.3 per cent of GDP. Turning to the financial account, net FDI flows stayed robust at US$ 18.8 billion during April-July 2022 (Chart III.18). Manufacturing, retail and wholesale trade, computer services, financial services, and communication services accounted for a major share of FDI in India during Q1. Singapore, Mauritius, the UAE, the US and the Netherlands were the major source countries of inward FDI to India, accounting for around 78 per cent of the total inflows. Foreign portfolio investors (FPIs) reduced their exposure in domestic capital market in Q1, reflecting the generalised risk aversion towards EME assets in the face of the strengthening of US dollar, intensified geopolitical tensions, elevated global inflation and faster policy tightening by major central banks. FPIs, however, turned net buyers in Q2 with an investment of US$ 7.5 billion (up to September 28). External commercial borrowings (ECBs) to India recorded net outflows of US$ 2.6 billion during April-August 2022, after net inflows of US$ 7.4 billion during 2021. Net flows under non-resident deposits moderated to US$ 1.4 billion during April-July 2022 from US$ 3.1 billion a year ago, due to outflows from FCNR(B) deposits and lower inflows in NRE deposits. As on September 23, 2022, India’s foreign exchange reserves stood at US$ 537.5 billion. III.2 Aggregate Supply Aggregate supply – measured by gross value added (GVA) at basic prices – expanded by 12.7 per cent in Q1:2022-23 (18.1 per cent a year ago), surpassing its pre-pandemic level of Q1:2019-20 by 4.7 per cent (Table III.5). While agriculture and services sectors remained robust, industrial GVA growth moderated due to the escalation of input cost pressures and the lingering disruptions in global supply chains. The momentum of GVA, measured by q-o-q saar, was negative in Q1:2022-23 (Chart III.19). | Table III.5: Sector-wise Growth in GVA | | (y-o-y, per cent) | | Item | 2020-21 (FRE) | 2021-22 (PE) | Weighted Contribution | 2020-21 | 2021-22 | 2022-23 | | 2020-21 | 2021-22 | Q1 | Q2 | Q3 | Q4 | Q1 | Q2 | Q3 | Q4 | Q1 | | Agriculture, forestry and fishing | 3.3 | 3.0 | 0.5 | 0.5 | 3.0 | 3.2 | 4.1 | 2.8 | 2.2 | 3.2 | 2.5 | 4.1 | 4.5 | | | | (6.4) | | | | | | | (5.2) | (6.4) | (6.7) | (7.1) | (9.9) | | Industry | -1.8 | 9.8 | -0.4 | 2.2 | -28.1 | 3.0 | 6.2 | 11.6 | 40.4 | 6.6 | 1.5 | 1.0 | 6.0 | | | | (7.9) | | | | | | | (0.9) | (9.9) | (7.8) | (12.7) | (7.0) | | Mining and quarrying | -8.6 | 11.5 | -0.2 | 0.3 | -17.8 | -7.9 | -5.3 | -3.9 | 18.0 | 14.5 | 9.2 | 6.7 | 6.5 | | | | (1.9) | | | | | | | (-3.0) | (5.5) | (3.4) | (2.6) | (3.3) | | Manufacturing | -0.6 | 9.9 | -0.1 | 1.8 | -31.5 | 5.2 | 8.4 | 15.2 | 49.0 | 5.6 | 0.3 | -0.2 | 4.8 | | | | (9.3) | | | | | | | (2.1) | (11.0) | (8.7) | (15.0) | (7.0) | | Electricity, gas, water supply and other utilities | -3.6 | 7.5 | -0.1 | 0.2 | -14.8 | -3.2 | 1.5 | 3.2 | 13.8 | 8.5 | 3.7 | 4.5 | 14.7 | | | | (3.6) | | | | | | | (-3.0) | (5.0) | (5.2) | (7.9) | (11.2) | | Services | -7.8 | 8.8 | -4.9 | 5.4 | -24.3 | -10.4 | 0.0 | 4.3 | 15.5 | 10.0 | 6.6 | 5.0 | 17.5 | | | | (0.4) | | | | | | | (-12.6) | (-1.4) | (6.6) | (9.4) | (2.8) | | Construction | -7.3 | 11.5 | -0.6 | 0.9 | -49.4 | -6.6 | 6.6 | 18.3 | 71.3 | 8.1 | -2.8 | 2.0 | 16.8 | | | | (3.4) | | | | | | | (-13.3) | (0.9) | (3.6) | (20.6) | (1.2) | | Trade, hotels, transport, communication | -20.2 | 11.1 | -4.1 | 1.9 | -49.9 | -18.8 | -10.1 | -3.4 | 34.3 | 9.6 | 6.3 | 5.3 | 25.7 | | | | (-11.3) | | | | | | | (-32.7) | (-11.0) | (-4.4) | (1.7) | (-15.5) | | Financial, real estate and professional services etc. | 2.2 | 4.2 | 0.5 | 1.0 | -1.1 | -5.2 | 10.3 | 8.8 | 2.3 | 6.1 | 4.2 | 4.3 | 9.2 | | | | (6.6) | | | | | | | (1.1) | (0.6) | (14.9) | (13.4) | (10.5) | | Public administration, defence and other services | -5.5 | 12.6 | -0.7 | 1.6 | -11.4 | -10.2 | -2.9 | 1.7 | 6.2 | 19.4 | 16.7 | 7.7 | 26.3 | | | (6.4) | | | | | | | (-5.9) | (7.3) | (13.3) | (9.5) | (18.9) | | GVA at basic prices | -4.8 | 8.1 | -4.8 | 8.1 | -21.4 | -5.9 | 2.1 | 5.7 | 18.1 | 8.3 | 4.7 | 3.9 | 12.7 | | | | (2.9) | | | | | | | (-7.2) | (1.9) | (6.9) | (9.8) | (4.7) | Note: FRE: First revised estimates; PE: Provisional estimates.
Figures in parentheses are growth rates over 2019-20.
Source: NSO. |
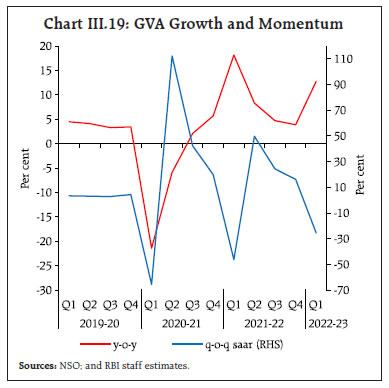 III.2.1 Agriculture GVA in agriculture, forestry and fishing posted a growth of 4.5 per cent in Q1:2022-23 (2.2 per cent a year ago) on the back of record rabi and horticulture production and resilience in allied activities. After a sluggish start, the south-west monsoon (SWM) gained momentum in July-August and the season’s rainfall stood at 7 per cent above the long period average (LPA) as on September 29, 2022 (1 per cent below LPA a year ago), with 30 out of the 36 sub-divisions receiving normal or above normal rainfall (Chart III.20a and b). Some of the key rice-producing states, however, received rainfall well below normal – Uttar Pradesh (-28 per cent), Bihar (-31 per cent), Jharkhand (-21 per cent) and West Bengal (-17 per cent). After lagging in June-July, the area under kharif sowing made a smart recovery in August. As of September 23, 2022, the total kharif sowing area was 1.7 per cent above the normal area (5-year average); it was, however, 1.2 per cent below a year ago due to shortfalls under rice (-5.5 per cent), pulses (-3.9 per cent) and oilseeds (-0.8 per cent) (Chart III.20c). The production weighted rainfall (PRN) index at 100 as on September 23, 2022 was a tad below its last year’s position (101 per cent) and the PRN for cotton, oilseeds, pulses and coarse cereals exceeded the 5-year average (Chart III.20e and f). As of September 22, 2022, reservoir levels stood at 88 per cent of the full capacity – above the last year’s 78 per cent as well as above the decadal average of 75 per cent – brightening the prospects for the upcoming rabi season. 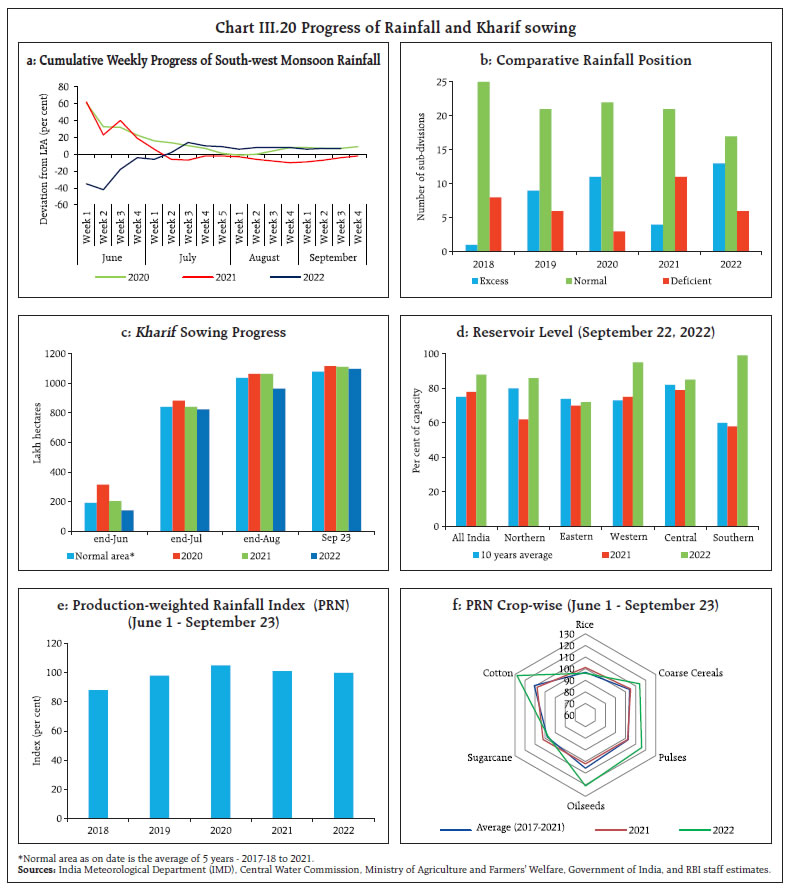 According to the first advance estimates (FAE), kharif 2022 foodgrains production is estimated at 1,499.2 lakh tonnes, 3.9 per cent below last year's fourth advance estimates (0.4 per cent below FAE of last year) driven by a decline of 6.1 per cent in rice production (Table III.6). Amongst other crops, cotton and sugarcane output are estimated to be 9.6 per cent and 7.7 per cent above the previous year’s level, while oilseeds output will be 1.3 per cent lower. The government announced an increase of 4.4 – 8.9 per cent in minimum support prices (MSP) for kharif 2022-23 crops, ensuring a return of at least 50 per cent over the cost of production (as measured by A2 plus FL7). The procurement of rice during the kharif marketing season 2021-22 (up to September 26, 2022) at 592.8 lakh tonnes was 0.1 per cent higher over the previous year, contributing to comfortable stocks of rice at 2.6 times the buffer norm (352.9 lakh tonnes), despite the extension of cereals distribution under the Pradhan Mantri Garib Kalyan Anna Yojana (PM-GKAY). In the case of wheat, lower domestic production resulted in lower procurement. As on August 31, 2022, stocks at 248.2 lakh tonnes were marginally below the buffer norm (Chart III.21a and b). | Table III.6: Kharif Crops Production | | (Lakh tonnes) | | Item | 2019-20 | 2020-21 | 2021-22 | 2022-23 | 2022-23 | | 1st AE | Growth (per cent) over 2021-22 | | 1st AE | 4th AE | | 1. Foodgrains | 1,433.8 | 1,495.6 | 1,560.4 | 1,499.2 | -0.4 | -3.9 | | Rice | 1,019.8 | 1,044.1 | 1,117.6 | 1,049.9 | -1.9 | -6.1 | | Coarse cereals | 336.9 | 364.6 | 359.1 | 365.6 | 7.5 | 1.8 | | Pulses | 77.2 | 86.9 | 83.7 | 83.7 | -11.4 | 0 | | Tur | 38.3 | 42.8 | 43.4 | 38.9 | -12.2 | -10.4 | | Urad | 13.0 | 16.0 | 19.4 | 18.4 | -10.2 | -5.2 | | Moong | 17.9 | 20.1 | 14.8 | 17.5 | -14.6 | 18.2 | | 2. Oilseeds (total) | 223.2 | 240.3 | 238.9 | 235.7 | 0.8 | -1.3 | | Groundnut | 83.7 | 85.6 | 83.8 | 83.7 | 1.4 | -0.1 | | Soyabean | 112.2 | 129.0 | 130.0 | 128.9 | 1.4 | -0.8 | | 3. Cotton# | 354.9 | 353.8 | 312.0 | 341.9 | -5.6 | 9.6 | | 4. Jute & Mesta## | 99.1 | 95.6 | 103.2 | 100.9 | 5 | -2.2 | | 5. Sugarcane | 3,557.0 | 3,992.5 | 4,318.1 | 4,650.5 | 10.9 | 7.7 | #: Lakh bales of 170 kgs each.
# #: Lakh bales of 180 kgs each.
Source: Ministry of Agriculture and Farmers’ Welfare. |
III.2.2 Industry Industrial GVA recorded a y-o-y growth of 6.0 per cent in Q1:2022-23 (40.4 per cent in the same period a year ago, driven by base effects). All components expanded y-o-y and surpassed their Q1:2019-20 levels, despite headwinds from higher input costs and global supply chain bottlenecks (Chart III.22). Electricity, gas, water supply and other utility services registered robust growth, supported by revival of industrial activity and normalisation of services. The index of industrial production (IIP) rose by 10.0 per cent, y-o-y, during April-July (4.2 per cent above the pre-pandemic level), supported by all its constituents – mining, manufacturing and electricity (Chart III.23). The expansion in manufacturing activity was driven by beverages, wearing apparel, furniture, printing and reproduction of recorded media and other transport equipment. In terms of the use-based classification, all categories expanded y-o-y during April-July. The production of capital goods posted double-digit growth, indicative of revival in investment activity. Consumer durables output also rose strongly, benefitting from the recovery in private consumption, especially urban demand. 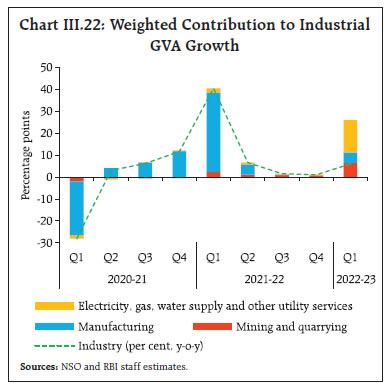
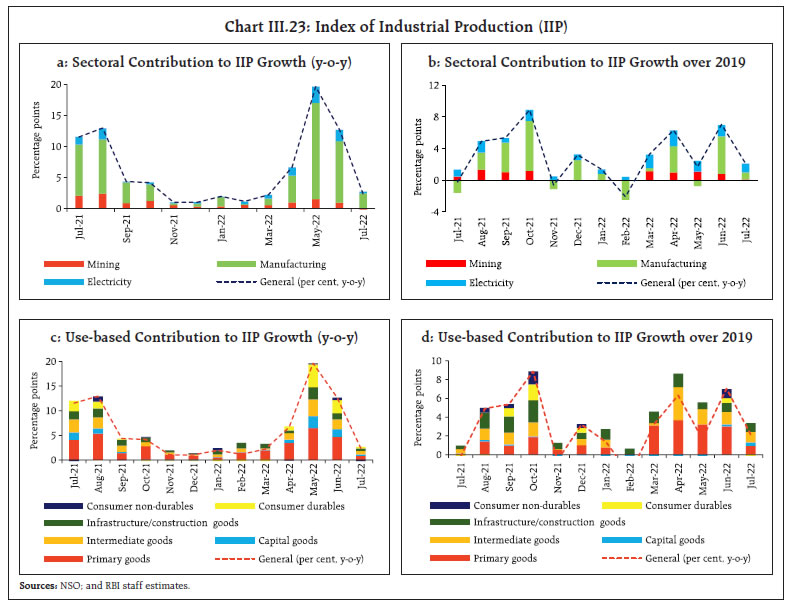
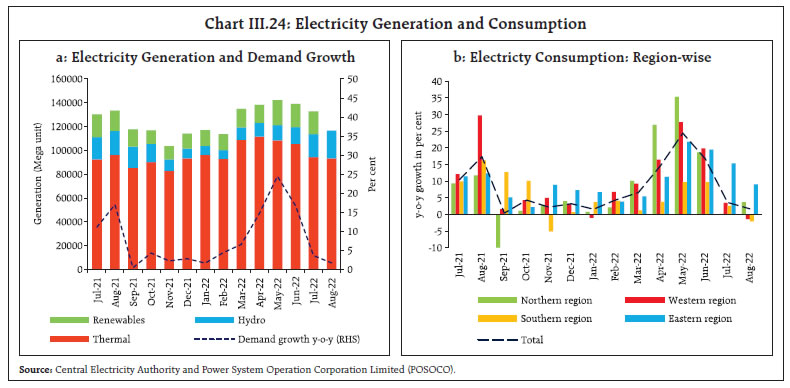 Electricity generation rose by 17.6 per cent (y-o-y) in Q1:2022-23 (15.3 per cent above the pre-pandemic level). Thermal and renewable sources expanded by 17.7 per cent and 28.3 per cent, respectively. In Q2 (July-August), overall electricity generation growth moderated to 2.7 per cent, partly due to abundant rainfall (Chart III.24a). Region-wise, electricity demand remained broad-based during H1 (Chart III.24b). The nominal GVA of listed manufacturing companies sustained a healthy expansion on the back of higher profits and staff costs (Chart III.25). According to the Reserve Bank’s industrial outlook survey, the manufacturing sector’s optimism waned marginally in Q2:2022-23. The manufacturing purchasing managers’ index (PMI) improved from 54.4 in Q1 to 56.3 in Q2 (56.4 in July and 56.2 in August) due to a pick-up in sales, capacity enhancements, and product diversification (Chart III.26a). Overall, manufacturing, primary goods, infrastructure & construction and capital goods sectors have normalised to pre-pandemic levels while consumer goods are trailing (Table III.7). Amongst major sub-sectors, steel consumption, cement production, electricity generation, passenger vehicles and two-wheelers indicate buoyancy and are above their 2019-20 output levels.
III.2.3 Services Services sector GVA rose by 17.5 per cent y-o-y in Q1:2022-23 (2.8 per cent above the pre-pandemic level), supported by sustained recovery in contact-intensive activities, and improving consumer confidence and business sentiment (Chart III.27a). Trade, hotels, transport, communication, and other services were resuscitated by increased resumption of operations and pent-up demand, but still remained below the pre-pandemic level by 15.5 per cent. High frequency indicators suggest a continued broadening of traction in services activity (Table III.8). GST collections and issuances of e-way bills – indicators of wholesale and retail trade and underlying overall economic activity – remained above pre-pandemic levels for the fourteenth straight month in August. Construction sector activity remained healthy in H1, as reflected by cement production and steel consumption, benefitting from government’s continued focus on boosting infrastructure and improving real estate activity (Chart III.27b). Travel and hospitality services recovered in Q1, with increased discretionary spending and pent-up demand. The hotel industry occupancy levels exceeded pre-pandemic levels in May-June 2022 but dipped marginally below in July-August. Transportation activity remained robust in H1 – commercial vehicle sales more than doubled y-o-y in Q1, while railway freight traffic posted a growth of 11.8 per cent in Q1 and 8.1 per cent in Q2 (up to August). Port cargo traffic rose by 9.2 per cent in Q1 and 11.6 per cent in Q2 (up to August) on the back of buoyant international trade (Table III.9). Passenger air traffic expanded by 206.2 per cent in Q1 and 74.1 per cent in Q2 (up to August) on improving tourism as well as business-related travels (Table III.9). Growth in financial, real estate and professional services improved to 9.2 per cent in Q1:2022-23 from 2.3 per cent a year ago, aided by a revival in real estate and the buoyancy in financial services. Bank credit growth accelerated to 16.2 per cent (y-o-y) as on September 9, extending support to financial services. In the real estate sector, new launches reached a 25-quarter high in Q1 and sales were at the highest in 10 quarters but still trailed pre-pandemic levels (Chart III.28a). Housing prices grew by 3.5 per cent (y-o-y) in Q1:2022-23, according to the RBI’s all-India housing price index, led by Chennai and Mumbai (Chart III.28). Public administration, defence and other services (PADO) increased by 26.3 per cent y-o-y in Q1:2022-23 (6.2 per cent a year ago), aided by other services (education, health, recreation and cultural, etc) even as government consumption recorded muted growth. 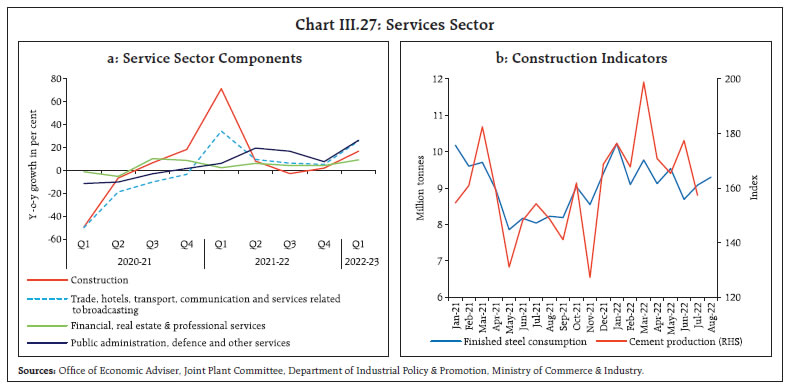
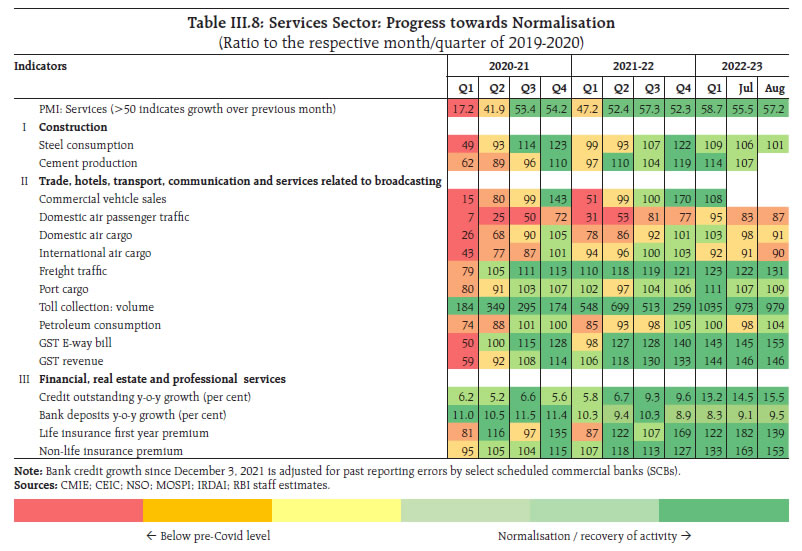
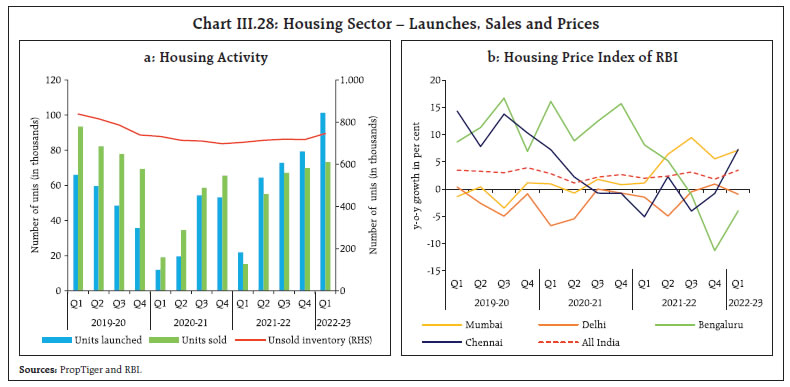 The PMI services remained in expansion zone in H1. After easing from 58.7 in Q1 to 55.5 in July, it rebounded to 57.2 in August (Chart III.27b). The Composite PMI index was 58.0 in Q1 and 57.4 in Q2 (July-August). III.3 Conclusion Domestic economic activity was resilient in H1:2022-23. Consumer confidence and business optimism propelled discretionary spending, demand for contact-intensive activities, and investment activity. Looking ahead, good progress under kharif sowing, adequate reservoir levels, Government’s continued thrust on capex, improved capacity utilisation in manufacturing, pick-up in non-food credit and waning COVID-19 infections should support aggregate demand and activity in H2. Geopolitical tensions, tightening of global financial markets and global economic slowdown, however, pose downside risks to the domestic outlook. __________________________________________________________________________________
IV. Financial Markets and Liquidity Conditions During H1:2022-23, domestic financial markets adjusted smoothly to the shift in monetary policy stance and exhibited resilience to global financial market headwinds and policy spillovers from AEs. Market rates have moved higher and bank credit offtake has improved. Going forward, the RBI will remain vigilant, agile and nimble in its liquidity management operations and would use all instruments at its disposal to mitigate the spillovers of global financial market volatility on domestic financial markets. Introduction During H1:2022-23, global financial markets experienced surges of volatility in the cross currents of geopolitical hostilities and aggressive monetary policy actions and stances across jurisdictions to combat elevated inflation pressures. As financial conditions tightened, bond yields hardened and stock markets plunged in H1 as mounting recession fears unnerved investor sentiments. In the currency markets, the US dollar strengthened against major global peers to a 20-year high by early-September, buoyed by the Fed’s front-loaded rate hikes, quantitative tightening, and rising safe haven demand. These developments triggered portfolio outflows from emerging market economies (EMEs) and imposed sharp depreciation pressures on their currencies, exacerbating risks to macroeconomic and financial stability. IV.1 Domestic Financial Markets Domestic financial markets were impacted by global spillovers recurringly, especially in the equities and forex segments. Money markets remained relatively insulated although interest rates hardened in response to the withdrawal of monetary accommodation domestically. Bond yields eased from mid-June highs but hardened intermittently. IV.1.1 Money Market Money market rates firmed up during H1:2022-23, reflecting policy repo rate increases by the RBI and the reduction in surplus liquidity. The institution of the standing deposit facility (SDF) rate as the floor of the liquidity adjustment facility (LAF) corridor on April 8, 2022 at 40 basis points above the fixed rate reverse repo (FRRR) provided initial momentum. On average, the weighted average call rate (WACR) traded 2 basis points (bps) below the SDF rate in H1:2022-23 (April 8 - September 27), as compared with 2 bps below the FRRR in H2:2021-22 (Chart IV.1). Transient liquidity tightness due to higher tax outflows and the resultant build-up of government cash balances temporarily firmed up the WACR above the policy repo rate in the fourth week of July and the second half of September. Liquidity injection through variable rate repo (VRR) auctions mitigated the temporary liquidity stress. In the overnight call money segment, the weighted average rate (WAR) of traded deals was 18 bps above the SDF rate while that of reported deals1 was 30 bps below during H1:2022-23 (April 8 - September 26), reflecting market segmentation as small cooperative banks – principal lenders in reported deals – brought in funds at lower rates towards the close of market hours (Chart IV.2a). The average monthly volume of traded deals at ₹1.39 lakh crore was higher than ₹1.01 lakh crore in the reported segment (Chart IV.2b). The share of reported deals in the total call money market volume declined to about 34 per cent in September 2022 from 68 per cent in March 2022, due to increased participation by public sector and foreign banks. 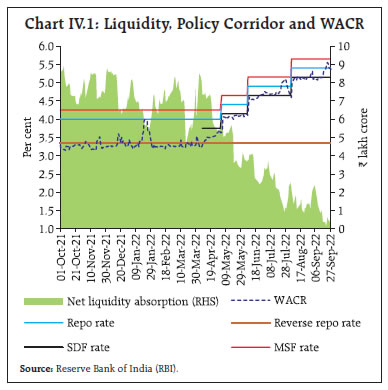
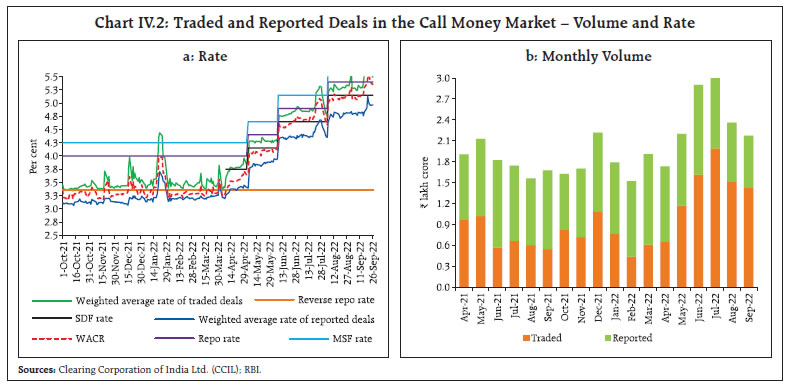 Money market activity remained dominated by the collateralised segments with the share of the uncollateralised call money market remaining at 2.0 per cent in H1:2022-23 (up to September 27). The share of triparty repo (TREPS) moderated to 73 per cent from 76 per cent a year ago, with a corresponding increase in the share of market repo to 25 per cent from 22 per cent (Chart IV.3). Among investors, the share of mutual funds (MFs) – the major lenders in the collateralised segment – in market repo declined to 46 per cent from 56 per cent, partly because of reduced inflows under debt mutual funds (up to August). MFs’ share in TREPS at 72 per cent in H1 was, however, unchanged. On the borrowing side, the share of public sector banks (PSBs) increased to 66 per cent from 64 per cent in TREPS and to 19 per cent from 16 per cent in market repo over the same period. 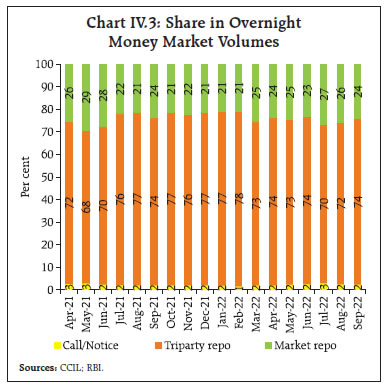 Interest rates on longer-term money market instruments – 3-month T-bills (TBs), certificates of deposit (CDs) and commercial paper (CPs) – moved higher during H1:2022-23. The spreads of TBs, CDs and CPs were 51 bps, 72 bps and 87 bps, respectively, above the SDF rate in H1:2022-23 (April 8 - September 26) as against 26 bps, 38 bps and 88 bps, respectively, above the FRRR during H2:2021-22 (Chart IV.4). The issuances of CDs increased to ₹2.96 lakh crore in H1:2022-23 (up to September 23) from ₹1.73 lakh crore in H2:2021-22, reflecting banks’ demand for funds to meet the buoyant credit offtake. Mobilisation of resources through the issuances of CPs, however, fell to ₹7.20 lakh crore during H1:2022-23 (up to September 26) from ₹10.09 lakh crore in H2:2021-22 (Chart IV.5a), as the appetite for bank credit improved. The weighted average discount rate (WADR) of CP issuances firmed up to 5.50 per cent in H1:2022- 23 from 4.47 per cent in H2:2021-22. Corporates remained the major issuers of CPs, with their share increasing to 60.2 per cent in H1:2022-23 from 53.3 per cent in H2:2021-22 (Chart IV.5b). 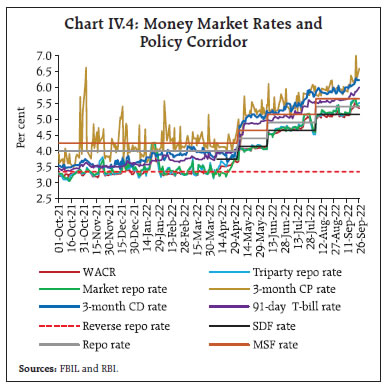
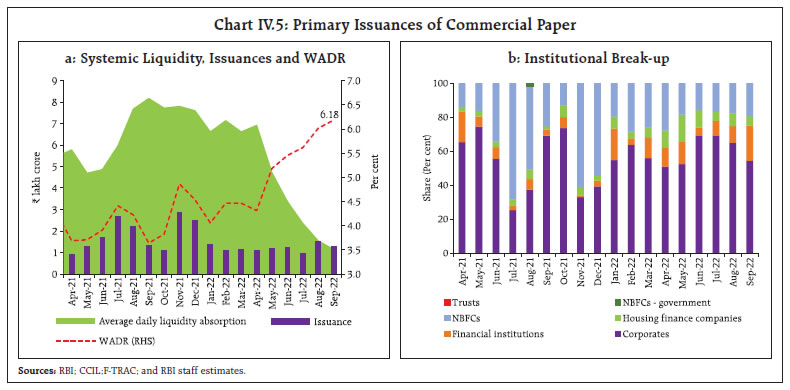
| Table IV.1: Maturity Profile of CP Issuances | | (₹ lakh crore) | | Tenor | H1: 2021-22 | H2: 2021-22 | H1: 2022-23 (up to September 26) | | 7- 30 days | 4.13 | 4.14 | 0.69 | | 31-90 days | 3.12 | 3.30 | 3.93 | | 91-180 days | 2.05 | 1.82 | 1.84 | | 181-365 days | 0.80 | 0.83 | 0.74 | | Total | 10.11 | 10.09 | 7.20 | | Outstanding (as at end-period) | 3.71 | 3.52 | 4.33 | | Sources: CCIL;F-Trac and RBI. | Most of the CP issuances were in the 31-90 days maturity segment (Table IV.1). The WADR of issuances in this maturity segment firmed up to 5.45 per cent in H1:2022-23 (up to September 26) from 3.97 per cent in H2:2021-22. IV.1.2 Government Securities (G-sec) Market During H1:2022-23, G-sec yields exhibited two-way movements (Chart IV.6). The generic 10-yr yield rose by 64 bps during Q1, driven by (i) the rise in US yields and crude prices; (ii) the announcement of a larger than anticipated Central Government borrowing auction calendar for H1:2022-23; (iii) higher than expected March and April CPI inflation prints; and (iv) the repo rate hike of 40 bps in an unscheduled meeting in May along with the 50 bps hike in the cash reserve ratio (CRR) (Box IV.1). In Q2 (up to September 27), the benchmark yield softened by 20 bps owing to the fall in crude prices, lower CPI inflation for July vis-à-vis June, the return of foreign portfolio investors (FPIs) as net buyers in August-September and expectations of India’s likely inclusion in global bond indices. Reflecting these factors, the 10-year yield moderated from its peak of 7.66 per cent (on June 16, 2022) to 7.09 per cent on September 13; it, however, rose to 7.30 per cent on September 27, 2022 reflecting policy rate hikes by major central banks and higher global bond yields. 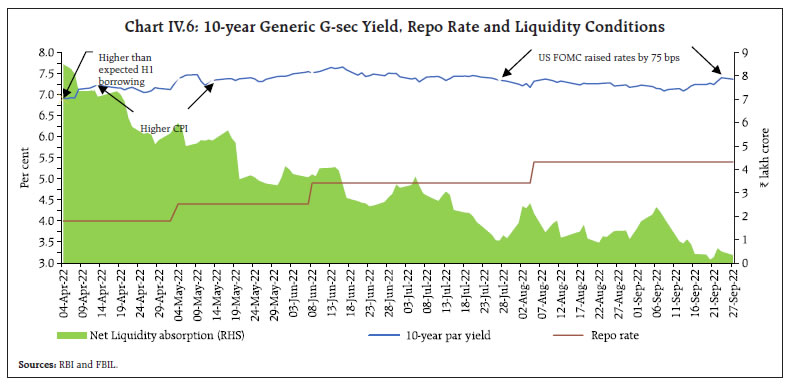
Box IV.1: Monetary Policy Surprises and Financial Markets Efficient financial markets are believed to price in the anticipated component of policy actions. In order to assess the true impact of policy announcements on the market interest rates, it is essential to segregate the surprise element (which the market might not have been able to predict) from the anticipated component of monetary policy (Kuttner, 2001). High frequency financial market variables such as overnight indexed swaps (OIS), futures and stock prices can be used to identify policy surprises (Gertler and Karadi, 2015). Akin to the global evidence, the OIS is found to reliably capture market expectations of the future path of the policy rate in India. Monetary policy surprises are identified by using the change in the 2-month OIS rate (given the bi-monthly policy cycle) on the policy day, while the residual is assumed to be the anticipated policy change. By narrowing the window around the policy announcement day, the change in the OIS rate can be reasonably attributed to monetary policy surprises. The change in the 2-month OIS rate on policy days may also contain a surprise on the path of expected future policy rates provided by the central bank’s forward guidance. This policy surprise is identified by splitting the change in policy rate/monetary policy decision into two parts – anticipated and unanticipated policy change (eq. 1) (Ahokpossi et al., 2020) – as follows: 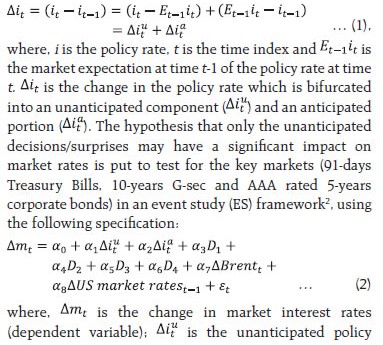 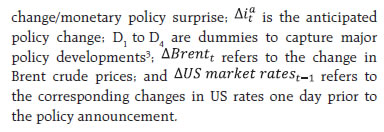 The empirical analysis indicates that anticipated policy changes are not significant for 10-year government securities and 5-year corporate bonds – only the surprise element has an impact on the yields of these securities (Table IV.1.1). The cumulative effect at the end of 2 days is higher (and significant) than the same day impact, suggesting that the markets take time to absorb policy surprises. In the case of treasury bills, while both surprise as well as anticipated policy changes matter, the surprise component is the major driver. Overall, interest rates in money and bond markets in India are found to respond significantly mainly to policy surprises in conformity with the efficient market hypothesis. | Table IV.1.1: Policy Impact on Financial Markets | | Variables | 91-days T-bill | 10-year G-sec | AAA 5-year Corp. bonds | | 1 day effect | 2 days effect | 1 day effect | 2 days effect | 1 day effect | 2 days effect | | | (1) | (2) | (3) | (4) | (5) | (6) | | Surprise | 0.721*** | 1.094*** | 0.284*** | 0.792*** | 0.875*** | 1.060*** | | | (0.153) | (0.121) | (0.072) | (0.224) | (0.196) | (0.221) | | Anticipated | 0.216*** | 0.211*** | 0.025 | 0.005 | 0.011 | 0.001 | | | (0.053) | (0.039) | (0.033) | (0.067) | (0.033) | (0.071) | | D1 | 0.119*** | 0.240*** | 0.101*** | 0.030 | 0.076*** | 0.095*** | | | (0.012) | (0.013) | (0.008) | (0.022) | (0.012) | (0.022) | | D2 | -0.599*** | -0.434*** | 0.049 | -0.057 | -0.141*** | -0.069** | | | (0.047) | (0.061) | (0.029) | (0.067) | (0.020) | (0.032) | | D3 | 0.139*** | 0.145*** | 0.052*** | 0.169*** | 0.248*** | 0.260*** | | | (0.013) | (0.037) | (0.016) | (0.030) | (0.018) | (0.017) | | D4 | -0.172*** | -0.262*** | 0.024 | 0.023 | 0.056 | 0.018 | | | (0.054) | (0.038) | (0.035) | (0.084) | (0.053) | (0.087) | | Change in Brent prices | -0.010 | -0.024*** | 0.000 | 0.000 | 0.001 | 0.010 | | | (0.009) | (0.008) | (0.008) | (0.012) | (0.009) | (0.011) | | Change in US 91-days T-bill, lag 1 | 0.063 | -0.405 | - | - | - | - | | | (0.336) | (0.330) | | | | | | Change in US 5-years G-sec, lag 1 | - | - | - | - | 0.161 | -0.070 | | | | | | | (0.304) | (0.272) | | Change in US 10-years G-sec, lag 1 | - | - | 0.258 | -0.127 | - | - | | | | | (0.160) | (0.373) | | | | Constant | -0.036*** | -0.027** | -0.011* | -0.006 | -0.017 | -0.018 | | | (0.011) | (0.010) | (0.006) | (0.015) | (0.010) | (0.013) | | Observations | 37 | 37 | 37 | 37 | 37 | 37 | | Adjusted R2 | 0.861 | 0.896 | 0.310 | 0.518 | 0.698 | 0.626 | | LM test (p-value) | 0.69 | 0.81 | 0.03 | 0.10 | 0.16 | 0.03 | Note: Figures in parentheses refer to the Newey-West standard errors (corrected for heteroscedasticity and autocorrelation).
***,**,* denote levels of significance at 1%, 5% and 10%, respectively.
Source: RBI staff estimates. | References: Kuttner, K. N. (2001), “Monetary Policy Surprises and Interest Rates: Evidence from the Fed Funds Futures Market”, Journal of Monetary Economics, Vol. 47, Issue 10, pp. 523-544. Gertler, M., and Karadi, P. (2015), “Monetary Policy Surprises, Credit Costs, and Economic Activity”, American Economic Journal: Macroeconomics, Vol. 7(1), pp. 44-76. Ahokpossi, C., Isnawangsih, A., Naoaj, M. S., and Yan, T. (2020), “The Impact of Monetary Policy Communication in an Emerging Economy: The Case of Indonesia”, IMF Working Paper, WP/20/109. | Yields on T-bills firmed up across tenors in sync with the increases in the policy repo rate and the introduction of the SDF (Chart IV.7). Average trading volume in both G-secs and T-bills increased year-on-year in H1:2022-23 (up to September 26) (Chart IV.8). The weighted average yield of traded maturities for G-sec and T-bills increased by 95 bps and 144 bps, respectively. The dynamics of yield curve movements are captured by its level, slope, and curvature4. While the average level of yields hardened by 64 bps, the slope flattened by 206 bps during H1:2022-23 (up to September 26) due to relatively higher increase in the short-term rates consequent to policy tightening (Chart IV.9). Alongside, the curvature declined perceptibly by 190 bps indicating a reduction in the hump of the curve, as the yield hardening in the mid-segment of the curve was less than in the short and long segments. In the Indian context, unlike the AEs, the level and curvature of the yield curve have more information content on future macroeconomic outcomes than the slope.5 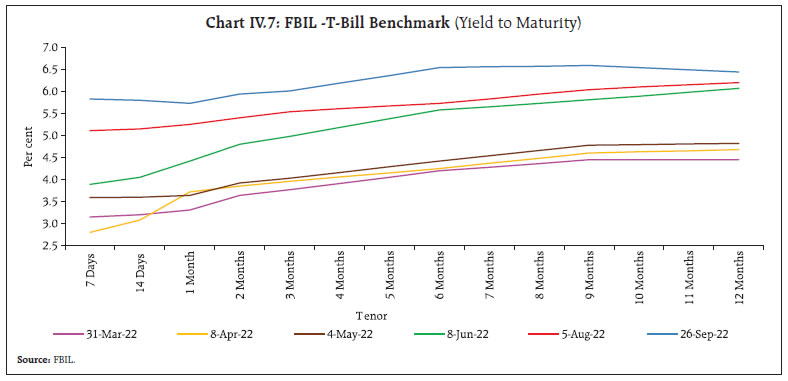
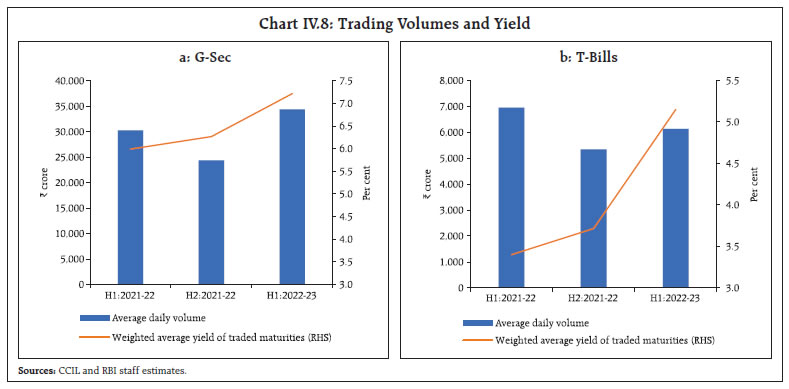 To facilitate debt consolidation, the Reserve Bank conducted six switch auctions on behalf of the Central Government amounting to ₹56,103 crore during H1:2022-23 (up to September 27, 2022). The weighted average maturity (WAM) of the outstanding stock of G-sec increased to 11.94 years as on September 27, 2022 from 11.71 years at end-March 2022. The weighted average coupon (WAC) at 7.15 per cent during H1 (up to September 27) remained higher than 7.11 per cent as at end-March 2022.
The weighted average spread of cut-off yields on state government securities (SGS) over G-sec yields of comparable maturities was 32 bps in H1:2022-23 (up to September 27) (Chart IV.10). The average inter-state spread on securities of 10-year tenor (fresh issuances) was 3 bps in H1:2022-23 (4 bps in H2:2021-22). IV.1.3 Corporate Bond Market Corporate bond yields moved higher in H1, broadly tracking G-sec yields. The average yield on AAA-rated 3-year bonds issued by non-banking financial companies (NBFCs) and corporates increased by 156 bps (to 7.52 per cent) and by 170 bps (to 7.56 per cent), respectively, in H1:2022-23 (up to September 27). The yield on issuances by public sector undertakings (PSUs), financial institutions (FIs) and banks rose by 143 bps to 7.25 per cent (Chart IV.11a). The average risk premium (measured by spread over 3-year G-sec yields) increased from 35 bps to 41 bps for NBFCs, from 25 bps to 45 bps for corporates while it moderated from 21 bps to 14 bps for PSUs, FIs and banks (Chart IV.11b). The increase in risk premia was seen in other tenors (albeit more at longer segments) and rating spectrum as well (Table IV.2). The 3-year credit default swap (CDS) spreads for the papers trading overseas of State Bank of India and ICICI Bank increased by 32 bps and 33 bps, respectively during H1: 2022-23 (up to September 27, 2022).
| Table IV.2: Financial Markets - Rates and Spread | | Instrument | Interest Rates (per cent) | Spread (bps) (over corresponding risk-free rate) | | Mar 2022 | Sep 2022 | Variation (in bps) | Mar 2022 | Sep 2022 | Variation (in bps) | | 1 | 2 | 3 | (4 = 3-2) | 5 | 6 | (7 = 6-5) | | Corporate Bonds | | | | | | | | (i) AAA (1-yr) | 5.03 | 6.84 | 181 | 28 | 13 | -15 | | (ii) AAA (3-yr) | 5.86 | 7.56 | 170 | 25 | 45 | 20 | | (iii) AAA (5-yr) | 6.43 | 7.50 | 107 | -1 | 22 | 23 | | (iv) AA (3-yr) | 6.57 | 8.31 | 174 | 96 | 120 | 24 | | (v) BBB-minus (3-yr) | 10.24 | 11.97 | 173 | 463 | 486 | 23 | Note: Yields and spreads are computed as monthly averages. Data up to September 27, 2022.
Source: FIMMDA. | The issuances of corporate bonds in the primary market increased to ₹1.94 lakh crore during H1 (up to August 2022) from ₹1.81 lakh crore during the corresponding period of 2021-22 (Chart IV.12a), compensating for the lack of overseas issuances as against ₹55,152 crore raised abroad in H1:2021-22. Nearly the entire resource mobilisation in the corporate bond market (98.4 per cent) was through the private placement route. Outstanding investments by FPIs in corporate bonds declined to ₹1.16 lakh crore on September 27, 2022 from ₹1.21 lakh crore at end-March, pulling down the utilisation of the approved limits from 19.9 per cent to 18.3 per cent. The daily average secondary market trading volume during Q1 at ₹6,054 crore was 20 per cent below its level in the corresponding period of the previous year (Chart IV.12b). IV.1.4 Equity Market Domestic equity market registered minor losses in H1: 2022-23, exhibiting greater resilience than most of its global peers (Chart IV.13a). The benchmark indices bounced off their multi-month lows registered in June 2022 as the correction in commodity prices, good progress of the monsoon, healthy corporate earnings results and return of FPI flows restored investors’ confidence. However, the US Fed's 75 bps policy rate hike in September 2022 along with its hawkish stance led to a global sell-off in equity markets. Overall, the BSE Sensex declined by 2.5 per cent in H1:2022-23 (up to September 27, 2022) to close at 57,108. Indian equities account for 3.5 per cent of total world market capitalisation, the fifth largest in the world (Chart IV.13b). The India VIX – which captures the short-term expected volatility of Nifty 50 – fell from its 20-month high of 32.0 on February 24, 2022 to 21.6 on September 27, 2022 (Chart IV.13c). 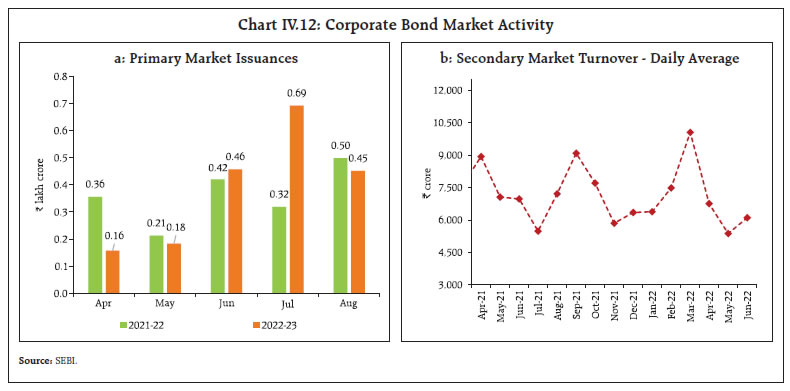
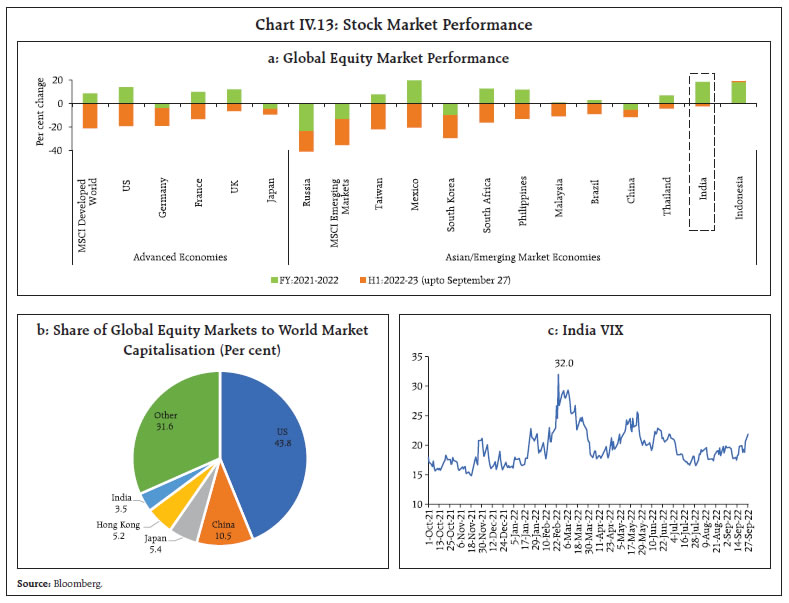 EMEs as an asset class experienced selling pressures from FPIs in 2022 amidst heightened geopolitical tensions and rapid monetary policy normalisation by global central banks (Chart IV.14a). In India, equity markets witnessed sell-offs for nine consecutive months (October 2021-June 2022), the longest selling streak since 2000. Foreign investors, however, returned to the domestic equity market in July, attracted by the improvement in corporate earnings and strong macro fundamentals. Domestic institutional investors (DIIs) made heavy purchases in the equity market for 17 consecutive months (March 2021-July 2022), absorbing FPI sell-off pressures and enabling the market to outperform global and other emerging market peers. Overall, FPIs were net sellers to the tune of ₹58,438 crore, while DIIs were net buyers to the tune of ₹1.3 lakh crore in H1:2022- 23 (Chart IV.14b). Moreover, activity in the domestic primary market remained subdued in H1:2022-23 (barring the mega LIC IPO) due to volatile conditions (Chart IV.14c). 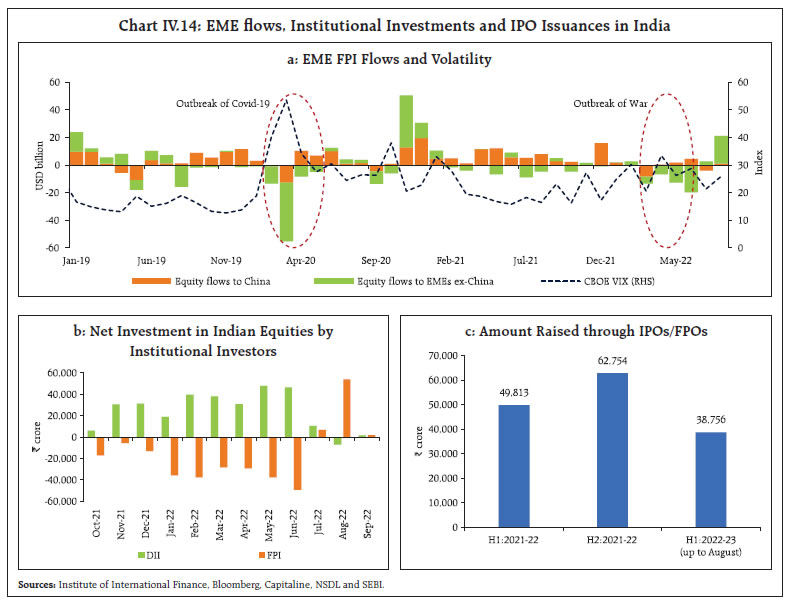 IV.1.5. Foreign Exchange Market The Indian rupee (INR) traded with a depreciating bias against the US dollar (USD) in H1:2022-23 (Chart IV.15a). Reflecting the global factors, the INR volatility – measured by the 1-month at the money (ATM) option implied volatility6 – rose to an average of 5.25 per cent during H1 (up to September 27) from 4.8 per cent during H2:2021-22 (Chart IV.15b). Market interventions by the RBI contained volatility and ensured orderly movement of the INR. The Reserve Bank announced several measures on July 6, 2022 to enhance capital inflows with the objective of ensuring overall macroeconomic and financial stability.7 During 2022-23 (up to September 27), the US dollar appreciated by 16.1 per cent against a basket of major currencies while the INR depreciated by a lower order of 6.8 per cent against the US dollar (Chart IV.16), faring better than many AEs and EME peers. The INR’s relatively better performance is attributed to stronger macroeconomic fundamentals and buffers – India’s inflation is lower than the weighted average of its major trading partners8. Despite a drawdown, India’s foreign exchange reserves at US$ 537.5 billion (as on September 23) are the fifth largest globally9 which, in conjunction with net forward purchases, provide insulation from external shocks and resilience.
In terms of the 40-currency nominal effective exchange rate (NEER), the INR appreciated by 0.2 per cent between March 2022 and September 23, 2022 (Table IV.3). It also appreciated by 1.1 per cent in terms of the 40-currency real effective exchange rate (REER) during this period. Forward premia declined during H1 reflecting narrowing interest rate differentials on the back of a faster than expected tightening by the US Fed. The one-month forward premium averaged 3.36 per cent during H1 (up to September 27) down from 3.93 per cent during H2:2021-22 (Chart IV.17). IV.1.6 Credit Market During H1:2022-23, bank credit10 growth accelerated in tandem with improving economic activity. Growth in non-food bank credit increased to 16.7 per cent (y-o-y) as on September 9, 2022 from 9.7 per cent as at end-March 2022 (Chart IV.18).
| Table IV.3: Nominal and Real Effective Exchange Rate Indices (Trade-weighted) (Base: 2015-16 = 100) | | Item | Index: September 23, 2022 (P) | Appreciation (+) / Depreciation (-) (Per cent) | | September 23, 2022 over March (average) 2022 | | 40-currency REER | 104.6 | 1.1 | | 40-currency NEER | 92.9 | 0.2 | | 6-currency REER | 104.7 | 3.7 | | 6-currency NEER | 88.0 | 1.8 | | ₹/US$* | 81.37 | -6.3 | *: As on September 27, 2022.
P: Provisional.
Sources: RBI; and FBIL. | Although credit growth (y-o-y) picked up for both public sector banks (PSBs) and private sector banks (PVBs) in H1:2022-23, it remained higher for PVBs (20.4 per cent vis-à-vis 13.9 per cent for PSBs) (Chart IV.19a). The share of PSBs in total incremental credit extended by all scheduled commercial banks (SCBs) on a y-o-y basis, however, was higher than that of PVBs (Chart IV.19b).
The improvement in bank credit was seen across all major sectors11 (Chart IV.20). Credit to the agriculture sector grew by 13.4 per cent (y-o-y) in August 2022 (13.0 per cent a year ago), supported by the above-normal monsoon and the enhanced target for agricultural credit12. Credit growth to industry recovered to 11.4 cent in August from 1.5 per cent a year ago, led by large industry and sustained growth in the micro, small and medium enterprises (MSME) segment. Credit to large industries expanded by 6.4 per cent in August, after remaining in contraction zone for a substantial period, due to higher working capital requirements and industrial activity. The extension of the Emergency Credit Line Guarantee Scheme (ECGLS) helped push up credit growth in respect of micro and small industries to 28.2 per cent in August 2022 from 12.1 per cent a year ago, with incremental credit (y-o-y) flows to MSMEs exceeding that to large industry (Chart IV.21a and b). Among the major industries, credit growth to the infrastructure sector (accounting for 38.0 per cent of outstanding industrial credit) accelerated to 11.0 per cent in August 2022 from 3.3 per cent a year ago. Credit growth to infrastructure was driven by the power sector, reflecting strong growth in electricity generation (Chart IV.21c and d). 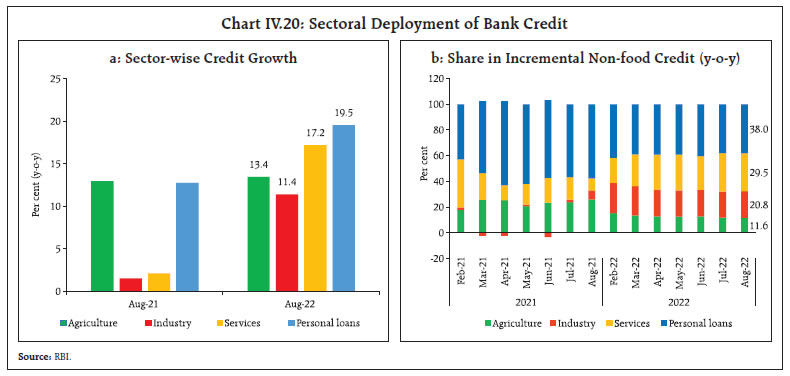 After witnessing a slide during the COVID-19 pandemic, services sector credit offtake gained traction in H1:2022-23, led by disbursements to NBFCs (which registered 27.8 per cent growth in August 2022 as against contraction of 1.0 per cent a year ago). Credit growth in contact intensive sectors such as tourism, hotels and restaurants remained broadly stable (Chart IV.22). Retail loans remained the major driver of overall credit growth. Within retail loans, growth in housing loans was sturdy (16.4 per cent in August 2022 as compared with 11.6 per cent a year ago) while vehicle loans strengthened (19.5 per cent in August 2022 vis-à-vis 11.1 per cent a year ago). Credit card loans bounced back in H1:2022-23 with the ebbing of new COVID-19 infections and the rebound in consumer demand (Chart IV.23).
The asset quality of SCBs improved, with the overall non-performing assets (NPA) ratio declining to 5.6 per cent in June 2022 from 7.5 per cent a year ago (Chart IV.24a). Asset quality improved across all the major sectors (Chart IV.24b). Banks’ non-SLR investments – covering instruments like CPs, bonds, debentures and shares of public and private corporates – were lower during H1:2022-23, mainly due to a decline in investment in bonds/debentures (Chart IV.25a). Adjusted non-food credit13 growth at 14.9 per cent as on September 9 (y-o-y basis) was higher than 9.1 per cent as at end-March 2022 (Chart IV.25b).
Reflecting the improvement in credit offtake, excess holdings of statutory liquidity ratio (SLR) securities of SCBs moderated to 8.8 per cent of their net demand and time liabilities (NDTL) as on August 26, 2022 from 10.4 per cent at end-March 2022 (Chart IV.26). Excess SLR holdings provide collateral buffers to banks for availing funds under the LAF and are also a component of the liquidity coverage ratio (LCR). 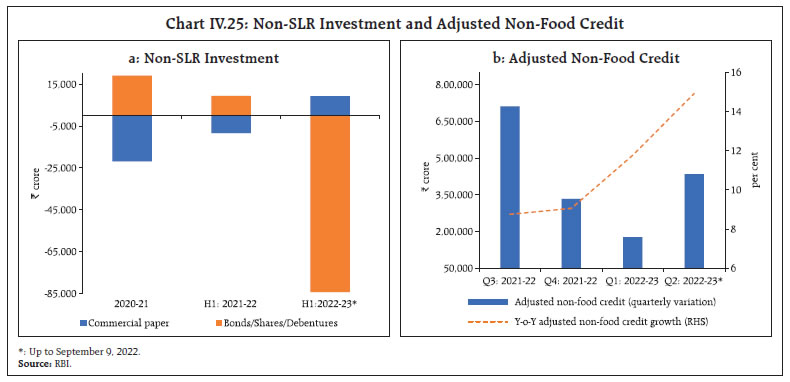
| Table IV.4: Transmission from the Repo Rate to Banks’ Deposit and Lending Rates | | (Variation in basis points) | | Period | Repo Rate | Term Deposit Rates | Lending Rates | | WADTDR (Fresh Deposits) | WADTDR (Outstanding Deposits) | EBLR | 1 - Year MCLR (Median) | WALR (Fresh Rupee Loans) | WALR (Outstanding Rupee Loans) | | Retail Deposits | Retail and Bulk Deposits | Retail and Bulk Deposits | | February 2019 to March 2022 | -250 | -209 | -259 | -188 | - | -155 | -232 | -150 | | April to August/September 2022* | +140 | 39 | 91 | 26 | 140 | 70 | 70 | 39 | | Of which | | | | | | | | | | April 2022 | 0 | 0 | -9 | 0 | 0 | 0 | -12 | -2 | | May to August/September 2022* | +140 | 39 | 100 | 26 | 140 | 66 | 82 | 41 | Note: WALR: Weighted average lending rate; WADTDR: Weighted average domestic term deposit rate; EBLR: External benchmark-based lending rate; MCLR: Marginal cost of funds-based lending rate.
Data on EBLR pertain to 31 domestic banks.
*: Latest data on WALRs and WADTDRs pertain to August 2022.
Source: RBI. |
IV.2 Monetary Policy Transmission Banks’ deposit and lending rates moved higher in H1:2022-23 in tandem with increases in the policy repo rate beginning May 2022. The weighted average lending rate (WALR) on fresh rupee loans sanctioned during May-August 2022 increased by 82 bps while that on outstanding rupee loans increased by 41 bps, reversing in part the sizeable moderation in these rates recorded during the easing phase (February 2019-March 2022) of monetary policy (Table IV.4). The mandated external benchmark regime introduced in October 2019 for loan pricing in select sectors has strengthened the interest rate channel of monetary transmission. The proportion of outstanding floating rate loans linked to external benchmarks has increased from 9.1 per cent in March 2020 to 46.9 per cent in June 2022. Concurrently, the share of marginal cost of funds-based lending rate (MCLR) linked loans has come down to 46.5 per cent in June 2022 (Table IV.5). The bulk of external benchmark-based lending rate (EBLR) loans (80 per cent of total in June 2022) are linked to the policy repo rate. Accordingly, banks raised their EBLRs for fresh loans by 140 bps during May-September 2022. The 1-year median MCLR of SCBs – which is an internal benchmark – rose by 70 bps in H1, in line with pressures on their cost of deposits and other funding sources. The increase in the share of EBLR-linked loans, the shorter reset periods of such loans and upward adjustment in MCLRs have increased the pace of transmission to WALR on outstanding loans (Chart IV.27). | Table IV.5: Outstanding Floating Rate Rupee Loans of SCBs across Interest Rate Benchmarks | | (Per cent to total) | | | March 2020 | March 2021 | March 2022 | June 2022 | | Base rate regime | 10.3 | 6.4 | 4.9 | 4.3 | | MCLR regime | 78.3 | 62.3 | 48.6 | 46.5 | | External benchmark regime | 9.1 | 29.5 | 44.0 | 46.9 | | Others | 2.3 | 1.8 | 2.5 | 2.3 | Note: Data pertain to 74 scheduled commercial banks.
Source: RBI. | Across domestic banks, the increase in the WALRs on fresh rupee loans for PSBs exceeded that of PVBs during May-August 2022, partly reflecting the higher share of floating rate loans in the case of the former. During the easing phase also, the pass-through to lending rates of PSBs had exceeded that of PVBs (Chart IV.28 a and b). The lending rates of PSBs remain lower than that of PVBs (Chart IV.28c). The transmission to lending and deposit rates was the maximum in the case of foreign banks, reflecting a higher share of low cost and lower duration wholesale deposits in their total liabilities.
The WALRs on both fresh as well as outstanding rupee loans increased across all the sectors during May- August 2022 (Chart IV.29). The spreads charged by domestic banks over the policy repo rate (in the case of floating rate fresh rupee loans where the repo rate is the external benchmark) moderated in case of MSME, housing and education loans in H1:2022-23 (Table IV.6). | Table IV.6: Loans linked to External Benchmark – Spread of WALR (Fresh Loans) over the Repo Rate | | (Per cent) | | Sectors | March 2022 | August 2022 | | Public sector banks | Private banks | Domestic banks | Public sector banks | Private banks | Domestic banks | | MSME loans | 4.32 | 4.12 | 4.23 | 4.14 | 3.53 | 3.76 | | Personal loans | | | | | | | | Housing | 2.85 | 3.47 | 3.15 | 2.66 | 2.43 | 2.52 | | Vehicle | 3.23 | 2.79 | 3.06 | 3.09 | 3.21 | 3.10 | | Education | 4.28 | 5.45 | 4.51 | 4.25 | 4.64 | 4.37 | | Other personal loans | 3.17 | 6.06 | 3.36 | 3.75 | 6.39 | 3.97 | | Source: RBI. | Banks also raised their term deposit rates in H1:2022-23 amidst moderation in systemic liquidity (Chart IV.30a)14. Banks increased their bulk term deposit15 rates more relative to retail deposit rates (Chart IV.30b) - the weighted average domestic term deposit rate (WADTDR) on fresh retail deposits increased by 39 bps during May-August 2022, while the WADTDR on total fresh deposits (both retail and bulk deposits) increased by 100 bps. The median term deposit rate on fresh retail deposits – the prevailing card rates – increased by 26 bps during May-September 2022 (Chart IV.30c). The transmission to WADTDR on outstanding deposits is also picking up albeit gradually, reflecting the preponderance of term deposits contracted at fixed rates (Table IV.4). The weighted average savings deposit rate of SCBs was 3.0 per cent in August 2022, unchanged from April 202216. Interest rates on various small savings instruments (SSIs) – which are fixed on a quarterly basis with a spread of 0-100 bps over and above G-sec yields of comparable maturities – have been revised upwards in the range of 10-30 bps for Q3:2022-23, after remaining unchanged for nine consecutive quarters. With G-sec yields moving higher, the prevailing interest rates on various schemes are 44-77 bps below the formula implied rates for Q3: 2022-23 (Table IV.7). 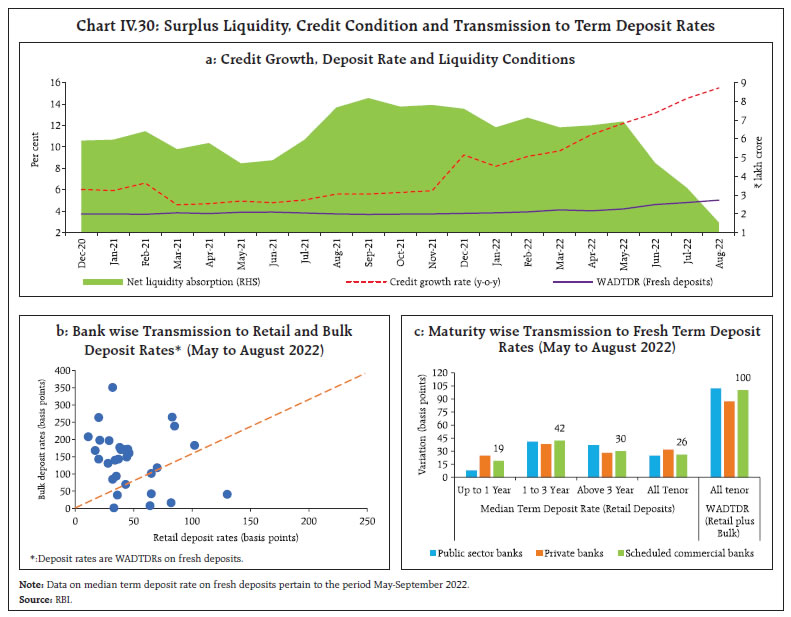
| Table IV.7: Interest Rates on Small Savings Instruments | | Small Savings Scheme | Maturity (years) | Spread (Percentage point) $ | Average G-sec Yield (%) of Corresponding Maturity (Jun 2022 -Aug 2022) | Formula based Rate of Interest (%) (applicable for Q3:2022-23) | Government Announced Rate of Interest (%) for Q3:2022-23 | Difference (basis points) | | (1) | (2) | (3) | (4) | (5) = (3) + (4) | (6) | (7) = (6) - (5) | | Savings Deposit | - | - | - | - | 4.00 | - | | Public Provident Fund | 15 | 0.25 | 7.47 | 7.72 | 7.10 | -62 | | Term Deposits | | | | | | | | 1 Year | 1 | 0 | 6.09 | 6.09 | 5.50 | -59 | | 2 Year | 2 | 0 | 6.33 | 6.33 | 5.70 | -63 | | 3 Year | 3 | 0 | 6.57 | 6.57 | 5.80 | -77 | | 5 Year | 5 | 0.25 | 7.04 | 7.29 | 6.70 | -59 | | Recurring Deposit Account | 5 | 0 | 6.57 | 6.57 | 5.80 | -77 | | Monthly Income Scheme | 5 | 0.25 | 7.00 | 7.25 | 6.70 | -55 | | Kisan Vikas Patra | 123 Months# | 0 | 7.47 | 7.47 | 7.00 | -47 | | NSC VIII issue | 5 | 0.25 | 7.23 | 7.48 | 6.80 | -68 | | Senior Citizens Saving Scheme | 5 | 1.00 | 7.04 | 8.04 | 7.60 | -44 | | Sukanya Samriddhi Account Scheme | 21 | 0.75 | 7.47 | 8.22 | 7.60 | -62 | $: Spreads for fixing small saving rates as per Government of India Press Release of February 2016.
#: Current maturity is 123 months.
Note: Compounding frequency varies across instruments.
Sources: Government of India; FBIL; and RBI staff estimates. | IV.3 Liquidity Conditions and the Operating Procedure The Reserve Bank of India (RBI) Act, 1934 requires the RBI to place the operating procedure relating to the implementation of monetary policy and changes thereto from time to time, if any, in the public domain. In April 2022, significant changes in the operating procedure were instituted through the introduction of the SDF at 3.75 per cent – 25 bps below the policy repo rate (then prevailing at 4.00 per cent) and 40 bps above the FRRR – as the floor of the LAF corridor, replacing the FRRR. The SDF rate is applicable on uncollateralised overnight deposits. By removing the binding collateral constraint on the central bank, the SDF strengthens the operating framework of monetary policy. Moreover, it is also a financial stability tool in addition to its role in liquidity management. The MSF rate was retained at 25 bps above the policy repo rate; thus, the width of the LAF corridor was restored to its pre-pandemic level of 50 bps and became symmetrical around the policy repo rate again. The FRRR was retained at 3.35 per cent. Akin to the MSF, access to the SDF is at the discretion of banks, unlike repo/reverse repo, open market operation (OMO) and cash reserve ratio (CRR) which are at the discretion of the RBI. In H1:2022-23, the focus of liquidity management moved to gradual, calibrated withdrawal of surplus liquidity in a non-disruptive manner. This was in sync with the shift in the focus of monetary policy from remaining accommodative during 2021-22 to withdrawal of accommodation to contain inflationary pressures and anchor inflation expectations. The MPC raised the policy repo rate by 140 bps during May- August 2022. With the institution of the SDF at 40 bps above the FRRR in April, the cumulative increase in the effective interest rate was 180 bps. Furthermore, the CRR was increased by 50 bps to 4.50 per cent (effective fortnight beginning May 21, 2022), withdrawing primary liquidity from the banking system. Drivers and Management of Liquidity Surplus liquidity moderated in H1:2022-23, driven by the public’s currency demand, net forex outflows and the build-up in government’s cash balances. The drainage of liquidity due to expansion in currency in circulation (CiC) in H1 was lower than a year ago, partly reflecting the growing use of digital payments (Chart IV.31). The build-up of government cash balances also contributed to the leakage of liquidity from the banking system. The drawdown by banks of their excess reserves partially ameliorated liquidity pressures (Table IV.8). In terms of management of liquidity by the RBI, OMO sales and the increase in CRR by 50 bps sucked out liquidity from the banking system in H1. The consequent moderation in surplus liquidity was reflected in lower absorptions under the LAF –the average daily liquidity absorption under the LAF fell from ₹7.8 lakh crore in April to ₹2.1 lakh crore in September (up to September 27). Due to transient liquidity pressures on account of GST payments, the borrowing under the MSF window rose to ₹59,312 crore (outstanding amount) on July 25, 2022, – the highest since April 1, 2019 (₹94,263 crore). Advance tax outflows and GST payments temporarily moderated surplus liquidity in the third week of September. The RBI conducted variable rate repo (VRR) auctions of ₹50,000 crore each of 3 days and overnight maturity on July 26 and September 22, 2022, respectively. The RBI remains vigilant on the liquidity front and would conduct two-way fine-tuning operations as necessary – both variable rate repo (VRR) and variable rate reverse repo (VRRR) operations of different tenors – depending on the evolving liquidity and financial conditions. 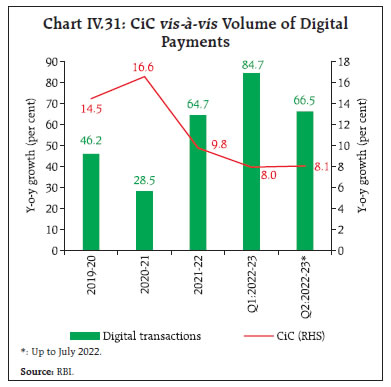
| Table IV.8: Liquidity – Key Drivers and Management | | (₹ crore) | | | 2021-22 | 2022-23 | | Q1 | Q2 | H1 | Q1 | Q2* | | Drivers | | (i) CiC [withdrawal (-) /return (+)] | -1,26,266 | 54,921 | -71,344 | -83,887 | 50,530 | | (ii) Net Forex Purchases (+)/ Sales (-) | 1,60,843 | 1,42,395 | 3,03,238 | 16,159 | -1,68,975# | | (iii) GoI Cash Balances [build-up (-) / drawdown (+)] | -2,23,740 | -5,600 | -2,29,340 | -3,73,117 | 67,863# | | (iv) Excess Reserves [build-up (-) / drawdown (+)] | 1,17,219 | -9,884 | 1,07,335 | 1,50,165 | -48,559# | | Management | | (i) Net OMO Purchases (+)/ Sales (-) | 1,38,965 | 97,960 | 2,36,925 | -6,620 | -14,460 | | (ii) Required Reserves [including both change in NDTL and CRR] | -87,827 | -6,586 | -94,463 | -1,03,054 | -10,463 | | Memo Item | | Outstanding Net LAF as at the end of period | 4,71,970 | 7,58,132 | 7,58,132 | 2,44,891 | 26,152^ | *: Data are up to September 23, 2022; #: Data are up to July 29, 2022; ^: Data as on September 27, 2022.
Note: (+) / (-) sign suggests accretion/depletion in banking system liquidity.
Data on drivers and management pertain to the last Friday of the respective periods.
Source: RBI. | Since its inception on April 8, 2022, the monthly average absorption under the SDF has been in the range of ₹1.2-2.7 lakh crore during H1:2022-23 (up to September 27) while the remaining amount was absorbed through variable rate reverse repo auctions (both main and fine-tuning operations) (Chart IV.32). In view of the moderation in surplus liquidity, banks appetite to park funds with the Reserve Bank for longer maturities waned. Consequently, the amount absorbed through the variable rate reverse repo auctions declined to 40 per cent of the total absorption in September 2022 (up to September 27) from around 74 per cent in March 2022. The effective absorption rate17 at 5.25 per cent in September 2022 (up to September 27) was higher than the SDF rate of 5.15 per cent. IV.4 Conclusion Domestic financial markets have adjusted smoothly to the shift in monetary policy’s focus on withdrawal of accommodation, policy rate hikes and the moderation in surplus liquidity, while exhibiting resilience to global financial market headwinds and policy spillovers from AEs. Market rates have moved higher across the maturity spectrum albeit at varying degrees across market segments and instruments. Bank credit offtake has improved in line with economic activity, even as lending and deposit rates have started moving higher. The foreign exchange market has been characterised by an orderly adjustment of the INR, with a depreciating bias due to the generalised strength of the US dollar. Going forward, the RBI will remain vigilant, agile and nimble in its liquidity management operations and would use all instruments at its disposal to mitigate the spillovers of global financial market volatility on domestic financial markets. __________________________________________________________________________________
V. External Environment The global outlook has worsened under the combined impact of the protracted conflict in Ukraine, and aggressive and synchronised monetary tightening. These developments are imparting sizeable volatility to global financial markets and large adverse spillovers to emerging market economies. Supply chain disturbances, the energy and food crises and tightening financial conditions are exacerbating risks of a global recession. The global outlook has worsened since the April 2022 MPR under the combined impact of the protracted war, and aggressive and synchronised monetary tightening to rein in multi-decadal highs in inflation. Sovereign bond yields have hardened while equity markets have corrected in response to monetary policy actions. Geopolitical tensions, the faster pace of monetary tightening by the US Fed, and the safe haven demand have led the US dollar to rally to 20-year highs, imposing depreciation pressures on the currencies of major emerging market economies (EMEs) in an environment of large portfolio outflows. Lingering supply chain disturbances, the energy and food crises and tightening financial conditions are exacerbating risks of a global recession. V.1 Global Economic Conditions Global growth lost momentum in Q2:2022. High frequency indicators point to a further slowdown in Q3. The US economy contracted in H1:2022 [(-) 1.6 per cent and (-) 0.6 per cent in Q1 and Q2, respectively, in terms of quarter-on-quarter (q-o-q) seasonally adjusted annualised rates (saar)], dragged down by inventories and residential fixed investment (Table V.1). In contrast, the US labour market remains robust, with sustained payroll gains and a low unemployment rate. Nominal wage growth has been strong, albeit with signs of levelling off. The US composite Purchasing Managers’ Index (PMI)1 at 44.6 in August remained in contraction territory for the second consecutive month, with declines in both manufacturing and services output. The Euro area’s GDP grew by 3.1 per cent (q-o-q saar) in Q2:2022, its fastest pace in three quarters, boosted by the easing of COVID-19 restrictions and a resurgence in tourism. High frequency indicators for Q3, however, suggest slowdown in momentum due to growing uncertainty surrounding future gas supplies and the rising costs of living. The composite PMI for the Euro zone registered its second consecutive contraction in August 2022 at 48.9, with downturns in both manufacturing and services. The outlook is overcast by the war and perniciously high inflation, with expectations of tighter financial conditions going forward. In the UK, GDP contracted by 0.3 per cent in Q2:2022 (q-o-q saar) due to a fall in government and consumer spending, deceleration in production output and contraction in services constrained by labour shortages. The labour market remains tight with some early signs of weakening in labour demand. The composite PMI plummeted to 49.6 in August 2022, the first contraction in 18 months, driven by severe downturn in manufacturing output and slowdown in services business activity. The Bank of England (BoE) forecasts a decline in GDP in Q3:2022 till the end of 2023 under the adverse impact of the sharp rise in global energy and goods prices on UK households’ real disposable incomes. Japan’s GDP grew by 3.5 per cent (q-o-q saar) in Q2:2022 following a near stagnation in Q1 as private consumption accelerated with the lifting of COVID-19 curbs, and government spending rose for the second straight quarter. The employment and income situation improved moderately on the whole, buoyed by accommodative monetary policy. The composite PMI (au Jibun Bank) dropped sharply to 49.4 in August 2022, the first contraction since February, with both manufacturing and services companies recording a decline in output. The Bank of Japan (BoJ) expects growth to be under pressure stemming from elevated commodity prices though the economy is projected to continue growing at a pace above its potential growth rate. Amongst EMEs, China's GDP growth decelerated sharply to 0.4 per cent (y-o-y) in Q2:2022 from 4.8 per cent in Q1, marking the second-worst quarterly growth in 30 years (Table V.1). On q-o-q (annualised) basis, the economy contracted by 10 per cent in Q2:2022 as COVID-related lockdowns curbed economic activity amidst a steep downturn in the real estate sector and an energy crunch. H1:2022 growth at 2.6 per cent (y-o-y) was below the 5.5 per cent annual growth target for 2022. The composite PMI (Caixin) was at 53.0 in August, driven by an expansion in services activity, offset by a marked slowdown in manufacturing growth. Looking ahead, the zero-COVID policy, strained power supply and the liquidity crisis in the real estate sector are likely to weigh on economic activity. Amongst other major EMEs, Brazil’s GDP growth rate accelerated to 3.2 per cent (y-o-y) in Q2:2022 from 1.7 per cent in Q1, supported by private and government spending, and investment. The unemployment rate fell to a multi-year low in June. The composite PMI eased to 53.2 in August, with notable slowdown evident in both the manufacturing and service sectors. Going forward, tight monetary conditions, high inflation and war-related uncertainty remain key risks to the growth outlook. South Africa’s GDP growth decelerated sharply to 0.2 per cent (y-o-y) in Q2 driven by the devastating floods in the KwaZulu-Natal region and power rationing hampering industrial activity. The composite PMI edged lower to 51.7 in August of 2022 from a 14-month high of 52.7 in July. Looking ahead, COVID-19 infections risk due to low vaccination levels, weak employment outlook and continued disruptions to power supply could weigh on economic activity. The Russian economy contracted by 4.1 per cent (y-o-y) in Q2:2022 due to the fallout from the conflict with Ukraine and the impact of international sanctions. Consumer activity remains subdued, but it is beginning to recover, while investment is facing the brunt of sanctions and capital outflows. Soaring energy prices have helped the external sector hold up relatively well. The economy is expected to contract in both 2022 and 2023 due to the war and sanctions (Table V.2). | Table V.1: Real GDP Growth | | (Per cent) | | Country | Q3-2021 | Q4-2021 | Q1-2022 | Q2-2022 | 2021 | 2022 (P) | 2023 (P) | | Quarter-on-quarter, seasonally adjusted annualised rate (q-o-q, saar) | | Canada | 5.3 | 6.6 | 3.1 | 3.3 | | | | | Euro area | 9.0 | 2.0 | 2.7 | 3.1 | | | | | Japan | -1.8 | 3.9 | 0.2 | 3.5 | | | | | South Korea | 0.9 | 5.5 | 2.6 | 3.0 | | | | | UK | 3.8 | 5.2 | 3.1 | -0.3 | | | | | US | 2.7 | 7.0 | -1.6 | -0.6 | | | | | Year-on-year | | | | | | | | | Advanced Economies | | | | | | | | | Canada | 3.8 | 3.2 | 2.9 | 4.6 | 4.5 | 3.4 | 1.8 | | Euro area | 3.7 | 4.6 | 5.4 | 4.1 | 5.4 | 2.6 | 1.2 | | Japan | 1.2 | 0.5 | 0.6 | 1.6 | 1.7 | 1.7 | 1.7 | | South Korea | 4.1 | 4.4 | 3.0 | 2.9 | 4.1 | 2.3 | 2.1 | | UK | 6.9 | 6.6 | 8.7 | 2.9 | 7.4 | 3.2 | 0.5 | | US | 5.0 | 5.7 | 3.7 | 1.8 | 5.7 | 2.3 | 1.0 | | Emerging Market Economies | | | | | | | | | Brazil | 4.0 | 1.7 | 1.7 | 3.2 | 4.6 | 1.7 | 1.1 | | China | 4.9 | 4.0 | 4.8 | 0.4 | 8.1 | 3.3 | 4.6 | | India | 8.4 | 5.4 | 4.1 | 13.5 | 8.7 | 7.4 | 6.1 | | Indonesia | 3.5 | 5.0 | 5.0 | 5.4 | 3.7 | 5.3 | 5.2 | | Philippines | 7.0 | 7.8 | 8.2 | 7.4 | 5.7 | 6.7 | 5.0 | | Russia | 4.0 | 5.0 | 3.5 | -4.1 | 4.7 | -6.0 | -3.5 | | South Africa | 3.0 | 1.7 | 2.7 | 0.2 | 4.9 | 2.3 | 1.4 | | Thailand | -0.2 | 1.8 | 2.3 | 2.5 | 1.5 | 2.8 | 4.0 | | Memo: | | | | | | | | | World | | 2021 | | | 2022 (P) | | 2023 (P) | | Year-on-year | | | | | | | | | Output | | 6.1 | | | 3.2 | | 2.9 | | Trade Volume | | 10.1 | | | 4.1 | | 3.2 | P: Projection.
Note: India's data correspond to fiscal year (April-March); e.g., 2021 pertains to April 2021-March 2022.
Sources: Official statistical agencies; Bloomberg; IMF WEO Update, July 2022; and RBI staff estimates. |
| Table V.2: Select Macroeconomic Indicators for BRICS2 Economies | | Real GDP Growth Rate (Y-o-Y Per cent) | Country | 2021 | 2022(P) | 2023(P) | General Govt. Gross Debt (Per cent of GDP) | Country | 2021 | 2022(P) | 2023(P) | | Brazil | 4.6 | 1.7 | 1.1 | Brazil# | 93.0 | 91.9 | 92.8 | | Russia | 4.7 | -6.0 | -3.5 | Russia | 17.0 | 16.8 | 18.9 | | India | 8.7 | 7.4 | 6.1 | India | 86.8 | 86.9 | 86.6 | | China | 8.1 | 3.3 | 4.6 | China | 73.3 | 77.8 | 81.8 | | South Africa | 4.9 | 2.3 | 1.4 | South Africa | 69.1 | 70.2 | 73.4 | | CPI Inflation Rate (Per cent) | Country | 2021 | 2022(P) | 2023(P) | Current account balance (Per cent of GDP) | Country | 2021 | 2022(P) | 2023(P) | | Brazil | 8.3 | 8.2 | 5.1 | Brazil | -1.7 | -1.5 | -1.6 | | Russia | 6.7 | 21.3 | 14.3 | Russia | 6.9 | 12.4 | 8.1 | | India | 5.5 | 6.1 | 4.8 | India | -1.2 | -2.9 | -2.5 | | China | 0.9 | 2.1 | 1.8 | China | 1.8 | 1.1 | 1.0 | | South Africa | 4.5 | 5.7 | 4.6 | South Africa | 3.7 | 1.3 | -1.0 | | General Govt. Net Lending/Borrowing (Per cent of GDP) | Country | 2021 | 2022(P) | 2023(P) | Forex Reserves* (in US$ billion) | Country | 2020 | 2021 | 2022 | | Brazil | -4.4 | -7.6 | -7.4 | Brazil | 355.6 | 362.2 | 339.7 | | Russia | 0.7 | -4.0 | -5.3 | Russia | 596.1 | 630.6 | 565.7 | | India | -10.4 | -9.9 | -9.1 | India | 588.4 | 635.3 | 545.7 | | China | -6.0 | -7.7 | -7.1 | China | 3536.0 | 3606.2 | 3454.4 | | South Africa | -6.4 | -5.8 | -6.1 | South Africa | 54.2 | 57.8 | 59.6 | P: Projection.
*: Forex reserves for 2022 pertains to August 2022 except China (July 2022), South Africa (July 2022) and India (September 16, 2022).
#: Gross debt refers to the nonfinancial public sector, excluding Eletrobras and Petrobras, and includes sovereign debt held by the central bank.
Note: India's data correspond to fiscal year (April-March).
Sources: Official statistical agencies; WEO April 2022 database and July 2022 Update, IMF; Fiscal Monitor Update, April 2022, IMF; and International Reserve and Foreign Currency Liquidity (IRFCL), IMF. | Growth in the ASEAN3 economies decelerated in Q2:2022 as the war dampened demand. The manufacturing PMI for these economies in August signalled improvement in business conditions as output and new orders expanded and employment and purchasing activity increased. The slowdown in China is a major source of risk to the region due to spillovers from supply disruptions and weaker exports. Amongst high frequency indicators, the OECD composite leading indicators (CLIs) for August 2022 remained below trend for most economies, indicating a deteriorating outlook due to multi-decadal high inflation, low consumer confidence and declining stock price indices (Chart V.1a). The global composite PMI fell from 50.8 in July to 49.3 in August, indicating a contraction in global output for the first time since June 2020, with fall in both services and manufacturing output (Chart V.1b). The moderation in world trade, which started in the third quarter of 2021, accentuated in H1:2022 owing to the war and slowdown in global growth in a worsening macroeconomic environment (Chart V.2a). Reflecting this, the merchandise trade volume growth slowed from 4.6 per cent in Q1:2022 to 4.3 per cent in Q2:2022; however, it witnessed an uptick in July 2022. The WTO expects trade volume growth to moderate to 3.0 per cent in 2022 from 9.8 per cent in 2021. The Baltic Dry Index, which measures shipping costs for a wide variety of bulk commodities such as coal and iron ore, increased in September 2022 on sequential basis. It was, however, lower by 70.1 per cent from its peak in October 2021, but remained above its pre-COVID level (Chart V.2b). V.2 Commodity Prices and Inflation Global commodity prices have witnessed large swings since February following the war. Commodity prices initially surged by 14.7 per cent (according to the Bloomberg commodity price index) during March-May 2022 as the war started. Since then (June-September 28, 2022), the prices have corrected by 14.2 per cent as slowing global growth dampened demand. Notwithstanding this correction, the Bloomberg commodity price index has gained 13.7 per cent year to date (till September 28) (Chart V.3a). Global food prices, according to the Food and Agriculture Organization (FAO), eased by 13.6 per cent between March’s all-time record high and August 2022, as seasonal production gained and reduction in restrictive trade policies assuaged supply conditions. The index, however, increased by 3.2 per cent in 2022 (up to August) (Chart V.3b). 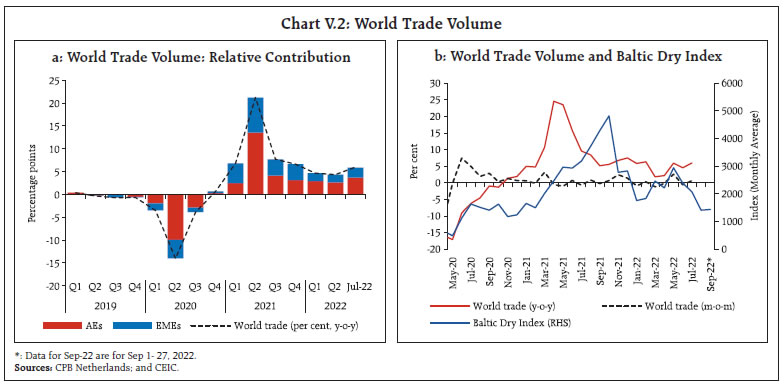 Crude oil prices were highly volatile in H1:2022. They hovered above US$100 per barrel between April and July due to the war and sanctions related uncertainty in an environment of acutely tight supply conditions (Chart V.3c). Amidst extremely low inventories, the Organization of the Petroleum Exporting Countries (OPEC) plus countries continued with calibrated changes in production quotas. OPEC plus decided to increase production by 100,000 barrels per day in August 2022 but in September, it decided to curtail production by a similar magnitude starting October. On the back of slowing global demand, strengthening US dollar and expectations on the availability of Iranians supplies, crude oil prices declined sharply during July-September 2022. Nevertheless, Brent crude prices have gained 15.0 per cent year to date (till September 28). Natural gas prices have jumped significantly since the war; in August 2022, the prices (according to World Bank’s natural gas index) increased by 91.7 per cent in 2022 and remained 249.2 per cent higher on year-on-year basis. 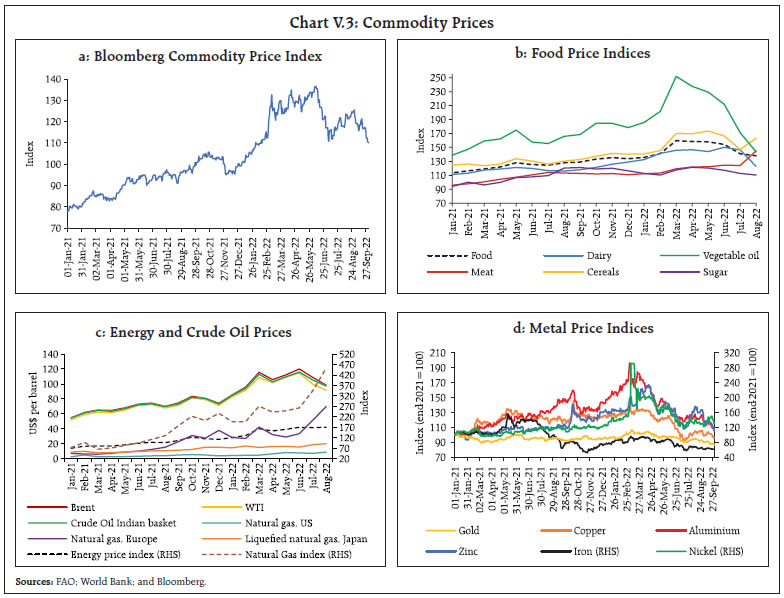 Base metal prices, measured by Bloomberg’s base metal spot index, which rose by 17.1 per cent on the back of the war, softened by 34.8 per cent between April and September 2022 (up to September 28), reflecting a weak global outlook. Gold prices plummeted markedly since April, hitting a low at US$1,618 per troy ounce in September as bond yields hardened and the US dollar traded stronger. For some metals like zinc and aluminium, production cuts amidst high energy prices have lent support to prices in August. In September, however, prices treaded the downward trajectory following other metal prices (Chart V.3d). Consumer Price Inflation Consumer price inflation ratcheted up across economies due to sustained cost push pressures from elevated food and energy prices, rising wage cost and lingering pandemic-induced supply chain bottlenecks as strong rebound in domestic demand in a number of economies added to price pressures. Headline inflation breached inflation targets across AEs and EMEs over the course of 2022 so far (Table V.3). High energy and food prices have been the major drivers of the upsurge in inflation, with goods inflation generally much higher than services, though the latter has also started to gather pace recently. Core inflation is also ruling at elevated levels in many economies due to the interplay of cost-push shocks and demand-pull pressures. In the US, headline CPI inflation reached a 40-year high of 9.1 per cent in June 2022, driven by inflation in energy and food prices. It eased to 8.3 per cent in August due to a fall in gasoline prices. Inflation in terms of the personal consumption expenditure (PCE) price index – the Federal Reserve (Fed)’s preferred measure of inflation – moderated from 6.8 per cent in June to 6.3 per cent in July, driven by decrease in prices of both goods and services. Core PCE inflation eased to 4.6 per cent in July from 5.2 per cent in March (Chart V.4a). | Table V.3: Consumer Price Inflation | | (Per cent) | | Country | Inflation Target | Q3: 2021 | Q4: 2021 | Q1: 2022 | Q2: 2022 | July 2022 | August 2022 | | Advanced Economies | | | | | | | | | Canada | 2.0 | 4.1 | 4.7 | 5.8 | 7.5 | 7.6 | 7.0 | | Euro area | 2.0 | 2.9 | 4.7 | 6.1 | 8.0 | 8.9 | 9.1 | | Japan | 2.0 | -0.2 | 0.5 | 0.9 | 2.5 | 2.6 | 3.0 | | South Korea | 2.0 | 2.5 | 3.6 | 3.8 | 5.4 | 6.3 | 5.7 | | UK | 2.0 | 2.8 | 4.9 | 6.2 | 9.2 | 10.1 | 9.9 | | US | 2.0 | 5.4 | 6.7 | 8.0 | 8.7 | 8.5 | 8.3 | | | | (4.3) | (5.5) | (6.3) | (6.5) | (6.3) | | | Emerging Market Economies | | | | | | | | | Brazil | 3.50 ± 1.5 | 9.6 | 10.5 | 10.7 | 11.9 | 10.1 | 8.7 | | Russia | 4.0 | 6.9 | 8.3 | 11.5 | 16.9 | 15.1 | 14.3 | | India | 4.0 ± 2.0 | 5.1 | 5.0 | 6.3 | 7.3 | 6.7 | 7.0 | | China | | 0.8 | 1.8 | 1.1 | 2.2 | 2.7 | 2.5 | | South Africa | 3.0-6.0 | 4.8 | 5.5 | 5.8 | 6.6 | 7.8 | 7.6 | | Mexico | 3.0 ± 1.0 | 5.8 | 7.0 | 7.3 | 7.8 | 8.2 | 8.7 | | Indonesia | 3.0 ± 1.0 | 1.6 | 1.8 | 2.3 | 3.8 | 4.9 | 4.7 | | Philippines | 3.0 ± 1.0 | 4.1 | 3.6 | 3.3 | 5.5 | 6.4 | 6.3 | | Thailand | 1.0-3.0 | 0.7 | 2.4 | 4.7 | 6.5 | 7.6 | 7.9 | | Turkey | 5.0 | 19.3 | 25.8 | 54.8 | 74.0 | 79.6 | 80.2 | Notes: (1) Inflation for US is in terms of year-on-year change in consumer price index with personal consumption expenditure price index year-on-year change in parentheses.
(2) The Bank of Canada aims to keep inflation at the 2 per cent mid-point of an inflation control target range of 1-3 per cent.
(3) Brazil’s inflation target for 2021 was 3.75 ± 1.5 per cent.
Sources: Central bank websites; and Bloomberg. | In the Euro area, CPI inflation soared to a historic high of 9.1 per cent in August 2022, prevailing well above the European Central Bank (ECB)’s target of 2 per cent since July 2021. The precipitous increase in energy prices, especially of natural gas, along with food prices, remained the major driver of inflation. Non-energy industrial goods, transportation and fertiliser costs have also fuelled price pressures. CPI inflation in the UK rose to 10.1 per cent in July – the highest since availability of data in January 1997 – and well above the BoE’s target of 2 per cent, led by housing and household services, transport and food. It moderated marginally to 9.9 per cent in August as transport sub-index declined. In Japan, CPI inflation in all items less fresh food – the Bank of Japan’s target measure – rose to 2.8 per cent in August, the highest in 7 years. It has breached the 2 per cent target since April 2022. CPI inflation also rose to 3.0 per cent in August 2022 from 2.6 per cent in July, amidst surging fuel and food costs as well as a sharply weakening yen. Like the AEs, inflation in major EMEs remains elevated and well above their respective targets. In Brazil, CPI inflation was 8.7 per cent in August 2022 (Chart V.4b). In Russia, inflation peaked at 17.8 per cent in April from 9.2 per cent in February following sanctions and a sharp depreciation of the rouble. It has since then moderated gradually to 14.3 per cent in August, partly due to currency appreciation. In South Africa, CPI inflation stood at 7.6 per cent in August – exceeding the central bank’s target range since May 2022 – as prices of food and non-alcoholic beverages increased. In China, CPI inflation has remained subdued, although it accelerated during March-July 2022, mainly due to a surge in food prices and a strong recovery in demand. In August, however, it moderated to 2.5 per cent as both food and non-food indices eased. V.3 Monetary Policy Stance With inflation rates at their highest in decades and significantly above targets, central banks in AEs and EMEs resorted to aggressive monetary tightening with larger-than-usual rate hikes in 2022 to contain inflation and anchor inflation expectations even as economic activity is losing momentum. A number of central banks in EMEs were already in a tightening mode in 2021. The synchronised monetary tightening has raised concerns as to whether it will lead to a recession or whether the central banks will be able to achieve a soft landing (Box V.1). After initiating the tightening cycle in March 2022, the US Fed has delivered rate hikes in all its subsequent policy meetings. In May, the US Fed effected a 50 bps increase in the federal funds rate. It followed up with 75 bps hikes in its June, July and September meetings – a cumulative hike of 300 bps in the current tightening phase. It also unveiled plans for quantitative tightening to reduce its balance sheet by US$ 47.5 billion per month during June-August and US$ 95 billion per month from September. According to the Summary of Economic Projections released in September 2022, the median federal funds rate is seen at 4.4 per cent by end–2022 and 4.6 per cent by end-2023. Box V.1: High Inflation and Aggressive Monetary Tightening: Soft or Hard Landing? With inflation rates ruling at their highest since the 1970s and 1980s in major economies and substantially above targets, central banks have stepped up the pace and the quantum of rate hikes to keep inflation expectations anchored and to bring inflation back to targets. This has raised growing concerns that the synchronised monetary tightening could land the global economy into a recession (a hard landing). Central banks hope that they would be able to engineer a soft landing (with only a loss of pace in growth rather than an outright contraction in economic activity) (BIS, 2022; Blinder, 2022). A panel analysis of 8 countries with 23 tightening cycles over the period Q1:1997-Q2:2022 suggests that for both AEs and EMEs, hard landings are preceded by significantly higher average inflation as compared to soft landings4 (Table V.I.1). Low GDP growth in the period prior to the start of tightening increases the probability of a hard landing in AEs. In EMEs, high GDP growth in conjunction with high inflation tilts the scales towards hard landing. For EMEs, elevated fiscal deficits and public debt prior to the start of monetary tightening increase the risk of them ending in recession post the tightening. A formal panel logit regression for the sample of AEs and EMEs indicates that the probability of a hard landing increases if the tightening is preceded by high inflation, high GDP growth and higher increase in credit/GDP ratio; higher real policy rates prior to the start of the tightening episode, on the other hand, appear to reduce the probability of a hard landing by mitigating the build-up of financial excesses (eq. 1). CPI, GDP, RPR and Credit refer to 4-quarter averages of consumer price inflation, real GDP growth, real policy rate and change in credit/GDP ratio, respectively. Figures in parentheses are p-values. Source: RBI staff estimates. At the current juncture, inflation is running high while GDP growth is slowing even as unemployment rates remain low. This macroeconomic mix raises the odds of hard landing. | Table V.I.1: Macroeconomic Factors — Hard and Soft Landings | | | Variables | Advanced Economies | Emerging Market Economies | | Soft landings | Hard landings | Soft landings | Hard landings | | Conditions at the start of the tightening cycle5 | Inflation (%) | 1.5*** | 2.2*** | 4.0** | 4.9** | | GDP growth (%) | 3.3* | 2.5* | 3.1* | 4.4* | | Real policy rate (%) | 3.5*** | 0.0*** | 2.3*** | 4.2*** | | Change in household credit-to-GDP (% pts)6 | 0.7 | 0.5 | -0.7* | 0.1* | | Fiscal deficit-to-GDP (% pts) | -1.6 | -3.1 | -1.5 | -2.2 | | Debt-to-GDP (% pts) | 37.4 | 56.0 | 37.9 | 48.9 | | Conditions during tightening | Real policy rate increase (% pts) | -0.1 | 2.0 | 1.2 | 0.6 | | Average quarterly real rate increase (% pts) | 0.0 | 0.1 | 0.1 | 0.0 | | Tightening duration (quarters) | 6.0 | 10.3 | 5.2 | 6.4 | Note: ***,**,* denote level of significance at 1%, 5% and 10%, respectively, for testing equality of means between hard and soft landings using Student’s t test.
Sources: BIS; Bloomberg; IMF and RBI staff estimates. | References: Bank for International Settlements (2022), BIS Annual Economic Report 2022 (Box 1 C: “How Likely is a Soft Landing?”). Blinder, A., (2022) “On Landings Hard and Soft: The Fed, 1965-2020”, Lecture at Markus’ Academy, February, available at https://bcf.princeton.edu/events/alan-blinder-on-landings-hard-and-soft-the-fed-1965-2020/. | Amidst raging inflationary pressures, the ECB in its June 2022 meeting decided to end net asset purchases under the Asset Purchase Programme (APP) as of July 1, 2022 while continuing to reinvest maturing securities under its Pandemic Emergency Purchase Programme (PEPP) until atleast the end of 2024. The ECB undertook frontloaded rate hikes of 50 bps in July and 75 bps in September in response to soaring inflation. Continuing with the tightening cycle that started in December 2021, the Bank of England (BoE) raised its policy rate in the May and June 2022 meetings by 25 bps each followed by 50 bps in August and September each which took the Bank Rate to 2.25 per cent. Simultaneously, in September, the committee unanimously voted to reduce around £80 billion in its stock of gilts over twelve months7. Alongside the start of the gilt sales programme, the BoE also decided to launch a new Short Term Repo (STR) facility to help ensure that short-term market rates remain close to the Bank Rate. Other major AEs have also started unwinding their pandemic-led stimulus and normalising their monetary conditions. The Bank of Canada has raised its policy rate by 275 bps since April – 50 bps each in April and June, 100 bps in July and 75 bps in September, along with quantitative tightening to maintain price stability. The Reserve Bank of Australia has increased its cash rate target by 225 bps since May – 25 bps in May and by 50 bps each in June, July, August and September. The Norges Bank and the Bank of Korea raised their policy rates by 175 bps and 150 bps, respectively in 2022 while the Central Bank of Iceland and the Czech National Bank effected cumulative hikes of 350 bps and 325 bps, respectively (Chart V.5a). Sveriges Riksbank (Sweden) has increased the policy rate by 175 bps in 2022 so far, including 100 bps hike in September 2022. Amongst the AEs, the Bank of Japan (BoJ) remained an outlier as it maintained an accommodative stance and kept the monetary policy parameters – key policy rates and the quantum of asset purchases – unchanged in 2022 so far. Amongst EMEs, the People’s Bank of China (PBoC) adopted an accommodative monetary policy stance effecting 25 bps and 50 bps cuts in the reserve requirement ratio for most banks and smaller banks, respectively, from April 25, 2022, which injected 530 billion yuan into the economy. It reduced the 1-year Loan Prime Rate (LPR) by 5 bps in August, the 5-year LPR by 15 bps and the 1-year medium-term lending facility loans and 7-day reverse repurchase agreements by 10 bps each. In contrast, most other EME central banks continued with policy tightening. Amongst BRICS, the Banco Central do Brasil followed up on its 100 bps rate hike action of March with a 100 bps rate hike in May and 50 bps rate hikes each in June and August. It, however, paused its tightening cycle in its September meeting. The South African Reserve Bank raised its policy rate by 50 bps in its May meeting and by 75 bps in both its July and September meetings (Chart V.5b). Amongst Asian EMEs, the Bank of Thailand and the Bank Indonesia embarked on a tightening cycle by hiking 25 bps each in August 2022, followed by a hike of 25 bps and 50 bps, respectively, in September. In Latin America, the central banks of Mexico, Chile and Peru continued with monetary tightening. Amongst European EMEs, Hungary has cumulatively increased the policy rate by 860 bps since April, including 200 bps in an off-cycle meeting in July. 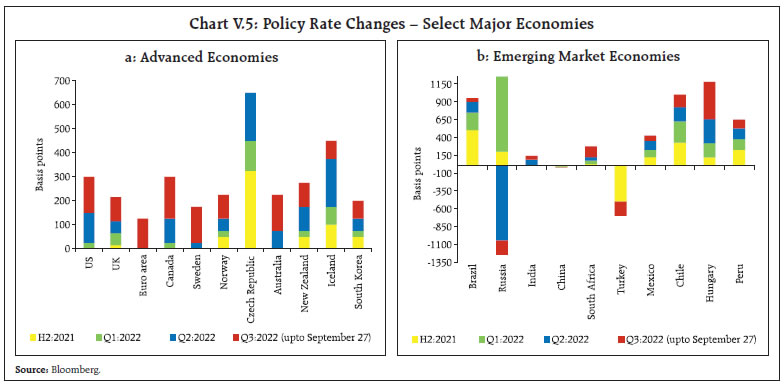 The Bank of Russia switched gears in H1 as price and financial stability risks subsided. It had increased its key rate by 11.5 percentage points in February 2022 in two steps to stem depreciation and inflationary pressures amidst the geopolitical upheaval. As depreciation pressures waned, it cut its policy rate by 12.50 percentage points since April – including by 300 bps each in two off-cycle meetings held in April and May, thus offsetting the rate hikes in February. The central bank of Turkey cut its key policy rate by 100 bps each in August and September meetings, even as inflation skyrocketed to 80.2 per cent in August. Overall, during 2022, central banks’ rate hikes have been quite aggressive by historical standards. In a sample of 31 central banks (13 AEs and 18 EMEs) that raised their policy rates in 2022 (till September 28, 2022), 23 central banks have raised their policy rates by 75 bps or more. Out of these, 8 central banks raised rates by more than 100 bps. V.4 Global Financial Markets Global financial markets remained nervous during April-September as they grappled with protracted geopolitical tensions, the highest inflation rates in decades in many economies, aggressive monetary tightening and global recession concerns. Bond yields have firmed, equity markets have corrected and the US dollar has surged on hawkish Fed statements and safe haven demand while EME currencies broadly weakened. In equity markets, the US S&P index plunged beginning April 2022 as uncertainty regarding the pace of unwinding by the US Fed along with mounting growth concerns rattled investor sentiments. The short-lived rebound in the first half of June was reversed by September on account of the large rate hikes by the Fed. With some dissipation in uncertainty and falling inflation expectations, US equities gradually rebounded in July but shed gains in August and September as the Fed continued with its aggressive rate hikes. Overall, the US S&P index fell by 17.9 per cent between end-March 2022 and September 28, 2022. 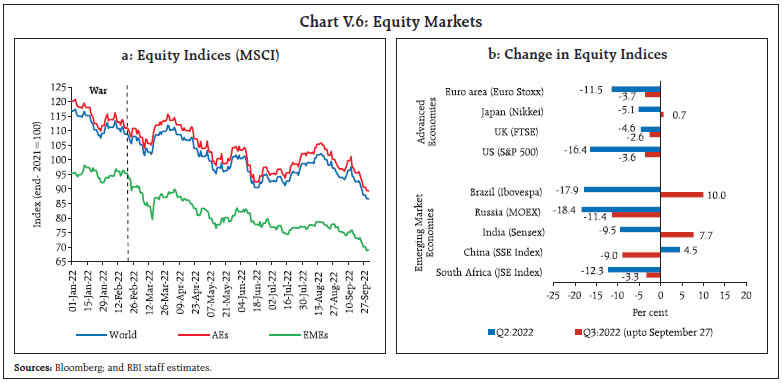 European stock markets broadly mirrored the US markets, inching down in April and May on account of mounting recession fears and worries over surging bond yields. After a short reversal in late-May and early-June, markets have been weighed down by rising inflation fears, soaring energy prices, gloomy business activity data and larger rate hikes by the ECB. The UK stock indices also tracked global cues. The Japanese market outperformed its peers on stable inflation and the continuation of ultra-accommodative monetary policy to support economic recovery. However, it fell to a 3-month low in September 28, 2022. EME stock markets underperformed developed markets in Q2:2022 as growing inflationary pressures, recession fears, and monetary tightening in the major AEs impacted investors’ sentiments (Chart V.6a). In Q3:2022, stock markets, especially for EMEs, posted negative returns with Brazil and India being exceptions. The dash for safe haven led to portfolio outflows and downward pressures on equities (Chart V.6b). Sovereign bond yields across major AEs hardened in Q2 and Q3 over surging inflation and expectations of higher rate hikes. Recession concerns pulled down long-term bond yields in July, but yields edged higher during August-September on expectations of further monetary tightening. In April, the US 10-year treasury yield raced up to a 3-year high as the market priced in more aggressive Fed tightening than previously anticipated. With short-term rates also rising sharply, the yield curve became flatter. As the growth outlook dimmed and recessionary fears rose, the short end of the yield curve hardened while long-term yields softened, causing yield curve inversion in July. The US 10-year yield, however, hardened again in August-September with stronger-than-expected payrolls data, hawkish commentary from the Fed Chair and FOMC members and third consecutive 75 bps rate hike by the Fed (Chart V.7a). The UK and German 10-year bond yields tracked the US markets. The UK 10-year bond yield shot up by 70 bps in the week ending September 28, on account of expansionary fiscal policy involving sweeping tax cuts. Differing from peers, Japanese bond yields were range bound, given the continued accommodative monetary policy stance. However, the 10-year yields hit the upper limit of the BoJ’s implicit band around its 0 per cent target in September on account of sharp rise in inflation and capital outflows, prompting BoJ to buy more bonds than planned. 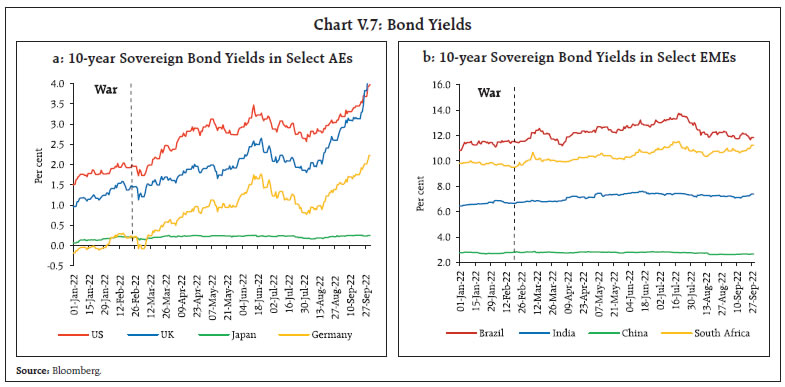 Bond yields in major EMEs have moved with a hardening bias driven by domestic monetary tightening as well as global cues (Chart V.7b). Chinese and Brazilian bond yields, however, softened modestly on their monetary policy actions. In the currency markets, the US dollar strengthened further against major global peers in Q2:2022 and Q3, reflecting the faster pace of rate hikes and quantitative tightening plans relative to other major AEs (Chart V.8a). Rising safe haven demand amidst the ongoing geopolitical upheaval and soaring energy prices have further strengthened the US dollar. The US dollar’s strength was mirrored in the weakening of EME currencies amidst ebbing investor interest. Capital outflows during March-July exacerbated the volatility in EME currencies. Capital flows resumed in August but the trend reversed in September led by equity outflows (Chart V.8b). The MSCI Emerging Market Currency Index declined by 4.4 per cent in Q2:2022 and by 5.4 per cent in Q3:2022 (up to September 28, 2022). V.5 Conclusion The risks to the global growth outlook are overwhelmingly tilted to the downside as monetary authorities undertake aggressive tightening to rein in high inflation. The uncertainty around the war and the pace of monetary tightening going ahead are imparting sizeable volatility to global financial markets, while also lending safe haven demand to the US dollar. These developments are generating large adverse spillovers to emerging market economies and posing sizeable downside risks to their growth prospects. __________________________________________________________________________________
ABBREVIATIONS | AEs | Advanced Economies | | AEs | Advance Estimates | | AIDC | Agriculture Infrastructure and Development Cess | | APP | Asset Purchase Programme | | ASEAN | Association of Southeast Asian Nations | | ATF | Aviation Turbine Fuel | | ATM | At the money | | BCD | Basic Customs Duty | | BE | Budget Estimates | | BEI | Business Expectations Index | | BIES | Business Inflation Expectations Survey | | BIS | Bank for International Settlements | | BoE | Bank of England | | BoJ | Bank of Japan | | bps | Basis Points | | BRICS | Brazil, Russia, India, China and South Africa | | BSE | Bombay Stock Exchange | | CACP | Commission for Agricultural Costs and Prices | | CAG | Comptroller and Auditor General | | CCIL | Clearing Corporation of India Limited | | CD | Certificate of Deposit | | CDS | Credit Default Swap | | CGA | Controller General of Accounts | | CI | Confidence Interval | | CiC | Currency in Circulation | | CII | Confederation of Indian Industry | | CLI | Composite Leading Indicator | | CMIE | Centre for Monitoring Indian Economy | | COVID-19 | Coronavirus Disease 2019 | | CP | Commercial Paper | | CPB | Central Planning Bureau | | CPI | Consumer Price Index | | CPI-AL | Consumer Price Index for Agricultural Labourers | | CPI-IW | Consumer Price Index for Industrial Workers | | CPI-RL | Consumer Price Index for Rural Labourers | | CRR | Cash Reserve Ratio | | CU | Capacity Utilisation | | DCA | Department of Consumer Affairs | | DGCA | Directorate General of Civil Aviation | | DGCI&S | Directorate General of Commercial Intelligence and Statistics | | DI | Diffusion Index | | DII | Domestic Institutional Investor | | EBIT | Earnings Before Interest and Taxes | | EBLR | External Benchmark Lending Rate | | ECB | European Central Bank | | ECBs | External Commercial Borrowings | | ECI | Eight Core Industries | | ECLGS | Emergency Credit Line Guarantee Scheme | | ECT | Error Correction Term | | EIA | Energy Information Administration | | EMEs | Emerging Market Economies | | EPFO | Employees’ Provident Fund Organisation | | FAO | Food and Agriculture Organization | | FBIL | Financial Benchmarks India Pvt. Ltd | | FCNR(B) | Foreign Currency Non-Resident (Bank) | | FDI | Foreign Direct Investment | | Fed | Federal Reserve | | FICCI | Federation of Indian Chambers of Commerce and Industry | | FIMMDA | Fixed Income Money Market and Derivatives Association of India | | FIs | Financial Institutions | | FL | Family Labour | | FMCG | Fast-Moving Consumer Goods | | FOMC | Federal Open Market Committee | | FPI | Foreign Portfolio Investment/Investor | | FRE | First Revised Estimate | | FRRR | Fixed Rate Reverse Repo | | F-TRAC | FIMMDA Trade Reporting and Confirmation System | | FTSE | Financial Times Stock Exchange | | GDP | Gross Domestic Product | | GFCE | Government Final Consumption Expenditure | | GFCF | Gross Fixed Capital Formation | | GFD | Gross Fiscal Deficit | | GM | Genetically Modified | | GNDI | Gross National Disposable Income | | GoI | Government of India | | GSDP | Gross State Domestic Product | | G-Secs | Government Securities | | GST | Goods and Services Tax | | GVA | Gross Value Added | | H1 | First Half of the Financial Year (April-September) | | H2 | Second Half of the Financial Year (October-March) | | HFI | High Frequency Indicator | | HSD | High-Speed Diesel | | ICIO | Inter Country Input Output | | ICR | Interest Coverage Ratio | | IIF | Institute of International Finance | | IIP | Index of Industrial Production | | IMD | India Meteorological Department | | IMF | International Monetary Fund | | INR | Indian Rupee | | IOCL | Indian Oil Corporation Limited | | IPO | Initial Public Offering | | IRDAI | Insurance Regulatory and Development Authority | | IRFCL | International Reserves and Foreign Currency Liquidity | | IT | Information Technology | | JSE | Johannesburg Stock Exchange | | LAF | Liquidity Adjustment Facility | | LIC | Life Insurance Corporation of India | | LMT | Lakh Metric Tonnes | | LPA | Long Period Average | | LPG | Liquefied Petroleum Gas | | LPR | Loan Prime Rate | | MCLR | Marginal Cost of Funds Based Lending Rate | | MFs | Mutual Funds | | MGNREGA | Mahatma Gandhi National Rural Employment Guarantee Act | | MMRP | Modified Mixed Reference Period | | MOAFW | Ministry of Agriculture and Farmers’ Welfare | | MOEX | Moscow Exchange | | MoH&FW | Ministry of Health and Family Welfare | | m-o-m | Month-on-Month | | MOSPI | Ministry of Statistics and Programme Implementation | | MPC | Monetary Policy Committee | | MPR | Monetary Policy Report | | MSCI | Morgan Stanley Capital International | | MSF | Marginal Standing Facility | | MSMEs | Micro, Small and Medium Enterprises | | MSP | Minimum Support Price | | MTDR | Median Term Deposit Rate | | NBFCs | Non-Banking Financial Companies | | NCAER | National Council of Applied Economic Research | | NDS | Negotiated Dealing System | | NDTL | Net Demand and Time Liabilities | | NEER | Nominal Effective Exchange Rate | | NPA | Non-Performing Asset | | NSC | National Savings Certificate | | NSDL | National Securities Depository Limited | | NSO | National Statistical Office | | NSSO | National Sample Survey Office | | ODOP | One District One Product | | OECD | Organisation for Economic Co-operation and Development | | OIS | Overnight Indexed Swaps | | OMCs | Oil Marketing Companies | | OMO | Open Market Operations | | OPEC | Organization of the Petroleum Exporting Countries | | OTC | Over-the-Counter | | PA | Provisional Accounts | | PADO | Public Administration, Defence and Other services | | PBoC | People’s Bank of China | | PCE | Personal Consumption Expenditure | | PDS | Public Distribution System | | PE | Provisional Estimates | | PEPP | Pandemic Emergency Purchase Programme | | PFCE | Private Final Consumption Expenditure | | PIB | Press Information Bureau | | PMG | Pooled Mean Group | | PMGKAY | Pradhan Mantri Garib Kalyan Anna Yojana | | PMI | Purchasing Managers’ Index | | POL | Petroleum, Oil and Lubricants | | POSOCO | Power System Operation Corporation Limited | | PPAC | Petroleum Planning and Analysis Cell | | PRN | Production Weighted Rainfall Index | | PSB | Public Sector Bank | | PSU | Public Sector Undertaking | | PvB | Private Sector Bank | | Q1 | First Quarter | | Q2 | Second Quarter | | Q3 | Third Quarter | | Q4 | Fourth Quarter | | q-o-q | Quarter-on-Quarter | | QPM | Quarterly Projection Model | | RBI | Reserve Bank of India | | RD | Revenue Deficit | | RE | Revised Estimates | | RECO | Revenue Expenditure to Capital Outlay | | REER | Real Effective Exchange Rate | | RHS | Right Hand Side | | RL | Rural Labourers | | RoW | Rest of the World | | S&P | Standard and Poor | | SAAR | Seasonally Adjusted Annualised Rate | | SCB | Scheduled Commercial Bank | | SDF | Standing Deposit Facility | | SEBI | Securities and Exchange Board of India | | SGS | State Government Securities | | SIAM | Society of Indian Automobile Manufacturers | | SIBC | Sector-wise and Industry-wise Bank Credit | | SLR | Statutory Liquidity Ratio | | SSE | Shanghai Stock Exchange | | SSI | Small Savings Instruments | | STR | Short Term Repo | | STU | Stocks-to-Use | | SWM | South-west Monsoon | | TBs | Treasury Bill | | TREPS | Tri-party Repo Dealing System | | TRQ | Tariff Rate Quota | | UK | United Kingdom | | UNCTAD | United Nations Conference on Trade and Development | | US | United States | | US$ | US Dollar | | USA | United States of America | | VAR | Vector Autoregression | | VAT | Value Added Tax | | VRR | Variable Rate Repo | | VRRR | Variable Rate Reverse Repo | | WAC | Weighted Average Coupon | | WACR | Weighted Average Call Money Rate | | WADR | Weighted Average Discount Rate | | WADTDR | Weighted Average Domestic Term Deposit Rate | | WALR | Weighted Average Lending Rate | | WAM | Weighted Average Maturity | | WAR | Weighted Average Rate | | WEO | World Economic Outlook | | WMA | Ways and Means Advances | | WPI | Wholesale Price Index | | WTO | World Trade Organization | | y-o-y | Year-on-Year | | YTD | Year to Date | |