VI.1 History is dotted with pandemics that mankind has suffered but endured: “The oak fought the wind and was broken, the willow bent when it must and survived.”1 This pandemic too shall pass. In its wake will arise both challenges and opportunities. The post-pandemic strategy of revival and reconstruction will shape India’s renewed tryst with its developmental aspirations. Three lessons are stark. First, never again should we be taken unprepared. Pandemics will recur and remain hard to predict. Hence, we must build policy space in good times and public health must be its centre-piece. Second, structural transformation is a process not an event; so structural reforms must be continuous, aimed at building resilience against shocks. Third, crises like pandemics leave scars, including on the psyche, such as deprivation and poverty. Healing them must be a policy priority. The post-pandemic recovery must embrace all. It calls for designing a new growth frontier, which could be strong, inclusive, resilient, durable, and sustainable over the medium-longer horizon in line with overall development goals of a country (Das, 2021). VI.2 Economic progress rides on seven wheels - aggregate demand; aggregate supply; institutions, intermediaries, and markets; macroeconomic stability and policy coordination; productivity and technological progress; structural conditions; and sustainability. The blueprint of reforms proposed in this chapter broadly covers these seven areas as the future gets reshaped by new forces such as adaptation to digitalisation, biomedical, pharmaceutical and healthcare innovation and initiatives underway for a cleaner and greener world. VI.3 Some useful insights about alternative medium-term growth trajectories can drive this agenda. Drawing on two alternative growth models, i.e., (i) a standard growth model in the neo-classical tradition (Sinha, 2017; Hevia and Loayza, 2012), which involves decomposing different components of growth into total factor productivity (TFP), human capital growth and growth in capital, and (ii) an endogenous economic growth model (Barro and Sala-i-Martin, 1992; Alogoskoufis and Kalyvitis, 1996) [Annex 1], the steady-state growth works out to 6.5 per cent (Chart VI.1). Scenario analysis suggests a feasible range for the medium-term steady state growth of 8.5 per cent to 6.5 per cent for GDP under the first approach and 8.6 per cent to 6.5 per cent under the second approach. The upper estimate of the growth trajectory is consistent with reform measures outlined in this chapter*. VI.4 Timely rebalancing of monetary and fiscal policies will likely be the first step in this journey. First, the large surplus liquidity overhang has to be withdrawn - every percentage point increase in surplus liquidity above 1.5 per cent of NDTL causes average inflation to rise by 60 basis points in a year. Monetary policy has to assign priority to price stability as the nominal anchor for the future growth trajectory. Second, growth is at risk once general government debt exceeds a threshold of 66 per cent of GDP. Reducing debt to more sustainable levels that are compatible with the growth trajectory being envisaged for a post-pandemic Indian economy will be daunting. Even under best possible macroeconomic outcomes, general government debt may not decline below 75 per cent of GDP over the next five years. If adverse scenarios materialise, debt may, in fact, rise to 90 per cent of GDP in 2026-27. A medium-term strategy of debt consolidation aimed at reducing debt to below 66 per cent of GDP over the next five years is, therefore, important to secure India’s medium-term growth prospects. With monetary policy prioritising price stability and pursuing output stabilisation in an environment in which debt sustainability is sought to be achieved by fiscal prudence, the assignment rule is satisfied, bringing in its train macroeconomic stability to support sustainable growth. 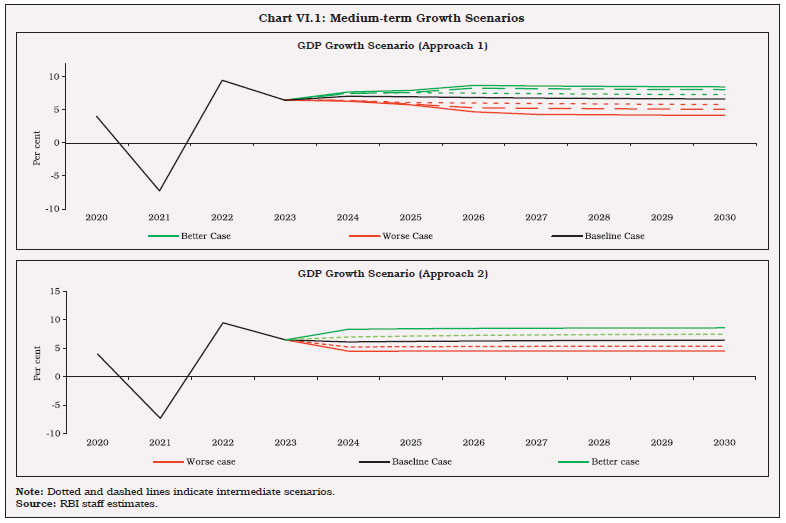 VI.5 Addressing structural constraints is central to reviving and reconstructing the Indian economy from the ravages of the pandemic. The Government has announced privatisation and asset monetisation; tax reforms (GST and corporate tax rationalisation); targeted sector-specific incentives to raise production and exports under the production-linked incentive (PLI) scheme; insolvency and bankruptcy code (IBC) to improve the credit culture and resource allocation mechanism; labour reforms (four codes); and a fiscal policy focus on capex and infrastructure. These reforms need to be augmented with other measures to reverse the sustained decline in private investment and low productivity in the economy. What is needed includes access to litigation free low-cost land; raising the quality of labour through large scale expansion of public expenditure on education, health and the Skill India Mission; reducing the cost of capital for industry and improving resource allocation in the economy by promoting competition; encouraging industries and corporates to scale up R&D activities with an emphasis on innovation and technology; creating an enabling environment for start-ups and unicorns; encouraging corporate investment in agriculture; addressing the challenges faced by the debt-ridden telecom industry and DISCOMs; rationalisation of subsidies that promote inefficiencies; encouraging urban agglomerations by improving the housing and physical infrastructure. VI.6 Recent labour reforms could enhance flexibility for firms to adjust their workforce according to economic cycles, thereby enabling them to use their resources more efficiently. This, however, could come only at the cost of lower welfare/social security of the workers. One option could be to build an unemployment insurance fund during periods of economic boom at the firm level, which can be utilised to financially support workers up to a limited period after retrenchment. Further, many of the social security measures apply to firms having a certain minimum number of workers, which creates incentives for firms not to scale up. To address this issue, a policy option could be universal access to social security irrespective of firm size, with each firm required to earmark a certain percentage of their profits for the social security schemes for the workers. VI.7 Boosting India’s participation in global value chains (GVCs) and raising export competitiveness hinges on greater adoption of technology. Policy support for this drive must emphasise (i) an ecosystem that increases the adaptability of domestic firms to state-of-the-art technology; (ii) ensuring policy certainty on royalty payments for technology transfer by foreign companies; and (iii) improving domestic R&D infrastructure for innovations. The industrial revolution 4.0 and committed transition to a net-zero emission target will create new investment opportunities powered by technology and environmentally sustainable production processes. Building on “Start-up India, Stand-up India”, the policy ecosystem for the start-ups needs a dynamic framework with provision for adequate access to risk capital and globally competitive environment for doing business. The PLI scheme recognises growth opportunities in 14 key manufacturing sectors of the economy. It is important that global quality benchmarks are put in place for new capacities to be created in identified sectors under the PLI scheme. VI.8 A comprehensive plan is necessary to revive the rural economy. Organising farmers’ clubs or agricultural cooperatives is a possible solution to correct the pricing imbalances by reducing gaps between farm gate prices and retail prices. In this regard, the development of a modern supply chain infrastructure needs priority attention. There is a need to adopt a viable ‘whole of business’ approach covering all aspects of farming to break farmers’ dependence on money lenders. VI.9 In order to benefit from the post-pandemic global recovery in demand, certain preconditions such as improving the quality of exports through greater emphasis on innovations and R&D, easier access to critical inputs - both domestic and imported - and more effective FTAs based on trade complementarities would be essential. The growing focus on digitalisation offers immense opportunities. The early adopters of frontier technologies will have the first-mover advantage by becoming more cost efficient. Small and medium-sized businesses would need to gain access to global markets by using digital platforms. IT companies can gain in the world market by undertaking investments in next-generation technologies. The use of frontier technologies in delivery of services would also increase the domestic value-added content in manufacturing and improve the competitiveness and exportability of domestic goods. In particular, the MSME sector can benefit from business-to-consumer e-commerce export opportunities by improving operational and supply chain efficiencies. VI.10 India’s ongoing and future free trade agreement (FTA) negotiations may focus not only on securing greater market access for domestic goods and services but also on better trade terms for high quality imports from partner countries and transfer of technology. The focus of bilateral trade agreements should be bilateral technology-sharing and forging partnership/alliance in sectors where indigenous capabilities may be weak. As the global trade environment is becoming increasingly complex and prone to more disputes, rules and provisions with regard to digitally enabled trade, data security issues and intellectual property rights should get adequate coverage in trade agreements. In order to expand exports, India needs to rationalise its tariff and non-tariff rate structure on a reciprocal basis, and this should be accorded priority under the ongoing FTAs. VI.11 Greater absorption of foreign capital in the economy for productive investment within the current sustainable level of CAD and raising the sustainable threshold for CAD in the medium-run through higher FDI flows and export conducive imports can raise the benefits of financial openness for India. Further easing of outward FDI norms and incentivisation of capital goods imports can contain the fiscal (sterilisation) cost and/or appreciation pressure on the INR. It can also help strengthen India’s linkage in GVCs through a combination of trade, FDI and strategic partnerships abroad. The policy focus should be to attract FDI in more sectors, particularly those with domestic technological gaps, viz., defence, industrial machinery, agricultural machinery, electronics and earthmoving machinery. The FDI policy also needs to incentivise the adoption and transfer of cleaner technologies for domestic companies which would enhance domestic firms’ ability to meet strict product specifications in foreign markets. VI.12 Stronger growth and associated improvement in the outlook for income and employment is critical for raising the savings of households. As demand recovers on the back of policy stimulus, enhancing the capacity of the financial system to propel stronger and inclusive growth must be prioritised. VI.13 Broadening and deepening of financial markets and increasing their liquidity and resilience has to be the cornerstone of financial sector policies. The inherent objective is to help allocate resources and minimise risks that are inherent to a finance-led growth strategy. VI.14 It is necessary to wean away PSBs from their dependence on the government for recapitalisation. On a positive note, a beginning in this direction has already been made with larger and stronger PSBs raising significant resources from the market. Stronger corporate governance norms in the banking segment is a priority area. Efforts need to be made to strengthen the compliance culture that adapts to norms not only in letter but also in spirit. VI.15 Going forward, the economy’s growing reliance on the digital ecosystem will be helpful in harnessing the benefits of low-cost resource allocation and distributive efficiency. Care, however, needs to be taken to protect the stakeholders from digital frauds, data breaches and digital oligopolies. Recognising the vastly altered financing requirements of the start-ups and unicorns, a policy framework for attracting risk capital needs to be put in place. Given the large long-term financing requirements of the infrastructure sector, NaBFID may have to scale up quickly and explore ways to attract resources from insurance, pension and provident funds. Climate change risks and frequent natural calamities call for including green finance and other sustainable growth objectives in future financial sector policies. These measures are expected to pave the way to a more developed and efficient financial system which, in turn, should help in greater financial inclusion, reduce vulnerabilities to shocks and promote investment and growth.
____________________________________________________
Annex 1: Alternative Growth Models and Medium-term Growth Scenarios Approach 1: Growth Decomposition According to the neoclassical approach, a standard production function entails that The above equation offers some important insights. First, the TFP growth (gA) has a direct effect on overall GDP growth of the economy. Second, the larger labour share of income (α) implies higher contribution of the labour force participation rate, working age population to population ratio and human capital per worker to output growth. Finally, ceteris paribus, the same level of investment share in output can lead to different output growth depending on the level of the capital-output ratio (K/Y). Investment’s contribution to growth reduces as the capital-to-output ratio goes up in the economy. So, an investment-led growth strategy may work at lower levels of capital stock accumulation but could eventually exhibit diminishing returns unless supported by reforms that focus on growth of productivity, human capital and higher labour force participation. Approach 2: Endogenous Growth Model The model presented here follows the seminal works on endogenous growth owing to Barro and Sala-i-Martin (1992) and Alogoskoufis & Kalyvitis (1996). We consider a partial equilibrium model with unit measure of infinitely lived identical competitive firms who take the available technology level and the available public infrastructure stock as given but individually choose the labour input and the investment level at time t. Firms face an investment adjustment cost. The production function is like the earlier specification. The model suggests that if private capital and public capital keep growing at a constant rate, then the economy can sustain a growth path which is endogenous to the economy, even by keeping the exogenous technology level and the size of the effective labour force constant. If the exogenous technology improves, then the economy can maintain a higher long run growth path. Reduction in government’s consumption expenditure ratio also promotes higher growth in the long run. For generating medium-term growth scenarios, the parameter values relevant for India in Table 1 are used. Under the first approach, historical KLEMS data are used to identify feasible baseline and extreme scenarios. As per KLEMS data for the period of post globalisation the median growth rate of TFP (gA) works out to 1.1 per cent which is assumed for the baseline specification. The labour force participation rate (LFPR) growth (gϱ) in the recent PLFS reports of 2019-20 shows a remarkable rise in the last two years. On the other hand, there was a declining trend in LFPR growth according to the World Bank database in the last decade. Taking cue from both sets of information, the representative central tendency of LFPR growth is used to simulate the model. To approximate the growth rate of working age population (WAP) and the population growth rate, relevant data are sourced from the World Bank. Both being demographic parameters, they are not changed for building the best-case and worst-case scenarios. For investment to GDP ratio (I/Y), the average gross fixed capital formation (GFCF) as a percentage of GDP is taken from the Handbook of Statistics on the Indian Economy, RBI. The capital income share (1 - α) of the manufacturing sector is assumed to be 0.7 as suggested by the KLEMS estimates. The depreciation rate of private capital δ is taken as 10 per cent (Banerjee and Basu, 2019). The depreciation rate of public capital (δg) is assumed to be higher than δ and is set at 14 per cent. While the real policy interest rate (r) remains negative during the recovery from the pandemic shock, following Behera et al. (2017), a positive 1 per cent real policy interest rate is assumed for the economy in the medium-term. The tax rate (Ty) is pegged at 25 per cent and revenue expenditure of combined government (excluding interest payment and subsidies) to GDP is set at 16 per cent for the baseline case. The A0 term which represents technology augmented labour supply is set at 1 for the baseline. The aggregate employment measure adjusted by labour income share is estimated using the KLEMS manufacturing data. The marginal adjustment cost of investment (b) is conventionally assumed to be high if human capital adjustment cost is not considered explicitly in the model (Barro and Sala-i-Martin, 2004), and accordingly is set at 5.45. | Table 1: Parameter Specifications | | Sl. No. | Parameters | Baseline Case | Best Case | Worst Case | | Model 1 | Model 2 | Model 1 | Model 2 | Model 1 | Model 2 | | 1. | gA (technology) | 1.1% | - | 2.4% | - | -0.8% | - | | 2. | α (labour income share) | 0.3 | 0.3 | 0.3 | 0.3 | 0.3 | 0.3 | | 3. | gϱ (lfpr) | 1.1% | - | 2.1% | - | 0.1% | - | | 4. | gφ (wap) | 0.4% | - | 0.4% | - | 0.4% | - | | 5. | gh (skill) | 1.11% | - | 2.2% | - | 0.6% | - | | 6. | gN (population) | 1.01% | - | 1.01% | - | 1.01% | - | | 7. | δ (dep) | 0.1 | 0.1 | 0.1 | 0.1 | 0.1 | 0.1 | | 8. | I / Y | 31% | - | 31% | - | 31% | - | | 9. | b | - | 5.45 | - | 5.45 | - | 5.45 | | 10. | Ty (tax-GDP) | - | 0.25 | - | 0.25 | - | 0.25 | | 11. | δG (dep, pub) | - | 0.14 | - | 0.14 | - | 0.14 | | 12. | g (revenue exp-gdp) | - | 0.16 | - | 0.157 | - | 0.163 | | 13. | r | - | 1.01% | - | 1.01% | - | 1.01% | | 14. | A0 | - | 1 | - | 1.01 | - | 0.99 | | 15. | Lα | | 1.6 | | 1.6 | | 1.6 | References Alogoskoufis, G. S., and Kalyvitis, S. C. (1996), “Public investment and endogenous growth in a small open economy”. Centre for Economic Policy Research. Banerjee, S., and Basu, P. (2019), “Technology shocks and business cycles in India”. Macroeconomic Dynamics, Vol. 23(5), 1721-1756. Barro, R., and Sala-i-Martin, X. (2004), “Economic growth”, second edition. Barro, R. J., and Sala-i-Martin, X. (1992), “Public finance in models of economic growth”. The Review of Economic Studies, Vol. 59(4), 645-661. Behera, H., Wahi, G., and Kapur, M. (2017), “Phillips Curve Relationship in India: Evidence from State-level Analysis”. RBI Working Paper Series No. 08. Das, Shaktikanta (2021), “Beyond COVID: Towards a Stronger, Inclusive and Sustainable Economy”. Reserve Bank of India. https://www.rbi.org.in/Scripts/BS_SpeechesView.aspx?Id=1128 Hevia, C., and Loayza, N. (2012), “Saving and growth in Egypt”. Middle East Development Journal, Vol. 4(01), 1250002. Sinha, R. (2017), “Long-term growth scenarios for Bangladesh”. World Bank Policy Research Working Paper, No. 7952.
|