The Indian economy was baffled with several structural constraints to growth even before the outbreak of COVID. COVID induced disruptions, especially in the supply front, have posed additional challenges before the economy. The sub-optimal share of manufacturing in gross value added (GVA); deployment of the bulk of physical investment in a few capital-intensive sectors leading to low overall productivity; labour market rigidities hindering the creation of formal employment; the subsidy-heavy and low-investment imbalance in agriculture depressing yields; and weak growth dynamism in services reflect several infirmities in major sectors of the economy, which would require bold factor and product market reforms and effective implementation of several momentous reforms already announced to accelerate the growth momentum on a durable basis in the medium-term. 1. Introduction III.1 Even before the outbreak of the pandemic, a distinct deceleration in the growth momentum had set in from H2: 2016-17 in India, triggering a public debate on the state of India’s potential output in view of prolonged sluggishness in investment and productivity (Dieppe, 2021). With trend growth of 7.0 per cent (2003-20) at risk, structural reforms have been called for in order to regain and secure it as the trajectory over the medium-term (Economic Survey, 2020). In this context, this chapter addresses the structural reforms that are needed to invigorate post pandemic growth. Set against the backdrop of the transformation that is underway in the economy, the chapter examines key drivers and targeted policy interventions in the form of a range of sector specific reforms to remove bottlenecks and revive growth. The remaining part of this chapter is organised under six sections. Section 2 examines the pattern and nature of structural change in India. Drivers of productivity growth, the relative importance of factor productivity over factor endowment in India’s growth process; and resource reallocation to raise overall productivity growth is the focus of Section 3. Section 4 provides an assessment of structural impediments to growth in agriculture, industry and services, and their sub-sectors. Enabling conditions for growth at the economy level for the benefit of all sectors is the focus of Section 5. Section 6 covers issues relating to factor market, in particular land, where litigation free access at affordable cost remains a major impediment to growth.1 Section 7 concludes the chapter and presents a set of policy priorities that could raise India’s trend growth path in the medium-term. 2. Structural Transformation in India III.2 Transformative structural change requires moving production to sectors with increasing returns or higher productivity, where strategic policy interventions play a crucial role2. Innovation is the key driver of such structural shifts (Schumpeter, 1939) and diversification (away from traditional low productive sectors) along with sophistication of production processes could be an indication of such progresses (UNIDO, 2009). III.3 Accordingly, considerable attention has been devoted to defining and measuring structural change in the presence of productivity gaps across sectors, and even between firms in the same industry. While the two most commonly used indicators of economic progress in the literature are per capita GDP and some simple measures of productivity (such as labour productivity), the three most commonly tracked indicators of structural transformation are sectoral shares in value added, employment and consumption expenditure (Herrendorf et al., 2014). It is also important to track labour productivity (output per unit of labour), which could have two broad patterns – increase in productivity within a sector due to capital accumulation or change in technology, and at the level of the economy due to labour moving from low productive to high productive sectors (McMillan and Rodrik, 2011). The determinants of structural transformation could broadly include: (a) changes in income; (b) changes in relative (sectoral) prices; (c) changes in input–output linkages; and (d) changes in comparative advantage(s) through globalisation and trade. Differences in income elasticities across sectors could be a driver of structural change. Changes in sectoral relative prices can also induce reallocation of activity to the extent that they reflect differences in technology and total factor productivity (TFP) growth. The input-output matrix, a complex web of the underlying structure of an economy, has become a major driver of structural change due to rising importance of domestic and global supply chains where specialisation in each part of the production process by different players is more important than one player specialising in all parts of the value chain. In an open economy setting, comparative advantages open up new opportunities to drive sectoral reallocation of resources. III.4 In India, the sub-optimal share of manufacturing sector in gross value added (GVA) is an outcome of persistent structural constraints, resulting in the lowest share of manufacturing in GVA among a peer group of economies that are endowed with similar resources (Dieppe, 2021). Moreover, the bulk of physical investment in India is deployed in a few capital-intensive sectors, leading to low overall productivity in the economy. Together with labour market rigidities, this has hindered the creation of formal employment in the economy. As manufacturing productivity is considerably higher than other sectors, this incentivises the workforce to shift from low productive sectors, particularly agriculture, to manufacturing, as the global experience shows (Lewis, 1955; Kaldor, 1966; Chenery et al., 1986), giving rise to a virtuous cycle of growth and investment. Indian agriculture also suffers from structural impediments, resulting in low yields and sticky cropping pattern. To correct imbalances in agriculture, the policy thrust should not only change from subsidy-led to investment-led production but also from managing scarcity to managing surpluses (Gulati et al., 2020). In several services sectors such as telecommunication, transportation and logistics, retail and wholesale trade, real estate and tourism, the quality of service and growth dynamism remain less than desirable. Economic growth, in terms of simple accounting, is the sum of growth in factor inputs and productivity. Contrary to factor inputs, productivity growth provides an opportunity to increase output without increasing inputs and incurring related costs. After the Global Financial Crisis (GFC) 2008-09, however, the world economy faces a stagnation in productivity growth (Arnold and Grundke, 2021). A peculiar attribute of factor productivity is its very high correlation with GDP growth. Productivity deceleration/stagnation appears to be an emerging risk for India, given the post-GFC global experience, and requires targeted sector-specific policy interventions. III.5 Over the last 70 years, the Indian economy witnessed a remarkable transformation from a predominantly agriculture-based to a services dominated economy (Chart III.1). Industry’s share was increasing up to 1990s after which it has stagnated. III.6 Employment dependence on agriculture continues to remain high even after a decline in its share in total employment from around 70 per cent in 1980-81 to 41.3 per cent in 2018-19 (Chart III.2). During the same period, the employment share of industry remained unchanged at around 12 per cent, while the share of services increased from around 19 per to 47 per cent. III.7 A dominant share of real gross capital formation (GCF) is allocated to the industrial sector (Chart III.3). III.8 An analysis of the composition of aggregate GVA, aggregate employment and GCF shows that manufacturing has not generated commensurate employment and value addition, leading to adverse outcomes for sectoral productivity and system-wide efficiency (Chart III.4). III.9 The share of capital intensive ‘other manufactured goods’ and ‘machinery and equipment’ in manufacturing GVA increased to above 60 per cent in 2011-20 (Chart III.5). However, labour intensive sectors such as textile, readymade garments, leather products, food products and beverages have lost ground. Stringent labour regulations have contributed to a slow growth in employment in the organised sector (Panagariya et al., 2008). These regulations also result in labour market frictions which cause decreases in wages in the modern sector (Ghate et al., 2016), employment of inefficient labour (Gupta and Kumar, 2012) and constrain the growth of the modern sector by deterring entry of firms and skewing firm-size distribution (Alfaro and Chari, 2014). Other factors include low wage differentials between the non-agricultural informal sector and the agricultural sector for the unskilled work force, linguistic differences, lack of social protections such as mutual insurance provided to members of the same sub-caste networks (Munshi and Rosenzweig, 2009), and lack of cheap urban housing and poor planning in urban areas (Banerjee, 2006). More recent studies also show that policy interventions in the form of wage setting and providing unemployment benefits by the public sector may only increase the unemployment rate and increase the size of the informal sector (Ghate and Mazumder, 2019). This may also result in lowering the wage rate in the private sector. 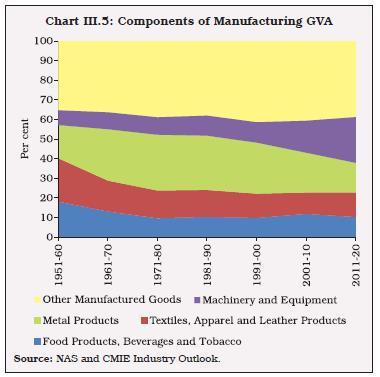 III.10 The changing mix of GVA is also visible from the evolution of India’s exports composition. The share of services in gross exports increased from around 20 per cent in 1990-91 to above 40 per cent in 2020-21, driven by skill intensive information technology (IT) and business services. Among goods exports, engineering goods’ share almost doubled from around 10 per cent in 1990-91 to around 18 per cent in 2020-21 (Chart III.6). The decline in the share of labour intensive sectors in exports has adverse repercussions on employment generation and absorption of new workers migrating from agriculture sector. 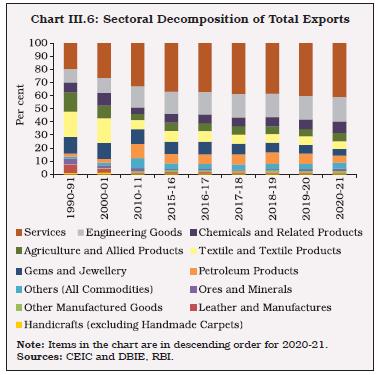 III.11 In this backdrop, policy actions to alleviate labour market frictions can lift potential output, supported by re-skilling programmes. Higher subsidies towards agriculture are hardly a solution when a shift of resources from subsidies to capital investments in agriculture can yield higher output. A mix of tax and subsidy policies can, therefore, be used to modernise agriculture to reduce labour dependence on farm activities, besides boosting capital formation in more productive sectors. In this way, the problems of reverse migration of labour amidst the pandemic could be addressed and further absorption of labour in firms with higher productivity and wages can be encouraged. 2.1 Rising Role of Urban Agglomerations III.12 Seventeen of the 20 fastest-growing cities in the world between 2019 and 2035 will be from India (Economic Times, 2020). Indian cities are likely to contribute 70 per cent of India’s GDP by 20303. A comparison of decadal incremental rise in urban and rural population shows that for the first time, urban areas would add more new persons than rural areas (Chart III.7). A rapidly urbanising Indian economy poses several challenges for policymakers, ranging from generation of adequate quality employment to creating a robust and inclusive infrastructure. 3. Productivity Trends III.13 Globally, productivity growth has undergone a prolonged slowdown since 2010, after a brief recovery in the years immediately following the GFC (Chart III.8), with the deceleration in total factor productivity (TFP)4 being relatively sharper in emerging and developing economies. The slowdown in productivity growth has been attributed to a weakening investment climate, lower growth in employment in developed economies, reduced participation in global value chains, and fading gains from factor reallocation (Dieppe, 2021). The growing emergence of monopolistic forces across sectors and decline in dynamism of traditional firms also contributed to the loss of productivity (Parente and Edward, 1999; Herrendorf and Teixeira, 2004). 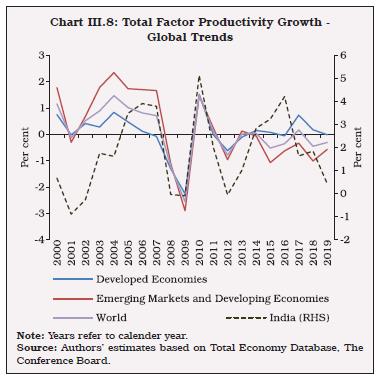 III.14 Labour productivity, measured by the value added per worker, has followed a similar trend. Despite showdown, India’s average labour productivity growth for 2010 to 2019 at 6.5 per cent was much higher than the emerging market average of 2.9 per cent (Chart III.9). III.15 India suffered a moderate decline in TFP growth compared to the global experience with average TFP growth rate in India during 2010 to 2019 estimated at 2.25 per cent as against the emerging market average of -0.3 per cent for the same period. TFP growth accounted for about 30 per cent of India’s aggregate GDP growth during 2014 to 2018 (Chart III.10). In fact, the acceleration of GDP growth during this period can be attributed to increase in TFP growth, as contributions from both capital and labour declined. Since 2018-19, there has been a notable slowdown in TFP growth. III.16 TFP growth during 2014 to 2017 was mainly driven by non-market services such as public administration, defence, education, social works and related services (Chart III.11a). This raises doubts about the sustainability of aggregate TFP growth, given that TFP growth from market driven sectors (i.e., when non-market services and agriculture are excluded) has generally remained higher than aggregate TFP growth in years of high real GDP growth (Chart III.11.b). 3.1 Drivers of TFP Growth III.17 The factors that support sustained TFP growth over the long run can be broadly categorised into: (i) fostering innovation at the national level; (ii) facilitating diffusion of new technologies available at the global level among domestic firms; and (iii) reducing resource misallocation, particularly skill mismatches (OECD, 2015). III.18 In a market economy, the most innovative firms are expected to thrive. Innovation can be promoted through a pro-competition environment incentivising the entry of new innovative firms (OECD, 2015). India ranks significantly below the major developed and emerging countries in terms of innovation activities being carried out nationally (Chart III.12a)6. India also ranks far below other major economies in terms of aggregate research and development (R&D) expenditures, and also in the extent of participation by private business entities in R&D activities (Chart III.12b and Chart III.12c). In fact, the share of businesses in aggregate R&D expenditures in India is among the lowest across major countries, which implies that innovation activities in India are largely being carried out by the government and public sector enterprises (Chart III.12c). Consequently, aggregate productivity occupies the lower rung in a cross country comparison (Chart III.12d). 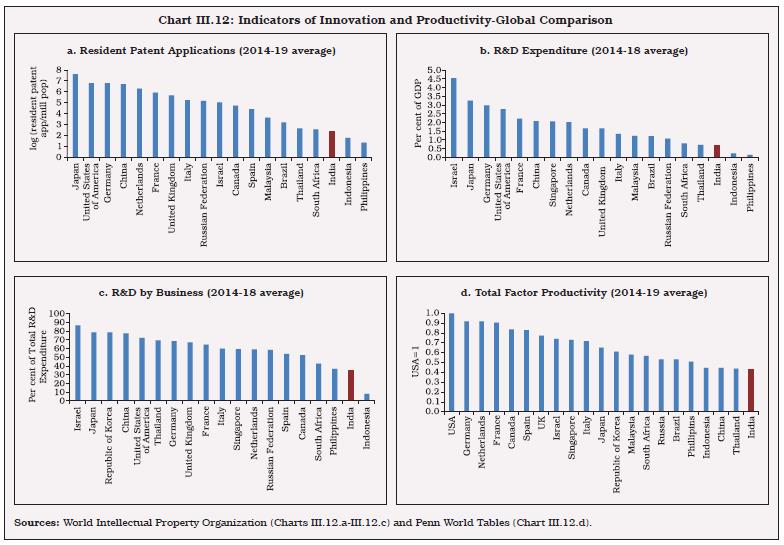 III.19 On the diffusion of technologies, the prominent factors are global connections via trade and FDI (Alvarez et al., 2013; Melitz and Trefler, 2012), participation in global value chains (GVCs) (Saia et al., 2015); synergic investments in R&D, skills and organizational know-how, particularly managerial capital, commonly known as knowledge based capital (KBC) (Griffith et al., 2004). Lower GVC participation across the globe since 2011 has possibly curtailed the scope for technology diffusion. III.20 Investment demand reflected by annual average growth of gross fixed capital formation (GFCF) has decelerated since 2008, both in India and other major emerging economies. This poses a challenge to sustaining TFP growth in the future, as stepping up private sector investment in R&D activities also requires a favourable overall investment outlook. Estimates suggest that capital deepening through higher investment in machinery and other fixed assets improve TFP growth in India (Box III.1). This process could, however, yield a desirable outcome only when supported by simultaneous improvement in the productivity of capital through innovations. Estimates also suggest that improvement in the education profile of the labour force improves TFP growth. Box III.1
Structural Determinants of TFP Growth in India Total Factor Productivity (TFP) growth can be explained through the sensitivity of the economy to four factors: (a) capital deepening, which is represented by growth in the stock of fixed capital; (b) capital composition, which is the average rental price of capital across three major types viz. construction, machinery and transport equipments; (c) labour quality, which is an index of the composition of the labour force under five broad education categories7 weighted by their average annual earnings, and (d) input use intensity measured by input growth. India KLEMS data for the period 1990-91 to 2017-18 have been used for 27 broad industries disaggregated into 6 major sectors, i.e., (1) agriculture; (2) manufacturing; (3) infrastructure industries that include mining, construction, electricity, gas and water supply; (4) financial services; (5) market services; and (6) non-market services that include public administration, defence, health and education related services. Panel data estimates8 covering these 6 sectors suggest that: -
Capital deepening generally improves TFP growth (Table 1). -
Capital composition, representing the average rental price for capital, has a negative relationship with TFP growth. An increased cost of capital, such as machineries, without any significant improvement in its productive capabilities may restrict firms from expanding its scale of operations and technological upgradation, limiting its TFP growth. -
Improvement in labour quality is observed to have a positive impact on TFP growth. -
Input growth shows a positive association with TFP growth. A disaggregated analysis suggests that these effects are positive for agriculture, manufacturing and non market services. The effects are not significant for infrastureture industries and financial services. | Table 1: Determinants of TFP Growth | | | With lag 1 of endogenous var | With lag 2 of endogenous var | With lag 3 of endogenous var | With lag 4 of endogenous var | | Dependent Variable: Growth in TFP | | Growth in TFP-Lag 1 | 0.05 | 0.10 | 0.09 | 0.18* | | | (0.15) | (0.09) | (0.09) | (0.10) | | Growth in TFP-Lag 2 | 0.51** | 0.41* | 0.41* | 0.22* | | | (0.24) | (0.22) | (0.23) | (0.13) | | Growth in TFP-Lag 3 | -0.32*** | -0.32*** | -0.38*** | -0.30*** | | | (0.08) | (0.09) | (0.09) | (0.07) | | Growth in Capital Stock | 2.89*** | 3.15*** | 3.03** | 2.68*** | | | (1.10) | (1.13) | (1.26) | (0.87) | | Growth in Capital Composition | -4.15*** | -5.82*** | -6.39*** | -6.85*** | | | (1.03) | (0.99) | (1.16) | (0.81) | | Growth in Labour Quality | 58.84*** | 69.26*** | 75.58*** | 75.30*** | | | (12.55) | (17.77) | (13.60) | (11.47) | | Input Growth-Lag 2 | 0.23*** | 0.29** | 0.29* | 0.23 | | | (0.06) | (0.15) | (0.17) | (0.33) | | Value Added Growth-Lag 2 | -0.57** | -0.54* | -0.59** | -0.37** | | | (0.28) | (0.29) | (0.30) | (0.15) | | N | 138 | 132 | 126 | 120 | Notes: Robust Standard errors in parentheses.
*, **, *** represent statistical significance at 10, 5 and 1 per cent, respectively. | References: Levinsohn J., Petrin A., “Estimating Production Functions Using Inputs to Control for Unobservables”, The Review of Economic Studies, Volume 70, Issue 2, April 2003, Pages 317–341. | III.21 As regards reallocation of labour and capital from low productive to high productive sectors, reduction in skill mismatches within an economy is an important channel to improve aggregate TFP growth (OECD, 2015). Estimates suggest that a more efficient reallocation of labour and capital across firms can improve TFP growth by up to 60 per cent in the Indian manufacturing sector (Hsieh and Klenow, 2009). On the other hand, when this reallocation mechanism stalls, the aggregate TFP growth tends to be lower. The latest estimates for India on factor reallocation effects suggest that the contribution of resource reallocation to aggregate TFP growth declined from 82 per cent of aggregate TFP during 2001-2010 to 42 per cent of aggregate TFP during 2011-2019 (Box III.2). The productivity increase in India after 2010 was driven mainly by within industry TFP rise and less by resource reallocation effects across industries. From a policy perspective, therefore, the focus should be on addressing market distortions, reducing skill mismatches, ensuring greater product and labour market flexibilities. Box III.2
Resource Reallocation for Higher Productivity Growth The 27 sector KLEMS data framework is used to determine the role of resource reallocation in driving productivity growth in India during 2000 to 2019. Aggregate output is defined in terms of standard production possibility frontiers for estimating industry origin of aggregate productivity growth and the resource reallocation effects (or structural change). Following Jorgensen 20079, the resource reallocation effect is given as: The first and the second terms in the equation capture reallocation of capital and labour across sectors. The third term indicates a weighted average of industry TFP growth. The weights of the TFP are Domar weights (Domar, 1961) - improvement of TFP as the result of two effects, i.e., a direct effect of an increase in output of own industry and an indirect effect due to increase in output sold to other industries for use as intermediate inputs. Aggregate annual average TFP growth increased from 1.33 per cent during 2001-2010 to 2.72 per cent during 2011-2019 (Table 1). During the 2000s, resource reallocation was the driver of aggregate productivity whereas post 2011, within industry TFP increase was a stronger force and contributed more to aggregate productivity growth. On an average, within industry TFP increase accounted for 58 per cent of the aggregate TFP growth during 2011 to 2019 whereas resource reallocation effects accounted for the remaining 42 per cent. In the earlier subperiod of 2000, resource reallocation contributed to 84 per cent of aggregate productivity. During both sub periods, the labour reallocation effect were relatively higher than capital reallocation, indicating faster movement of labour to high wage sectors and a relatively slower expansion of capital in industries offering higher prices for capital. Disaggregated domar weighted productivity trends suggest that the pattern of TFP growth is not broad-based, and there are substantial productivity gaps across sectors (Chart 1). Within industries, the top performing sector in terms of contribution to productivity includes labour intensive industries like textiles and leather; rubber and rubber products; parts and component producing sectors like machinery and transport equipment; and import intensive sectors like coke refined products and petroleum products. In services, financial and business services, which has the largest interlinkages with other sectors, productivity has been high. Market services like trade, telecom, transport and storage contributed negatively to productivity growth. | Table 1: Aggregate Reallocation Effects | | Time Period | 2001 to 2010 | 2011 to 2019 | | Aggregate TFP Growth | 1.33 | 2.72 | | Domar Weighted Productivity | | | | Agriculture | -0.09 | 0.52 | | Industry | -0.05 | 0.76 | | Market Services | 0.40 | -0.24 | | Financial and Business Services | -0.19 | 0.17 | | Non Market Services | 0.14 | 0.36 | | Reallocation of Capital | 0.47 | 0.46 | | Reallocation of Labour | 0.66 | 0.68 | | Source: Authors’ estimates based on India KLEMS. |
References: Jorgenson, D. W., Ho, M. S., Samuels, J. D., & Stiroh, K. J. (2007). Industry origins of the American productivity resurgence. Economic Systems Research, 19(3), 229–252. Domar, D. E. (1961). On the Measurement of Technological Change, The Economic Journal, Volume 71, Issue 284, Pages 709-72 | 4. Structural Impediments in Key Sectors 4.1 Agriculture and Allied Activities III.22 The agriculture and allied (A&A) sector comprises crops (both agricultural and horticultural), livestock, fishing and aquaculture, and forestry and logging. The importance of the sector arises from the point of view of food and nutrition security, the supply of raw materials to the industrial sector and the generator of demand for industrial and services output. The sector is also the largest provider of livelihood and employment. III.23 From an initial condition of subsistence farming, food shortages and dependence on imports at the time of independence, India has transformed into a food surplus economy and an exporter of agricultural commodities. The country has emerged as a leading producer of cereals, pulses, vegetables, fruits, sugarcane, milk, fish, poultry and cotton in the world. III.24 Horticulture crop production has increased 11.2 times since 1950-51 while production in the livestock sector has increased in similar large multiples (Charts III.13a and Charts III.13b) driven by rising per capita incomes and the consequent change in consumption patterns. III.25 India’s share in world agricultural exports has risen steadily from a little less than one per cent in the mid-1990s to 2.2 per cent in 2020 and in world agricultural imports from less than 0.5 per cent to 1.4 per cent (Chart III.14). The export shares of rice, marine products, meat products, groundnut, spices, fruits, vegetables, milk products, processed vegetables and fruit juices have increased. III.26 The agriculture export policy of 2018 aimed at doubling India’s agricultural exports from US$30 billion to US$60 billion by 2022; by 2020-21 these exports reached US$41.7 billion. Low Capital Formation III.27 Over the last decade, there has been a trend deceleration in the growth of gross capital formation (GCF) (Chart III.15a). III.28 Public sector GCF in agriculture has stagnated during the 2010s. Growth in private GCF has also moderated, reflecting the behaviour of the household sector which accounts for the majority share (Chart III.15b). 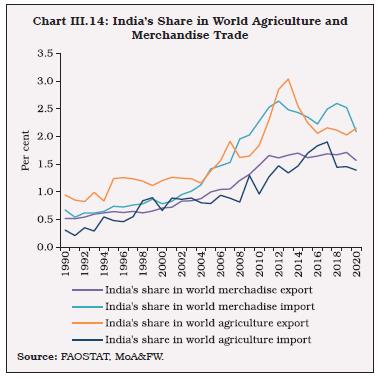  III.29 As early as 2000, the Pradhan Mantri Gram Sadak Yojana (PMGSY) (Prime Minister’s Village Road Scheme) was launched as a centrally sponsored scheme. The connectivity it provided to villages that had no access to the rest of the economy, except by way of foot, brought about sweeping changes in the lifestyles of many villagers in hilly terrains and boosted income levels, altered production and consumption cycles and integrated these villages with the broader Indian economy. This nationwide plan is crying out for replication across the country. Investments in rural roads have strong multiplier effects, working through improved access to better agricultural inputs, extension services and alternative rural occupations. Public investment in roads, agricultural research and development (R&D) and rural infrastructure can crowd in private investment and generate sustained impulses of growth in agriculture (Akber and Paltasingh, 2019; Bathla, 2014). Research and Development Expenditure III.30 Agriculture R&D expenditure has been less than 1 per cent of agriculture GVA, which is substantially lower than some of the peer groups such as that of 1.82 per cent for Brazil in 2013 (latest available data, (ASTI, 2016)) and exhibits a declining trend. At the regional level, the excessive input use practices driven by Minimum Support Price (MSP), procurement and buffer stock policy have led to soil degradation, overexploitation of groundwater resources and declining yields. Technology adoption in terms of climate-smart agriculture techniques has also been low and skewed. III.31 Total factor productivity (TFP)10 growth in agriculture plays a central role in sustaining higher agriculture growth (Evenson et al., 1999; Chand et al., 2012). The key propellers of TFP growth are technological innovations driven by R&D and physical and human capital accumulation (Fan et al., 2007). III.32 In India, growth in agriculture GVA is primarily driven by TFP growth, reflecting the lower contribution of factor inputs (Gulati et al., 2020). Average TFP growth in Indian agriculture has, however, been lower than in several other emerging and Asian economies over the last two decades (Chart III.16a). India’s crop yields also lag behind levels achieved by other countries (Chart III.16b). An empirical assessment of the determinants of TFP growth in Indian agriculture for the period from 1981-82 to 2018-19 (latest available data), shows that area under irrigation, rural roads, growth in GCF and cumulative expenditure on R&D are the most significant influences (Box III.3). Box III.3
Determinants of TFP Growth in Indian Agriculture TFP growth in Indian agriculture has been volatile (Chart 1). We examined the drivers of the TFP growth in Indian agriculture, such as growth in GCF (at 2011-12 constant prices), R&D stock (cumulative expenditure in real terms)11, agriculture credit (in reals terms), rural road length, irrigation facility (irrigated area in thousand hectares), rainfall deviation from long period average (LPA) and labour quality. The distribution of certified quality seeds12 (direct outcome) is used as a proxy for R&D expenditure. The results from various alternative formulations (Table 1) show that growth in GCF, distribution of certified quality seeds, research stock, rural road length and irrigated area are positively associated with TFP growth. The results are consistent with the findings of past research (Evenson et al., 1999; Fan et al., 1999; Chand et al., 2012) and recent cross-country studies that focus on the role of capital and technological innovations (Anik et al., 2017; Liu et al., 2020). 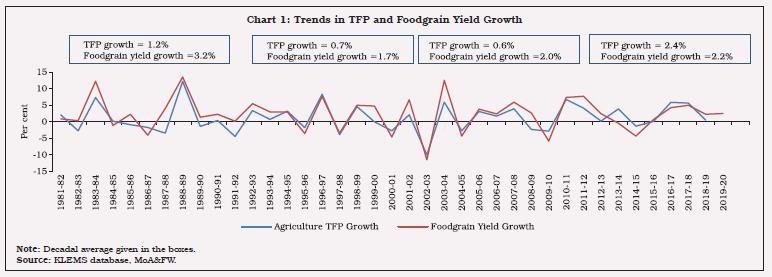
| Table 1: Determinants of TFP growth in Indian Agriculture | | | Model 1 | Model 2 | Model 3 | Model 4 | | Growth in TFP | Growth in TFP | Growth in foodgrain yield | Growth in foodgrain yield | | Growth in Agri-TFP-Lag 1 | -0.233 | -0.269* | | | | | (0.15) | (0.15) | | | | Growth in Agri-TFP-Lag 2 | 0.099 | 0.115 | | | | | (0.12) | (0.13) | | | | Growth in foodgrain yield growth-Lag 1 | | | -0.274* | -0.272* | | | | | (0.15) | (0.15) | | Growth in foodgrain yield growth-Lag 2 | | | -0.085 | -0.035 | | | | | (0.15) | (0.14) | | Growth in Agri-GCF-Lag 2 | 0.048* | 0.030 | 0.084** | 0.059 | | | (0.03) | (0.03) | (0.04) | (0.04) | | Growth in cumulative R&D expenditure | | 0.113* | | 0.153** | | | | (0.06) | | (0.07) | | Growth in distribution of certified quality seeds-Lag 1 | 0.067 | | 0.039 | | | | (0.08) | | (0.13) | | | Growth in GDP per capita-Lag 1 | 0.463 | 0.392 | 0.185 | 0.043 | | | (0.35) | (0.36) | (0.38) | (0.36) | | Growth in Rural roads-Lag 1 | 0.174 | 0.169* | 0.069 | 0.069 | | | (0.10) | (0.09) | (0.14) | (0.13) | | Rainfall deviation from LPA (Dummy) | 0.325 | 0.379 | 0.714 | 0.592 | | | (1.14) | (1.11) | (1.38) | (1.30) | | Growth in irrigated area | 0.991*** | 0.998*** | 1.032*** | 1.092*** | | | (0.21) | (0.19) | (0.24) | (0.22) | | Growth in direct agri-credit-Lag 1 | -0.052 | -0.066 | -0.039 | -0.052 | | | (0.06) | (0.06) | (0.08) | (0.07) | | Growth in labour quality | 2.013 | 2.199 | 20.39 | 17.949 | | | (11.88) | (11.28) | (18.69) | (15.02) | | National Agriculture Policy (Dummy) | -0.603 | 0.194 | -2.23 | -1.104 | | | (1.42) | (1.64) | (2.53) | (2.34) | | Constant | -4.356 | -4.388 | -6.29* | -5.883* | | | (2.63) | (2.55) | (3.53) | (3.36) | | N | 35 | 35 | 35 | 35 | | R square | 0.73 | 0.74 | 0.72 | 0.74 | Notes: Robust Standard errors in parentheses.
*, **, *** represent statistical significance at 10, 5 and 1 per cent, respectively. | References Anik, A. R., S. Rahman, and J.R. Sarker (2017), “Agricultural Productivity Growth and the Role of Capital in South Asia (1980-2013)”, Sustainability, Vol.9, No. 3, pp. 1-24. Chand, R., P. Kumar, and S. Kumar (2012), “Total Factor Productivity and Returns to Public Investment on Agricultural Research in India”, Agricultural Economics Research Review, Vol. 25, No. 2, pp. 181-194. Chauhan, J.S, S.R. Prasad, S. Pal, P.R. Choudary and U.K. Baskar (2016), “Seed Production of Field Crops in India: Quality Assurance, Status, Impact and Way Forward”, Indian Journal of Agricultural Sciences, Vol. 86, No. 5, pp. 563-579. Evenson, R., E. Pray, E. Carl and M.W. Rosegrant (1999), “Agricultural Research and Productivity Growth in India”, Research Report 109, International Food Policy Research Institute, Washington, DC, USA. Fan, S., P. Hazell and S. Thorat (1999), “Linkages between Government Spending, Growth and Poverty in Rural India”, Research Report 110, International Food Policy Research Institute, Washington, DC, USA. Rosegrant, M. W. Liu, J., M. Wang, L. Yang, S. Rahman, and S. Sriboonchitta (2020), “Agricultural Productivity Growth and Its Determinants in South and Southeast Asian Countries”, Sustainability, Vol. 12, No. 12. |
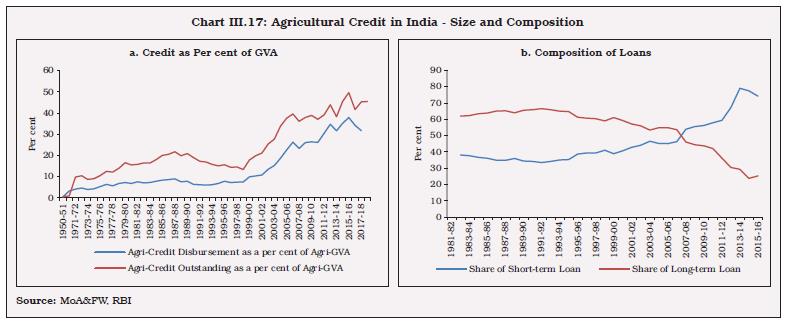 Credit to Agriculture III.33 Credit flows to the A&A sector has stagnated in recent years (Chart III.17). In addition, the inter-state imbalance in usage of agriculture credit is also stark (Chart III.18). Cropping Intensity III.34 There are two broad options to raise production: (1) increasing the Net Sown Area (NSA) under crops, which may be difficult due to the rising demand for land from the non-agriculture sector, and (2) increasing the Gross Sown Area (GSA) by increasing the cropping intensity, which is possible if farmers adopt short-duration crops and investment in irrigation infrastructure is raised by the public and private investors. Another option is to enhance investment in R&D in agriculture to develop newer high-yielding varieties (HYV) in both agriculture and horticulture crops. III.35 As regards NSA, it has declined to 139 million hectares in 2017-18 (latest available data). On the other hand, GSA increased during the period primarily due to higher irrigation facilities and short-duration crops, consequently, the cropping intensity13 has shown a gradual increase. III.36 Irrigation coverage14 has increased from 17 per cent in 1950-51 to nearly 49 per cent in 2017-18 (latest available data). However, despite this positive development, nearly half of the GSA continues to depend on rainfall (Chart III.19). III.37 There has also been a skewed development in the sources of irrigation. In the recent period, the share of tubewells has been increasing significantly, which has posed the challenge of groundwater depletion - a risk to sustainability of growth in the sector (Chart III.20). III.38 Paddy and wheat continue to garner the highest share in the gross irrigated area in the country. The various input subsidies and price incentives through MSP, backed by procurement, allow paddy and wheat this dominating position. (Chart III.21). Farm Input Subsidies III.39 The policy approach to support the farm sector in India has been to subsidise farm inputs such as fertiliser, power, credit, irrigation and insurance in order to increase farm production rapidly by promoting technology adoption (Ellis, 1992; Gulati and Sharma, 1995; Fan et al., 2007; Chand and Kumar, 2004; Gulati and Narayanan, 2003). III.40 The significant share of input subsidies to agriculture has squeezed space for public GCF in agriculture. Though input subsidy as a per cent of agriculture GVA declined from a peak of 15 per cent in 2008-09, public GCF as a per cent of agriculture GVA continues to hover between 2 per cent to 3 per cent in the last two decades (Chart III.22). III.41 Protecting the farmer through crop insurance led to the implementation of the Pradhan Mantri Fasal Bima Yojana (PMFBY) in 2016. Operational across all States and Union Territories, this scheme provided financial insurance to farmers suffering crop loss due to uncertain events. The program assumed significance in a country where rainfed agriculture is predominant and where farmer’s income fluctuated due to other natural calamities such as cyclones and floods. The program functions on a self-selection basis and is voluntary for participation15. The scheme, apart from smoothening farmer’s income over the years has indirectly helped financial institutions by ensuring loan repayment capacity of farmers by insulating them from production risks. The percentage of beneficiaries in the total insurers stands at 31 per cent from 2016-17 to 2019-20 so far, with the highest number of beneficiary farmers being from Maharashtra. 4.2 Industry III.42 As discussed in Section 2, the contribution of the industrial sector to India’s growth has not been adequate relative to its potential. Almost all constituent sectors under industry face challenges that limit their contribution to growth. Mining III.43 India possesses one of the largest reserves of metallic, non-metallic, fuel and minor minerals. It produces as many as 95 minerals, including four fuels, ten metallic, 23 non-metallic, three atomic, and 55 minor minerals (including building and other materials) (GoI, 2021). Accounting for around 2.4 per cent of the real gross value added (GVA)16, mining and quarrying contributes more than 10 per cent of total industry output. | Table III.1: International Trade in Ores and Minerals from 2015-16 to 2019-20 | | (Rupees crore) | | Year | Exports | Imports | Export - Import | Of which | | Petroleum | Natural gas | Imports excluding crude petroleum oil and natural gas | | 2015-16 | 170947 | 738788 | -567841 | 429400 | 43782 | 265606 | | 2016-17 | 200131 | 809445 | -609314 | 474219 | 40249 | 294977 | | 2017-18 | 199469 | 1028529 | -829060 | 563098 | 52366 | 413064 | | 2018-19 | 219168 | 1299186 | -1080018 | 798158 | 73888 | 427140 | | 2019-20 | 189683 | 1151530 | -961847 | 728112 | 68467 | 354951 | | Source: Annual Report 2020-21, Ministry of Mines, Government of India. | III.44 India has the largest coal reserves in the world and is the third largest producer of coal in the world. Indian coal is, however, of low calorific value with high ash content. India is the fourth largest producer of iron ore. The reserve stock of iron (Magnetite) has more than doubled since 2010. Chromite reserves increased by almost 70 per cent and the reserves of Laterite increased by 50.1 per cent. III.45 India is self-reliant in bauxite, chromite and limestone. For magnesite, manganese ore, rock phosphate and lead, India still largely depends on imports for blending with locally available mineral raw materials and/or for manufacturing special quality mineral-based products (Chart III.23). III.46 Starting from 2004-05, however, the share of mining and quarrying in total GVA has reduced almost by half, which appears to be a puzzle in view of natural endowments and high dependence on annual imports (Table III.1) including in a cross-country perspective (Chart III.24). III.47 The output of three fuel minerals, viz. coal, crude oil and natural gas in the eight core industries index is of particular relevance from the viewpoint of the country’s energy security (Chart III.25). Crude oil production is almost stagnant at the levels achieved in the early 1990s and, in fact, has declined over the last 10-years. Natural gas has been witnessing a secular contraction. Crude oil and natural gas production performance largely reflects the ageing of existing fields, sand ingress, and technological limitations of domestic producers. Import dependence in these three critical minerals (for meeting domestic demand) pose significant spillover risks to India from volatility in international prices as well as from global supply chain constraints, as experienced during 2021-22. As new fields become operational by the end of 2022, some ramp up in gas production can be expected. ONGC or major private Indian players can partner with international majors for offshore and ultra-deep sea exploration for oil and gas fields. India has already launched a Deep Ocean Mission 2021-24 with a plan to extract minerals from oceans. Price deregulation or more remunerative returns through better price realisations need to be examined afresh to create an enabling environment for investments to flow in. 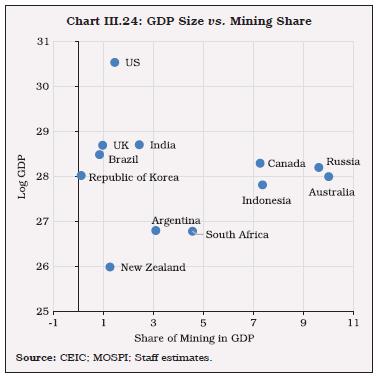 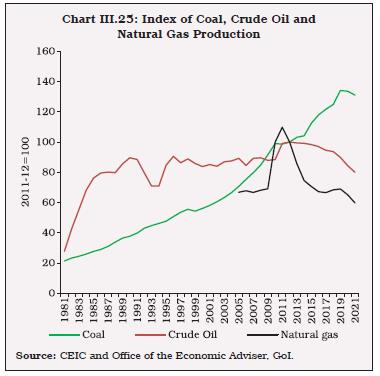 Major Challenges and Policy Options III.48 A large number of small mines (including quarries for extracting minor minerals) and rampant illegal mining complex challenges for sustainable development. The government has taken various steps in recent years, especially in 2021-22, to address these challenges (Annex Table 2). Nevertheless, a comprehensive energy planning strategy is needed so that the country’s commitments to move towards net zero emission and related targets and the changing energy mix are dovetailed into energy security. India has set a target of achieving 40 per cent of electric power installed capacity from non-fossil fuel sources by 2030 in its Nationally Determined Contribution (NDC) under the Paris Agreement. At the ‘Climate Change Conference’ in Glasgow, India committed itself to one of the fastest transitions towards renewable sources that any country has ever undertaken. It will require to raise the country’s non-fossil energy capacity to 500GW by 2030. While complete coal phase out is impractical in the context of India’s energy security, it is clear that incrementally new private investments will flow into renewables to tap more solar energy and to develop grid-level storage for EV batteries network. Manufacturing III.49 Nations seek to raise economic growth through manufacturing because of at least four reasons. First, shifting labour from traditional, low-productivity sectors to higher-productivity manufacturing sector can lift labour productivity (Lewis, 1955; Kaldor, 1966; Chenery et al.,1986). As productivity is higher in manufacturing than in agriculture, transferring resources from agriculture generates a ‘structural bonus.’ Second, manufacturing has the potential for productivity catch-up with the rest of the world that is often unmatched by most services. Arithmetically, this effect could be more significant when employment-intensive manufacturing expands. Third, to the extent that manufactured goods have high income elasticities of demand (higher than those of agricultural products), and are also more likely to be produced under increasing returns to scale, industrialisation sets in motion a virtuous growth cycle (Rosenstein-Rodan, 1943, Murphy et al., 1989). Fourth, as income per capita increases, so does per capita demand for manufactured products. If a developing country does not have a strong manufacturing sector, it may face the risk of perpetual trade deficits (Thirlwall 1979). To cover this deficit, the economy may have to borrow or secure an equally large surplus through trade in non-manufactured goods (e.g., services, minerals, food, etc.). Either of these is challenging for a typical developing country (Felipe, 2018). III.50 In India, GDP and manufacturing display a high degree of co-movement, during the 40-year period from 1980-81 to 2020-21 (Chart III.26). The correlation coefficient between them for this period was found to be high at 0.8. Rolling regressions of manufacturing growth on services growth and vice versa (for a time window of 20-year period) suggest that manufacturing has a positive spillover effect on services growth17 (Chart III.27). In contrast, services coefficients are found to be statistically insignificant, indicating lower backward and forward inter-sectoral linkages of services with manufacturing. Therefore, targeted policy attention to manufacturing is necessary. 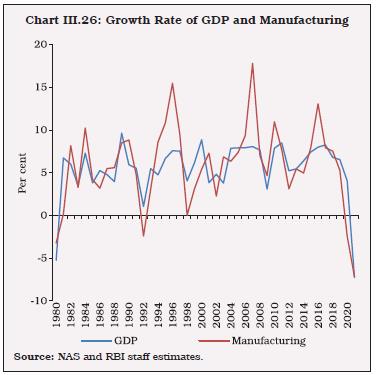 III.51 A decomposition of manufacturing growth between corporate and household sectors reveals that the slowdown is more pronounced in the household sector’s output as also visible in electricity consumption (Chart III.28). An analysis of investment in fixed assets and employment trends from the annual survey of industries (ASI) reveals that the share of the top four sectors, viz., basic metals, coal and refined petroleum, chemical and chemical products and other manufacturing in overall fixed investment is 56 per cent. Many other industries which are either important from an employment generation perspective or for meeting domestic and global demand of industrial goods account for a small share in fixed capital. This highlights the importance of correcting the imbalance with a focus on employment-intensive and export-intensive manufacturing. 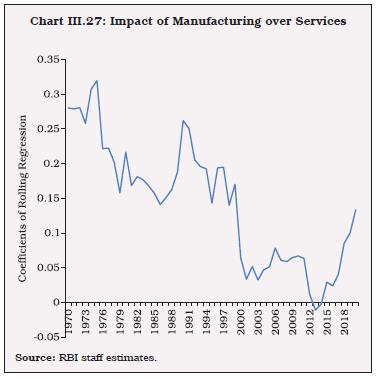 III.52 Food products, textiles and wearing apparel provide around one-third of total employment in the manufacturing sector. Yet, their share in fixed investment has exhibited a sustained decline. Despite a manifold increase in domestic and global demand for computers, electronic and optical products, their share in industrial fixed investment remains low. In fact, in the last two decades, the fixed investment share of this crucial sector in overall industrial investment has shrunk drastically.  III.53 India’s manufacturing investment base is also narrow. A handful of capital intensive industries, metal and petrochemicals, have garnered the lion’s share of physical investment. Since metals and petroleum are highly procyclical and linked to global demand conditions, India is often affected by adverse price movements worldwide. The narrow investment base of manufacturing also reflect the low employment elasticity of the sector and lower labour productivity, leading to loss of competitiveness. III.54 The price of electricity charged to the Indian industry is considerably higher vis-à-vis other countries, which is the result of a policy of cross-subsidization (of agriculture and household consumption), leading to higher input costs in the economy. Electricity tariffs paid by the industry and commercial establishments are almost twice the rate at which it is sold by the electricity generating companies to the distribution companies. These factors act adversely on the overall competitiveness of the industry sector. III.55 Thus, in a nutshell, the industrial sector has witnessed a secular trend of stunted capital formation in not only traditional employment intensive sectors but even in the fast growing sectors, viz., computers and electronics. Importantly, all these sectors faced high demand in both domestic and global markets. Thus, it may be appropriate to conclude that the industrial slowdown in India has not occurred due to downturn in the business cycle, and hence, countercyclical policies alone may not be enough to address the slowdown. Rather it shows a more generalised structural problem, requiring targeted policy interventions. 4.3 Services III.56 Services represent a complex universe of heterogeneous activities. Since 2015-16 services sector growth has been showing a distinct deceleration (Chart III.29). III.57 A sector-wise breakdown reveals that growth slowdown in services is primarily led by construction, financial services, and transport and communication services (Table III.2). The slowdown is stark in transport and communication sub-sectors (Annex Table 3). | Table III.2: A Broad-based Slowdown in Services | | Sectors | 1996-2017 | 2017-2022 | | Services | 7.9 | 4.0 | | Construction | 7.5 | 3.1 | | Trade, hotels, transport, communication and services related to broadcasting | 8.4 | 3.0 | | Financial, real estate & professional services | 7.8 | 4.4 | | Public Administration, defence and other services | 7.6 | 5.8 | | GVA at basic prices | 6.6 | 3.9 | | Source: NAS. | 4.4 Construction III.58 Construction contributes around eight per cent of real GVA. It is critical to the economy for employment generation and creation of a lasting asset base. Around 5.7 crore workers are estimated to be employed directly in construction activity, which has high inter-sectoral backward and forward linkages. Importantly, expenditure on construction related activities contributes almost half of total real gross fixed capital formation (GFCF)18. | Table III.3: Components of Construction - Share in Output (in per cent) | | Year | Dwellings | Non-Residential Buildings | Roads and Bridges | Other Structures and Land Improvements | Plantation | Mineral Exploration | | 2011-12 | 34.3 | 33.5 | 5.4 | 25.4 | 0.1 | 1.3 | | 2020-21 | 20.8 | 34.3 | 8.4 | 35.5 | 0.1 | 1.0 | | Source: RBI Staff estimates based on the NSO data. |
III.59 A bifurcation of construction output reveals that the share of residential construction declined to 20.1 per cent in 2019-20 from 34.3 per cent in 2011-12 (Table III.3). The count of new launches and sales of the residential units (apartments and villas) as surveyed in 10 major cities by Prop Tiger for the past few years has slackened (Chart III.30). III.60 At the same time, the share of non-residential buildings, roads and bridges expanded from 38.9 per cent to 49 per cent. This decomposition reveals that growth retardation in construction primarily emanates from the slowdown in residential construction. The policy-induced push to construction of roads and bridges has not been adequate to compensate for the drag in the residential sector. 5. Structural Growth Enablers 5.1 Infrastructure III.61 Availability of high-class infrastructure enhances the comptetiveness of an economy (Chart III.31). India witnessed impressive growth in several infrastructure sectors such as national highways, seaport capacity, and installed electricity generation capacity. However, expansion of railway tracks has remained relatively subdued (Table III.4).
| Table III.4: Trend of Key Infrastructure Capacity (2011=100) | | Year | National Highways (Kilometers) | Railway tracks* | Cargo handling capacity of ports (MTPA) | Electricity installed capacity (MW) | | 2011 | 100 | 100 | | 100 | | 2012 | 108 | 103 | | 115 | | 2013 | 112 | 102 | | 127 | | 2014 | 129 | 103 | 100 | 140 | | 2015 | 138 | 104 | 109 | 154 | | 2016 | 142 | 106 | 123 | 170 | | 2017 | 161 | 108 | 156 | 182 | | 2018 | 178 | 108 | 163 | 192 | | 2019 | 187 | 110 | 170 | 207 | | 2020 | | 114 | 180 | 215 | *: Running Track Kilometres.
Source: CEIC and Government of India. |
| Table III.5: Share of Infrastructure Sector in Real GVA and GFCF | | (in per cent) | | | Share in GVA | Share in GFCF | | 2011-12 | 8.8 | 17.7 | | 2012-13 | 8.9 | 16.9 | | 2013-14 | 9.0 | 18.3 | | 2014-15 | 9.1 | 14.6 | | 2015-16 | 9.1 | 18.7 | | 2016-17 | 8.9 | 17.6 | | 2017-18 | 8.9 | 19.5 | | 2018-19 | 8.8 | 20.9 | | 2019-20 | 8.8 | 18.9 | | 2020-21 | 8.1 | 17.5 | | Source: NAS. | III. 62 By their nature, infrastructure industries are capital intensive (Table III.5). Their share in aggregate capital formation increased from 17.7 per cent in 2011-12 to above 20 per cent in 2019- 20. During the same period, their contribution to the aggregate GVA remained stagnant at around 9 per cent. This asymmetry indicates that many of these sectors may struggle to generate an operating surplus in a cyclical slowdown. 5.2 Energy III.63 India has a high degree of reliance on imported energy. With renewable energy emerging as an economical alternative to conventional energy resources and the evolution of newer technologies in the transport sector, India’s imported energy dependence could shift to domestic sources in the long run. This could be promoted by rationalising investment in the energy infrastructure. Historically, the emphasis has been more towards generation capacity vis-a-vis transmission and distribution (Table III.6). The focus however needs to gradually shift towards transmission and distribution, with higher participation by the private entities. | Table III.6: Investment in Electricity Infrastructure by the Public Sector | | (₹ crore) | | Year | Generation | Transmission | Distribution | | 2015-16 | 78032 | 39389 | 49970 | | 2016-17 | 57794 | 41932 | 5477 | | 2017-18 | 44370 | 42922 | 16382 | | 2018-19 | 43205 | 39735 | - | | 2019-20 (Prov) | 26658 | - | - | | Source: Annual Reports, Central Electricity Authority. | III.64 A peculiarity of renewable energy is dependence on location and geographical suitability. Hence, renewable energy sources are concentrated in a few states, with adequate sun-lit waste, fallow land and windy areas together accounting for 81 per cent of potential renewable energy capacity (Table III.7). III.65 With rising electricity demand, keeping the cost of power reasonable becomes paramount for long-term growth. Electricity tariffs for businesses are higher in India than in export competitors such as Bangladesh, ASEAN economies, and China (Table III.8). In this context, renewable energy can play a vital role and depress overall tariffs. | Table III.7: State-wise Estimates of Potential for Solar and Wind Energy | | States | Solar | Wind [Wind Power Potential at 120 mtr agl (GW)] | | Andhra Pradesh | 38.44 | 74.90 | | Gujarat | 35.77 | 142.56 | | Karnataka | - | 124.15 | | Madhya Pradesh | 61.66 | 15.40 | | Maharashtra | 64.32 | 98.21 | | Rajasthan | 142.31 | 127.75 | | Tamil Nadu | 17.67 | 68.75 | | Jammu and Kashmir | 111.05 | - | | Uttar Pradesh | 22.83 | - | | Himachal Pradesh | 33.84 | - | | Odisha | 25.78 | - | | Sub-total | 553.67 | 651.72 | | Total | 748.98 | 695.50 | | Source: Annual Report 2019-20, MNRE. |
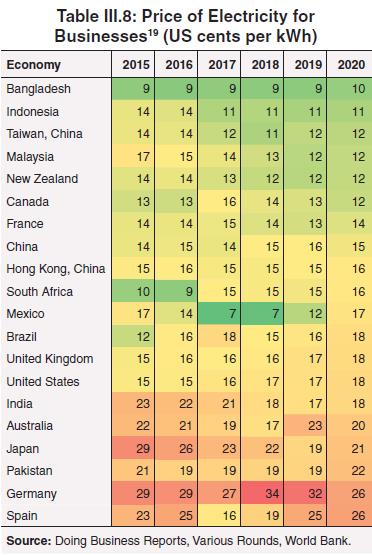 III.66 For lowering the cost of power it is also essential to reform the electricity distribution companies - closing the gap between the average cost of supply (ACS) and average revenue realised (ARR) by DISCOMs (Chart III.32). The aggregate technical and commercial (AT&C) loss or the deadweight loss - the percentage of power procured by a distribution company for which it did not receive any payment remains high. This contrasts with the experience of advanced economies, viz. the UK and the US, where AT&C losses are about 6-7 per cent. III.67 The electricity sector has a complex cross-subsidisation scheme under which high energy-consuming customers from industry and commercial sectors subsidise consumption in agriculture and domestic sectors. Based on the experience gained so far from rationalization of petroleum product subsidies, electricity pricing may also be completely deregulated. Levy of additional taxes/cess after deregulation must be eschewed as it could dilute the intended benefits of reforms. 5.3 Telecommunication III.68 Decrease in number of private telecom players, beside the one operating in the public sector, has led to an oligopolistic market structutre. Further, the industry suffers the burden of high debt. The declining average revenue per user in this segment is noteworthy in this context. 5G and IoT are sources of future economic growth for which a viable and strong telecom industry is a necessity. Limited spectrum availability and low broadband penetration in the country are two other concerns. III.69 There is a need to make India attractive for start-ups like Singapore or UAE by simplifying rules and regulations. According to the Department for Promotion of Industry and Internal Trade (DPIIT), start-ups in India are also employment-intensive. The potential of the start-ups could be harnessed by ensuring sufficient access to funds to the sector, both at the early stage of risk taking and when they scale up, and reducing red-tapes. Delayed enforcement of formal contracts or business agreements impede new investment and may also dampen foreign direct investment. India lags in contract enforcement relative to other emerging countries, affecting ease of doing business (Box III.4). 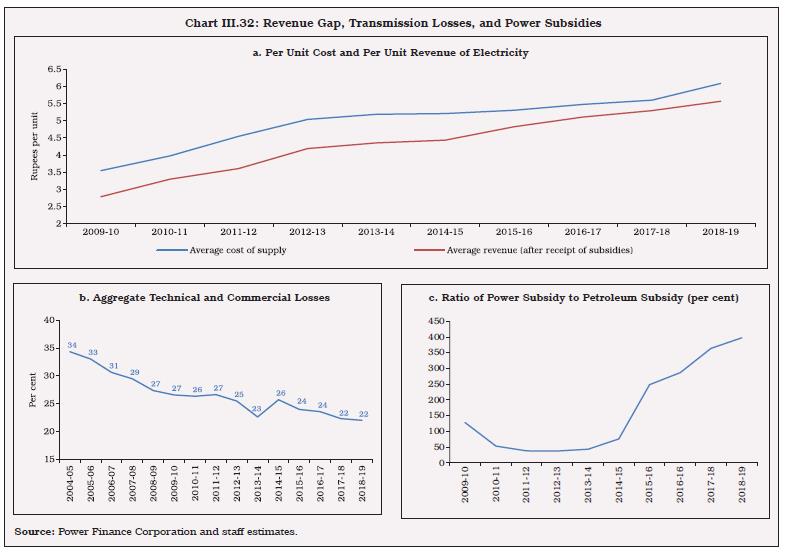 Box III.4
Ease of Doing Business in India and Future Reforms In 2020, India improved its rank to 63rd position from 77th position in 2019 in terms of ease of doing business (EDB) among 190 countries. The broad dimensions of EDB are transaction costs to start and operate a business, regulatory environment, cost of litigation, and tax structure. Based on these dimensions, the ten parameters that are used for assigning the score are dealing with construction permits, getting electricity, getting credit, protecting minority investors, paying taxes, trading across borders, resolving insolvency, enforcing contracts, starting a business, and registration of property. Based on cross-country annual data of 93 countries from 2006 to 2019, a dynamic panel regression shows that improving the EDB rank by one position can increase FDI inflows to GDP by 0.07 percentage points and real GDP growth by 0.006 percentage points (Table 1). | Table 1: Impact of Ease of Doing Business on FDI Inflow and Economic Growth | | Dependent Variables | FDI (% of GDP)it | Real GDP growthit | | FDI (% of GDP) i,t-1 | 0.184*** | | | | (0.0213) | | | Ease of Doing Business Rank it | -0.0696** | | | | (0.0290) | | | Deposit interest rate it | 1.559*** | | | | (0.201) | | | Real GDP growth it | 0.596*** | | | | (0.156) | | | Real GDP growth i,t-1 | | 0.251*** | | | | (0.00292) | | Ease of Doing Business Rank i,t-1 | | -0.00632*** | | | | (0.000541) | | Lending interest rate i,t-1 | | -0.0612*** | | | | (0.00259) | | Constant | -1.694 | 4.050*** | | | (2.352) | (0.0653) | | No. of Observations | 1092 | 1092 | | AR(1) test p-value | 0.0237 | 5.98e-08 | | AR(2) test p-value | 0.280 | 0.0416 | | Hansen test p-value | 0.868 | 0.858 | | Standard errors are in parentheses. * p < 0.1, ** p < 0.05, *** p < 0.01 | India has taken several steps to improve the ease of doing business. -
The “Enforcing Contracts Portal” launched on June 29, 2021 aims to promote ease of doing business and improve the contract enforcement regime’ in the country. This will provide easy access to latest commercial cases in the Dedicated Commercial Courts of Delhi, Mumbai, Bengaluru and Kolkata. -
The universal portal, Maadhyam, a National Single Window System (NSWS) to identify and apply for various approvals required to commence a business in India, will further help investors use central government licenses/ approvals by filling a common registration form. The Maadhyam portal is also integrated with the State Single Window System (SWS) of all the participating states. References Adepoju, U. (2017). Ease of doing business and economic growth. Vogiatzoglou, K. (2016). Ease of doing business and FDI inflows in ASEAN. Journal of Southeast Asian Economies, 343–363. | 5.5 Education III.70 Globally, efforts towards educating children suffered a major setback during the pandemic by making more than 100 million additional children fall below minimum reading proficiency levels in 202020. In India, concerted efforts are required to make further progress, with a focus on skill augmentation/upgradation (Chart III.33). III.71 It is important to recognise that rising literacy rates alone may not ensure the desired learning outcomes. Survey based results (ASER 2018) show deficiencies in quality of learning in elementary schools. The gap is also visible from the level of India’s gross enrollment ratio in higher education relative to the developed and developing nations (Chart III.34). 5.6 Health III.72 The pandemic has brought to the fore the defiencies in the Indian healthcare system, particularly the poor state of the healthcare infrastructure, falling short on most of the WHO standards (Chart III.35). This has been the result of meagre public expenditure (1.26 per cent of GDP) incurred on health in India over successive decades. III.73 Close to 75 per cent of outpatient care and 65 per cent of in-hospital care in India is provided in the private sector. India also has one of the highest levels of out of pocket expenditure (OOPE) incurred by patients among countries – highlighting the limited support from public expenditure and insurance. The private sector may have little incentives to invest in rural/semi urban areas where the gaps in healthcare infrastructure is more alarming. III.74 Recognising glaring gaps in India’s healthcare infrastructure, the government put in place a policy framework with targeted measures for implementation over the medium-term. This is set out in the national infrastructure pipeline (NIP) policy for the healthcare sector (Table III.9). 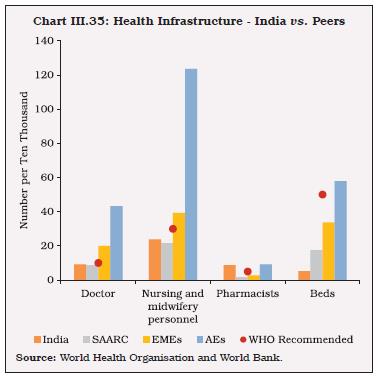
| Table III.9: Vision 2025 for the Healthcare Sector | | | Current Status | Vision 2025 | | Health care Spending | • 1.28 per cent of GDP
• Per capita spending - $63 | 2.5 per cent of GDP | | Immunisation | Only 62 per cent children between ages 12 and 23 months are fully immunised | Mission Indradhanush Objectives to be achieved
• 90 per cent immunisation | | Healthcare and diagnostic | Expensive due to import dependence on medical devices and diagnostic equipment | Need to scale up India’s medical devices and diagnostic equipment manufacturing under “Make in India” initiative | | Health care professionals and Human resources | Shortage of well qualified doctors and support healthcare staff owing to insufficient medical colleges in the country
• Pupil teacher ratio – 24
• College per lakh population - 28
• Medical colleges - 476 | • New Medical Colleges in PPP basis
• Overall an estimated capital expenditure of ₹1,51,019 crore would be made by both central and states governments over fiscals 2020- 2025. | | Source: NIP and Niti Aayog. | 6. Factor Market Impediments 6.1 Land III.75 Agriculture has a disproportionately high share in land available for use in economic activity, despite being the least productive (Table III.10). Access to land is intimately tied to protecting property rights, and by extension, expropriation procedures (OECD, 2015). Domestic legal frameworks must provide clarity on compensation to land owners in the event of expropriation and also set out the public benefit purposes for which an expropriation can lawfully occur for attracting long-term investment, including in infrastructure and industrial zones. III.76 Since independence, India has enacted more than a hundred land acquisition laws (Yoshino et al., 2018), including central and state laws which contain provisions for land acquisition, viz., the Forest Act 1927, the Railways Act 1989, Electricity Act 2003, and the Special Economic Zones Act, 2005 etc. Post-1991, land acquisition by the government for industrial use by the private sector increased significantly, leading to episodes of discontent among the public. Therefore, the Land Acquisition Act (LAA) 1894 was replaced by the Right to Fair Compensation and Transparency in Land Acquisition, Rehabilitation and Resettlement Act, 2013. The usefulness of the present Act, however, has been questioned by several stakeholders, stating that it may stall land acquisition by making the cost of land prohibitive for industry and the procedures more cumbersome (Yoshino et.al., 2018). An effort to change this law in 2015 was not successful, and the state governments were advised to frame their own land acquisition laws. Gujarat, Rajasthan, Maharashtra, Jharkhand, and Telangana have enacted new laws. Gujarat and Telangana have exempted a long list of projects from social impact assessment (SIA) and mandatory consent of landowners. They include projects of national security, defence, rural infrastructure, affordable housing, industrial corridors, and other infrastructural projects, including projects under public-private partnerships (PPPs). In Maharashtra, PPP projects have been fully exempted from the SIA and consent clauses. Telangana, Uttar Pradesh and Andhra Pradesh have reduced the notice period for public hearings under SIA from three weeks to one week. In Jharkhand, for instance, the quorum for seeking consent from the gram sabha has been reduced from half to one-third. For parity and distributional justice, however, India needs to explore laws for land pooling (Yoshino, Paul, Sarma, and Lakhia, 2018). | Table III.10: Sector-wise Labour Productivity | | Sector | Number of employees (in thousands) | Real GVA (₹ crore) | GVA per worker (in Rupees) | Labour productivity relative to the national average (%) | | Agriculture | 196306 | 18,87,145 | 96133 | 36 | | Industry | 57120 | 29,51,076 | 516645 | 193 | | Manufacturing | 53124 | 23,26,067 | 437852 | 163 | | Services | 222448 | 79,05,981 | 355408 | 133 | | Total | 475874 | 127,44,203 | 267806 | 100 | | Source: India KLEMS 2018-19. | III.77 According to the Ministry of Statistics and Programme Implementation data, the number of stalled projects has increased sharply since 2018 for projects above ₹150 crore of investment (Chart III.36). III.78 Since 2018, the share of stalled projects in the railway sector has increased significantly (from 11 per cent in 2018 to around 25 per cent in 2019). The average cost overrun per project shows an increasing trend, touching a high of 31 per cent of the original cost in 2020 (Chart III.37). 6.2 Labour III.79 Favourable demographies and the large pool of excess labour absorbed into agriculture require industry friendly labour reforms to harness their potential as growth drivers of the future. Over the years, recommendations of various Committees on labour such as the First National Commission on Labour (1969), National Commission on Rural Labour (1991), National Commission on Labour (2002) and National Commission for Enterprises in the Unorganised sector (2009) have shaped existing labour laws. As a concurrent list subject, both the Central and State Governments have powers to make labour legislations. In 2019, the Ministry of Labour introduced four labour bills to consolidate the existing 29 labour laws. These bills relate to (1) industrial relations; (2) minimum wages; (3) social security; and (4) occupational safety, health and working conditions. All labour codes have been passed by the Parliament and will be implemented from the fiscal year 2022-23. 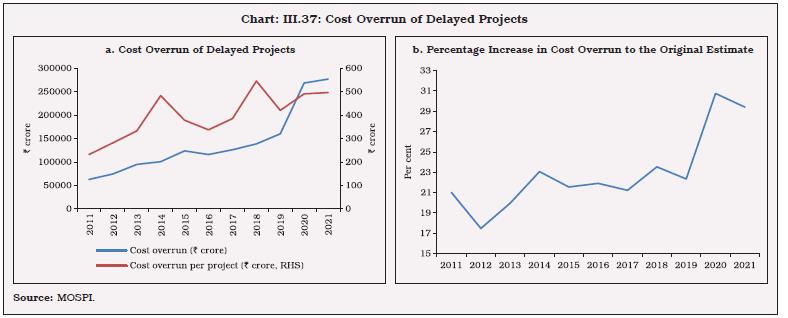 III.80 The code on minimum wages ensure that the employers pay minimum wages to their employees. The industrial relations code provides that if a firm employed more than 100 employees at any point of time in the past 12 months, it must constitute a works committee comprising members from both the employer and employees with the responsibility of nurturing amicable relationship between the employer and employees. Firms employing more than 20 workers need to have more than one grievance redressal committees to resolve issues of individual employees. III.81 The labour code on social security envisages strengthening social security for labour through employees’ provident fund, state insurance corporations, medical benefit committee, and the national social security board that will recommend schemes to unorganised workers. The code on occupational safety, health and working conditions requires every employer to ensure that the occupational place is free of hazards. III.82 Apart from benefiting the workers, these labor codes may also be beneficial for industry. The inclusion of fixed term employment will provide flexibility to firms to hire workers according to the changing economic environment. At the same time, these codes may streamline the process of settlement of labor disputes; envisage a time bound and hassle free resolution of labor disputes; create enabling conditions for collective bargaining between the firm and workers; and simplify the process of labor administration (filling of one return, one license and one registration). Collectively these reforms, when implemented, will improve flexibility in India’s labor markets. 6.2.1 Labour Participation III.83 As per the Periodic Labour Force Survey (PLFS), around 42 per cent of the population forms the labour force. India has one of the lowest Labour Force Participation Rate (LFPR) among the major economies, partly due to very low female LFPR (22 per cent) (WDI, World Bank), especially among poorer states (Chart III.38). III.84 The prevalence of high informal employment is a major challenge with 71 per cent of the total employed labour force being ‘self-employed’ (Chart III.39). Seventy seven per cent of the self employed enterprises are small enterprises with less than six workers. III.85 Seventy nine per cent of the working population do not have a written job contract in their usual principal activity (Chart III.40). III.86 Seventy eight per cent of the working population in India have not received any type of job training (PLFS, 2019-20) (Chart III.41). III.87 Twenty eight per cent of the population is illiterate and another 26 per cent have received only primary school education (PLFS, 2019-20). Only nine per cent of the population possesses a graduate/post graduate degree in India (Chart III.42). 7. Conclusion III.88 The Indian economy was riddled with several structural impediments to growth even before the outbreak of COVID-19 which had dampened the investment outlook. COVID induced supply disruptions and potential hyteresis effects have imposed testing challenges. Addressing these structural constraints has become central to reviving and reconstructing the Indian economy from the ravages of the pandemic. III.89 The agriculture sector suffers from low capital formation, declining R&D, low crop yields, inadequate crop diversity and intensity, with excessive dependence on subsidies and price support schemes. India’s dependence on imports of minerals, depleted natural endowment is another drag. In manufacturing, a few capital-intensive industries have garnered the lion’s share of physical investment, whereas the investment share of employment generating industries and high-demand electronics and computer industries has either stagnated or contracted over the years. In the service sector, growth slowdown was primarily led by construction, financial services, and transport and communication services, due to prevalence of many sector-specific problems as discussed in this chapter. III.90 Recognising the need for urgent and bold structural reforms, the Government has announced privatisation and asset monetisation; tax reforms (GST and corporate tax rationalisation); targeted sector-specific incentives to raise production and exports under the production linked incentive (PLI) scheme; insolvency and bankruptcy code (IBC) to improve the credit culture and resource allocation mechanism; labour reforms (four codes); and a fiscal policy focus on capex and infrastructure. III.91 These reforms need to be augmented by other measures to reverse the sustained decline in private investment and low productivity in the economy. What is needed include access to litigation free low cost land; raising the quality of labour through large scale expansion of public expenditure on education and health and the skill India mission; reducing the cost of capital for industry and improve resource allocation in the economy by promoting competition; encouraging industries and corporates to scale up R&D activities with an emphasis on innovation and technology; creating an enabling environment for startups and unicorns; encouraging corporate investment in agriculture; addressing the challenges faced by the debt-ridden telecom industry and DISCOMs; rationalisation of subsidies that promote inefficiencies; encouraging urban agglomerations by improving the housing and physical infrastructure. III.92 While aiming to boost India’s participation in global value chains (GVCs) and raise export competitiveness, greater adoption of technology assumes critical importance. The reform package of the future hinges around (i) an ecosystem that increases the adaptability of domestic firms to state-of-the-art technology; (ii) ensuring policy certainty on royalty payments for technology transfer by foreign companies; (iii) improving domestic R&D infrastructure for innovations. The industrial revolution 4.0 and committed transition to net zero emission target will create new investment opportunities requiring greater policy emphasis on technology and green financing. The next wave of global structural transformation is likely to be powered by both technology and environmentally sustainable production processes. III.93 A comprehensive plan is necessary to revive the rural economy of the country alongside the existing several other policy measures (Annex - I). Organising farmers’ clubs or agricultural cooperatives is a possible solution to correct the pricing imbalances by reducing gaps between farm gate prices and retail prices. In this regard, the development of a modern supply chain infrastructure needs priority attention. III.94 Farmers are still dependent on money lenders. There is a need to adopt a viable ‘whole of business’ approach covering all aspects of farming. Developing numerous small-scale irrigation projects as well as using wind energy to lift water from bore wells as implemented in many western African countries can be replicated in India’s drought prone areas. India is one of the most vulnerable countries to extreme weather events in the world21. According to the India Meteorological Department, the occurrence of extreme weather events like floods, cyclones, heat waves and droughts has increased in both frequency and intensity. Furthermore, the average temperature has increased by 1.8 degrees Celsius between 1997 and 2019 as against an increase of 0.5 degrees Celsius between 1901 and 2000. Similarly, the fall in groundwater level in Punjab, Haryana and Madhya Pradesh has exceeded the annual recharging levels. III.95 Apart from measures already taken (Annex Table 3), the production linked incentives (PLI) scheme recognises growth opportunities in 14 key manufacturing sectors of the economy. The incentives, however, effectively compensate industries for domestic structural impediments (ranging from access to litigation free land, high cost of electricity tariff, inefficient domestic supply chain, high cost of logistics and settlement disputes). Unless the structural impediments are addressed, these reforms may become unsustainable. Building on “Start-up India, Stand-up India”, the policy ecosystem for the startups needs a dynamic framework with provision for adequate access to risk capital and globally competitive environment for doing business. The textile industry has a special place in the Indian industrial landscape owing to its labour intensive nature, particularly employment of women in the sector. For enhancing female labour participation and the associated scope to raise output, greater support to the textile sector is necessary. III.96 The National Infrastructure Pipeline (NIP) through public-private partnerships would require a strategy for meeting the financing requirement, given limited domestic financial savings and sustainable levels of capital flows. III.97 Labour reform with flexibility to hire and fire workers can allow firms to adjust their workforce according to economic cycles, thereby enabling them to use their resources more efficiently. This, however, could come only at the cost of lower welfare/social security of the workers. One option here could be to build an unemployment insurance fund during periods of economic boom at the firm level, which can be utilized to financially support workers up to a limited period after retrenchment. Further, many of the social security measures apply to firms having a certain minimum number of workers, which creates incentives for firms to not scale up. To address this issue, a policy option could be universal access to social security irrespective of firm size, with each firm required to earmark a certain percentage of their profit for the social security schemes for the workers. References Akber, N. and K. R. Paltasingh (2019), “Investment, Subsidy and Productivity in Indian Agriculture: An Empirical Analysis”, Agricultural Economics Research Review, Vol. 32, No. 3, pp. 13-25. Alfaro, L. and A. Chari (2014), “Deregulation, Misallocation, and Size: Evidence from India”, The Journal of Law and Economics, Vol. 57, No. 4, pp. 897-936. Alvarez, F., F. Buera and R. Lucas, Jr. (2013), “Idea Flows, Economic Growth and Trade”, NBER Working Paper Series, No. 19667. Arnold, J.M. and Grundke, R. (2021), “Raising productivity through structural reform in Brazil”, OECD Library. Annual Status of Education Report (ASER), 2018. Banerjee, A. V. (2006), “The Paradox of Indian growth: A Comment on Kochhar et al.”, Journal of Monetary Economics, Vol. 53, No. 5, pp. 1021- 1026. Bathla, S. (2014), “Public and Private Capital Formation and Agricultural Growth in India: State level Analysis of Inter-linkages During Pre- and Post-reform Periods”, Agricultural Economics Research Review, Vol. 27, No. 1, pp. 19-36. Chand, R., P. Kumar, and S. Kumar (2012), “Total Factor Productivity and Returns to Public Investment on Agricultural Research in India”, Agricultural Economics Research Review, Vol. 25, No. 2, pp. 181-194. Chand, R. and P. Kumar (2004), “Determinants of Capital Formation and Agriculture Growth: Some New Explorations”, Economic and Political Weekly, Vo. 39, No. 52, pp. 5611-5616. Chenery, H.B., S. Robinson, M. Syrquin and S. Feder (1986), Industrialization and growth, New York: Oxford University Press, pp. 175. Dieppe, A (2021), “Global Productivity: Trends, Drivers, and Policies’, Washington, DC: World Bank. Ellis, F. (1992), “Agricultural Policies in Developing Countries”, Cambridge University Press. Evenson, R., E. Pray, E. Carl and M. W. Rosegrant (1999), “Agricultural Research and Productivity Growth in India”, Vol. 109, International Food Policy Research Institute, Washington, DC, USA. Fan, S., A. Gulati and S. Thorat (2007), “Investment, Subsidies and Pro-poor Growth in Rural India”, IFPRI Discussion Paper, International Food Policy Research Institute, Vol. 716. Felipe, J. (2018), “Asia’s Industrial Transformation: the Role of Manufacturing and Global Value Chains (Part 1)”, Asian Development Bank Economics Working Paper Series, Vol. 549. Ghate, C., G. Glomm and J. L. Streeter (2016), “Sectoral Infrastructure Investments in an Unbalanced Growing Economy: The Case of Potential Growth in India”, Asian Development Review, Vol. 33, No. 2, pp. 144-166. Ghate, C. and D. Mazumder (2019), “Employment Targeting in a Frictional Labor Market”, Indian Growth and Development Review. Government of India (2020), Economic Survey. Gupta, P. and U. Kumar (2012), “Performance of Indian Manufacturing in the Post-Reform Period”, Chapter 8. In C. Ghate, ed. The Oxford Handbook of the Indian Economy, pp. 276–310, New York: Oxford University Press. Griffith, R., S. Redding and J. V. Reenen (2004), “Mapping the Two Faces of RandD: Productivity Growth in a Panel of OECD Industries”, The Review of Economics and Statistics, Vol. 86, No. 4, pp. 883-895. Gulati, A. and S. Narayanan (2003), “The Subsidy Syndrome in Indian Agriculture”, Oxford University Press, Oxford. Gulati, A. and A. Sharma (1995), “Subsidy Syndrome in Indian Agriculture”, Economic and Political Weekly, Vol. 30, No. 39, pp. A93-A102. Gulati, S, U. Saksena, A. K. Shukla, V. Dhanya, and T. Sonna (2020), “Trends and Dynamics of Productivity in India: Sectoral Analysis”, Reserve Bank of India Occasional Papers, Vol. 41, No. 1, pp. 77-108. Herrendorf, B. and R. Rogerson (2014), “Growth and Structural Transformation” Chapter 6, Handbook of Economic Growth, Vol. 2. Hsieh, C. T. and P. J. Klenow (2009), “Misallocation and Manufacturing TFP in China and India”, The Quarterly journal of economics, Vol. 124, No. 4, pp.1403-1448. Kaldor, N. (1966), “Marginal productivity and the macro-economic theories of distribution: Comment on Samuelson and Modigliani”, The Review of Economic Studies, Vol. 33, No. 4, pp. 309-319. Lewis, W.A. (1955), “The Theory of Economic Growth”, London: George Allen and Unwin Ltd. McMillan, M. and D. Rodrik (2011), “Globalization, Structural Shange and Productivity Growth”, Ch.2, Making Globlisation Socially Sustainable, ILO. Melitz, M., and D. Trefler (2012), “Gains from Trade When Firms Matter”, Journal of Economic Perspectives, Vol. 26(2), pp. 91-118. Munshi, K., and M. Rosenzweig (2009), “Why is Mobility in India so Low? Social Insurance, Inequality. and Growth”, Working papers, Brown University, Department of Economics. Murphy, K.M., A. Shleifer and R.W., Vishny (1989), “Industrialization and The Big Push”, Journal of Political Economy, Vol. 97, No. 5, pp.1003-1026. OECD (2015), “The Future of Productivity”, OECD, Paris. Parente, S.L. and Edward.C. Prescott (1999), “Monopoly Rights: A Barrier to Riches”, American Economic Review, Vol. 89, No.5, pp.1216-1233. Herrendorf, B and A. Teixeira (2004), “Monopoly Rights and Cross-Country TFP”, 2004 Meeting Papers, No. 17, Society for Economic Dynamics. Panagariya, A. (2008), “India: The Emerging Giant”, Oxford University Press. Rosenstein-Rodan, P.N. (1943), “Problems of Industrialisation of Eastern and South-Eastern Europe”, The Economic Journal, Vol. 53, pp. 202- 211. Saia, A., D. Andrews and S. Albrizio (2015), “Public Policy and Spillovers From the Global Productivity Frontier: Industry Level Evidence”, OECD Economics Department Working Papers, No. 1238. Schumpeter, J.A. (1939), “Business Cycles”, Vol. 1, pp. 161-174 New York: Mcgraw-hill. Subramanian, A. and J. Felman (2019), “India’s Great Slowdown: What Happened? What’s the Way Out?”, CID Working Paper Series. Thirlwall, A.P. (1979), “The Balance of Payments Constraint as an Explanation of International Growth Rate Differences”, BNL Quarterly Review, Vol. 32, No. 128, pp.45-53. United Nations Industrial Development Organization (UNIDO), (2009), “Breaking In and Moving Up: New Industrial Challenges for the Bottom Billion and the Middle-Income Countries”. United Nations Industrial Development Organization, (2017), Annual Report. Yoshino, N., P. Saumik, V. Sarma, and S. Lakhia (2018), “Land Acquisition and Infrastructure Development through Land Trust Laws: A Policy Framework for Asia”, ADBI Working Paper No. 854, Asian Development Bank Institute, Japan.
Annex – I: List of Measures for Agriculture • The Ministry of Agriculture and Farmers Welfare, Government of India and the Indian Council of Agricultural Research (ICAR), launched a network project 'National Innovations in Climate Resilient Agriculture' (NICRA) in 2011. The project aims at strategic research on adaptation and mitigation; demonstration of technologies on farmers' fields; and creating awareness among farmers and other stakeholders to minimise the climatic change impacts on agriculture. The main thrust areas covered for strategic research are (i) identifying the most vulnerable districts/regions; (ii) evolving crop varieties and management practices for adaptation and mitigation; and (iii) assessing climate change impact on livestock, fisheries and poultry and identifying adaptation strategies. So far, seven climate resilient varieties and 650 district agricultural contingency plans have been developed besides assessing the risk and vulnerability of Indian agriculture to climate change. Location specific technologies have been demonstrated in 151 climatically vulnerable districts. State-of-the-art infrastructure facilities have been established by ICAR in the National Agricultural Research and Education System (NARES) across the country to facilitate climate change research. Unique infrastructure facilities viz. High Throughput Plant Phenomics, Free Air Temperature Enrichment Facility (FATE), Free Air CO2 Enrichment Facility (FACE), CO2 Temperature Gradient Chambers (CTGC), Gas Chromatography, Atomic Absorption Spectrophotometers, Environmental Growth Chamber, UV-VIS Spectrophotometer, Thermal imaging system, Psychrometric chambers etc. have been established at various ICAR institutes to facilitate the climate change research. The construction and operation of psychometric chambers have been undertaken for studying the effect of different environmental conditions viz., temperature, humidity, and air movement on livestock, with special reference to cattle and buffaloes, environmental growth chambers with CO2 and temperature controls and a special calorimetric system to study livestock response to heat stress. Custom hiring centres (CHCs) have been established in 121 NICRA villages to ensure the availability of farm implements for timely operations. • The National Agricultural Research System (NARS) under the aegis of Indian Council of Agricultural Research (ICAR) comprising of ICAR Institutes and State/Central Agricultural Universities are involved in the development of new high yielding and biotic/abiotic stress tolerant crop varieties of field and horticultural crops. During the last 3 years (2018-2020) and in the current year, 1,017 new varieties of 69 field crops and 206 varieties of 58 horticultural crops have been developed. • The Government of India has been promoting organic farming through dedicated schemes of Paramparagat Krishi Vikas Yojana (PKVY) and Mission Organic Value Chain Development in the North East Region (MOVCDNER). Farmers are provided financial assistance (₹31000/ ha / 3 years in PKVY and ₹32500/ ha/ 3years under MOVCDNER) for organic inputs including seeds, bio-fertilisers, bio-pesticides, organic manure, compost/vermicompost and botanical extracts. In addition, support is also provided for group/ Farmers Producers Organization (FPO) formation, training, certification, value addition and marketing of their organic produce. Organic cultivation on either side of the River Ganga, natural farming, large area certification and support for individual farmers have also been introduced under PKVY to increase organic production. • Burning of Crop residue leading to higher air pollution and health hazards has been a contentious issue within/between the States. The 'Pusa Decomposer Technology' is a new low-cost capsule technology developed by the ICAR - Indian Agriculture Research Institute (IARI), New Delhi for crop residue management. In coordination with the State Governments, the Government of India has made multiple efforts to demonstrate this technology for crop residue management across the country. During 2020-21, the Pusa Decomposer was provided for 5730 ha area comprising of Uttar Pradesh (3700 ha), Punjab (200 ha), Delhi (800 ha), West Bengal (510 ha), Telangana (100 ha); Confederation of Indian Industry (100 ha) and NGO and Farmers (320 ha). In-situ application of Pusa decomposer on paddy residue was demonstrated at farmers' fields in several villages of Punjab and Haryana. A slogan of ';jalana nahi, galana hai'; was publicised among the farmers. In addition, regular interactive sessions with farmers through online meetings, Webinars, and messaging Apps have been conducted to make them aware of this technology and to wean them away from burning. The IARI has licensed this technology to 12 companies for mass multiplication and marketing of the Pusa Decomposer. In addition, ICAR – IARI has produced about 20000 packets of Pusa decomposer at its facility for use by the farmers. • The Government of India has made a provision for the opening of one Krishi Vigyan Kendra (KVK) in each of the rural districts across the country. A total of 725 KVKs have been established across the country to date. The KVKs are mandated for frontline extension which act as a bridge between research organisations and the main extension system operated by different development departments of the State Governments. Considering the role and resources of a KVK, it caters to the requirement of the selected farmers of the district and provides capacity development support to State Development Departments. • The Government of India has launched the Agriculture Infrastructure Fund (AIF) scheme to mobilise a medium - long term debt financing facility for investment in viable projects for post-harvest management (PHM) Infrastructure and community farming assets (CFAs) through incentives and financial support to improve agriculture infrastructure in the country. This financing facility will also help APMCs to upgrade their Infrastructure, which will ultimately benefit the farmers. The scheme provides financial assistance in interest subvention and credit guarantee for setting PHM projects, which will help better post-harvest management and reduce wastage. Further, the following CFA projects are eligible under the scheme: (1) Organic inputs production, (2) Biostimulant production units, (3) Infrastructure for smart and precision agriculture, (4) Projects identified for providing supply chain infrastructure for clusters of crops including export clusters, (5) Projects promoted by Central/State/Local Governments or their agencies under Public- Private Partnerships (PPP) for building CFAs or PHM projects. Greenhouse gas emissions and the associated climate change risks pose new concerns for the sector which include lower yields, weed and pest proliferation and large crop losses, the frequency of which could even endanger national food security. | Annex Table 1: Major Policy Reforms in the Agriculture and Allied Sectors | | Policy | Objective | Expected Outcome | | Agriculture Infrastructure Fund | For financing infrastructure at the farm gate as well as at other aggregation points of agricultural produce. | Better management and realization of remunerative prices for agricultural produce. Reduction of post-harvest loss and middlemen network. | | Scheme for Formalisation of Micro Food Enterprises (MFEs) | Improving quality standards and production practices of MFEs. | Increased marketing opportunities for the MFE units leading to higher growth. | | Pradhan Mantri Fasal Bima Yojana (PMFBY) | To provide protection to farmers through crop insurance. | Smoothen farmers’ income over the years. Indirectly helps the financial institutions by ensuring the loan repayment capacity of farmers. | | The Digital India Land Records Modernisation Programme | To build an all-encompassing and transparent land record management system. | Help farmers and small business men access finance from formal financial institutions using proper land titles. Multiplier effect on growth. | | Kisan Rail Services (KRS) | To reduce time taken to transport the perishable agricultural produce from the production centres to consumption centres and to keep them fresh for a longer time through cold storage transport. | Increases the marketing opportunities available to farmers though quality and less expensive transportation of agricultural produce. | | Animal Husbandry Infrastructure Development Fund (AHIDF) | Incentivize the investment in dairy production and processing industries, and meat production and processing industries in rural areas of the country. | Will provide integrated market for the unorganised producers of meat and milk and ensure quality products for the consumers. Stabilize the prices of these products through the integrated production, processing and marketing. | | Blue revolution | To increase fish production, productivity and creation of adequate infrastructure. | Better employment and income prospects in the fisheries sector. | | Fisheries and Aquaculture Infrastructure Development Fund (FIDF) | Development of infrastructure in the fisheries sector. | Better employment and income prospects in the fisheries sector. | | Pradhan Mantri Matsya Sampada Yojana (PMMSY) | To enhance the fisheries sector production. | Higher production and productivity in the fisheries sector. | | Agriculture Export Policy (AEP) | Promotion of export-oriented production with focus on exportable crops. | Farmers get benefit of export opportunities in overseas markets. | | Mission for Integrated Development of Horticulture (MIDH) | Capacity building of farmers and technicians. | Holistic growth of the horticulture sector. | | Horticulture Cluster Development Programme (HCDP) | Address the concerns of the horticulture value chain. Reduce harvest and post-harvest losses. introduction of innovative technologies and practices. Build the capacity of stakeholders. | Geographical specialisation of horticulture clusters making them globally competitive. |
| Annex Table 2: Major Policy Reforms in the Industrial Sectors | | Policy | Objective | Expected Outcome | | National Steel Policy | To attain self-sufficiency in steel production and to make India a net exporter of steel by 2025-26. | Higher economic growth by exploiting the competitive advantage in steel production. | | National Mineral Policy | To increase transparency, better regulation and enforcement, balanced social and economic growth and promotion of sustainable mining practices. | Sustainable mining sector development. Addresses the concerns of persons affected by mining. | | Mineral (Auction) Second Amendment Rules, 2021 and the Minerals (Evidence of Mineral Contents) Amendment Rules, 2021 | End captive mining. | More participation in the mining industry and a healthy and competitive bidding process in the mining industry. | | Amendments in the Mines and Minerals (Development and Regulation) (MMDR) Act | Improve transparency and efficiency in the management of coals through commercial auctions. | Bridge the gap between domestic demand and supply of coal. Boost production in other sectors such as steel, aluminium, fertilizer and cement. | | Oil Sector - Hydrocarbon Exploration and Licensing Policy (HELP) | To bring more transparency in the oil sector licensing procedures. | Higher production and contribution to economic growth in the long run. | | Oil Sector - Open Acreage Licensing policy (OALP) | Incentivises companies to take up oil exploration. Freedom for companies to carve out own areas for exploration and declare it to the GoI at any time of the year. | Increase in the acreage under oil exploration leading to higher production. | | Petroleum and natural gas industry - Gas Pricing Reforms | Move towards uniform pipeline pricing. | Would stop the pricing discrimination based on the distance from the production locations. | | Integrated Power Development Scheme (IPDS) | Strengthen the transmission and distribution networks, IT-enabling of the distribution network for all statutory towns, additional incentives for performing UDAY states, solar panels on government buildings, and schemes for enterprise resource planning (ERP), among others. | Increase the customer satisfaction and improve the reliability of power supply. | | National Renewable Energy Policy (NREP) | Produce more electricity through renewable energy sources. | Higher electricity production. Higher economic growth in the long run. | | MSME reforms - Emergency credit line, subordinated debt for stressed MSMEs, MSME funds of funds for equity infusion. | Support the growth momentum in the sector. | Higher growth in the long run. | | Revised the definition of MSME’s investment limit. | To address the concern of many successful MSMEs to grow more regarding the loss of special status and incentives. | Suports MSME growth. | | MSME Sector - Disallowed global tenders up to ₹200 crores | To provide a boost to the MSME sector. | Higher marketing opportunities for the sector | | E-market linkage for MSMEs | Higher marketing opportunities. | Higher income | | The enhancement of minimum threshold for initiation of insolvency proceedings under the Insolvency and Bankruptcy Codes (IBC) from ₹1 lakh to ₹1 crore. | Beneficial to most of the MSMEs as they would fall below this threshold. | Higher and sustainable growth in the MSME sector. | | The integrated textile parks | Set up infrastructure of international standard in the sector. | Attract foreign investment. | | SAMARTH (Scheme for Capacity Building in Textile sector). | Skill development in the sector | Higher growth in the long run. | | “Start-up India, Stand-up India” | To encourage start-ups in India | Higher growth in the long run. | | Start-ups Intellectual Property Protection (SIPP) scheme. | Help start-ups to take help from empanelled facilitators to file and prosecute their application without any charge, fund of funds for start-ups to increase investment, income tax exemptions on a case to case basis, and the start-ups have also been provided with rebate on patent filing fees and trade mark filing fees. | Facilitate the growth of start-ups. | | Production Linked Incentives Scheme | To enhance manufacturing, promote manufacturing exports and generate employment opportunities. | Higher economic growth |
| Annex Table 3: Movement of key services indicators | | (Growth rate in per cent) | | Year | Construction | Transport | Trade | IT firms revenue growth | Financial services | Telecommunication | | Steel | Cement produc-tion | Registered motor vehicle | Registered commercial vehicles | Rail passenger | Rail freight | Aviation passenger | Aviation cargo | Port cargo | Sales tax | Bank deposit | Bank credit | Tele phone sub scribers | Internet subs cribers | | Consump-tion | | 1998-99 | | 6 | 8 | 1 | 6 | -2 | 1 | -1 | -1 | 9 | 52 | 20 | 14 | 22 | | | 1999-00 | | 14 | 9 | 6 | 7 | 6 | 6 | 14 | 16 | 18 | 40 | 17 | 20 | 26 | | | 2000-01 | | -1 | 13 | 9 | 6 | 0 | 8 | 6 | 10 | 22 | 46 | 17 | 19 | 27 | | | 2001-02 | | 7 | 7 | 1 | 7 | 3 | -5 | 1 | 4 | 5 | 12 | 14 | 23 | 24 | | | 2002-03 | | 9 | 14 | 17 | 5 | 2 | 9 | 15 | 9 | 12 | 17 | 13 | 14 | 21 | | | 2003-04 | | 6 | 9 | 7 | 5 | -2 | 11 | 9 | 11 | 13 | 27 | 16 | 17 | 40 | | | 2004-05 | | 7 | 12 | 9 | 6 | 5 | 22 | 20 | 12 | 20 | 53 | 17 | 33 | 29 | | | 2005-06 | | 12 | 10 | 10 | 7 | 3 | 24 | 10 | 11 | 10 | 31 | 18 | 32 | 43 | | | 2006-07 | | 9 | 8 | 19 | 13 | 5 | 31 | 10 | 12 | 19 | 38 | 25 | 31 | 47 | | | 2007-08 | 11 | 8 | 9 | 9 | 11 | 7 | 21 | 11 | 11 | 13 | 23 | 23 | 25 | 45 | | | 2008-09 | 0 | 7 | 9 | 7 | 9 | 5 | -7 | -1 | 3 | 14 | 22 | 22 | 21 | 43 | | | 2009-10 | 13 | 11 | 11 | 6 | 8 | 5 | 14 | 15 | 14 | 11 | 1 | 17 | 17 | 45 | | | 2010-11 | 12 | 5 | 11 | 9 | 8 | 3 | 16 | 20 | 4 | 26 | 15 | 18 | 23 | 36 | | | 2011-12 | 7 | 7 | 12 | 8 | 7 | 6 | 13 | -3 | 3 | 24 | 24 | 15 | 18 | 12 | | | 2012-13 | 3 | 7 | 10 | 8 | 5 | 3 | -2 | -4 | 2 | 17 | 16 | 15 | 16 | -6 | | | 2013-14 | 1 | 4 | 8 | 5 | 6 | 4 | 6 | 4 | 4 | 12 | 23 | 15 | 15 | 4 | | | 2014-15 | 4 | 6 | 10 | 7 | -1 | -4 | 13 | 11 | 8 | 9 | 10 | 11 | 10 | 7 | 20 | | 2015-16 | 6 | 5 | 10 | 8 | 0 | -2 | 18 | 7 | 2 | 7 | 19 | 7 | 7 | 6 | 13 | | 2016-17 | 3 | -1 | 10 | 6 | 1 | -1 | 18 | 10 | 6 | 11 | 11 | 10 | 3 | 13 | 23 | | 2017-18 | 8 | 6 | 10 | 7 | 2 | 1 | 17 | 13 | 7 | -32 | 7 | 6 | 8 | 1 | 17 | | 2018-19 | 9 | 13 | 9 | 7 | -2 | 5 | 12 | 6 | 6 | -28 | 13 | 9 | 11 | -2 | 29 | | 2019-20 | 1 | -1 | 8 | | -9 | -4 | -1 | -7 | 1 | 8 | 10 | 8 | 6 | 0 | 17 | | 2020-21 | -5 | -11 | 9 | | 0 | | -66 | -26 | -5 | 10 | 4 | 12 | 5 | 2 | 11 | | Source: CMIE Economic Outlook and CEIC. |
| Annex Table 4: Major policy Reforms in the Services Sectors | | Policy | Objective | Expected Outcome | | The National Intellectual Property Rights (IPR) policy. | Put in place an appropriate legal system for handling the IPRs, creating awareness about IPRs, encouraging IPRs, commercialization of IPRs, preventing IPR infringements, among others. | Promotion of entrepreneurship and start-ups for economic growth. | | The Real Estate Regulation and Development Act (RERA). | To bring in more transparency and equity in the real estate transactions. | Protects the interests of the home buyers. Ease stress and increase investment in the real estate sector. | | IT-BPM industry - Relaxation of OSP Terms & Conditions, and Consumer Protection (E-commerce) Rules, 2020. | Reduction in the compliance burden of business process outsourcing companies. | Opens opportunities for the global companies to invest in India. Bring in more women and physically handicapped persons into the labor force. | | Sagarmaala Programme | Reduce the cost of transportation for foreign and domestic trade. | Opportunities for economic growth and development. | | The National Waterways Act, 2016. | Identified more than hundred waterways to improve the inland water transport. | Facilitation of domestic trade. | | The National Civil Aviation Policy 2016. | To connect the underserved airports with major airports in India at a relatively lower cost by subsidising the airlines. | Fast connectivity to global cities from various places in India and domestic outreach to far off places. Affordable air travel for the common masses and balanced regional development. | | ‘National Rail Plan (NRP)’ Vision 2024. | Set of forward looking measures aimed at creating capacity with a view to increasing the share of freight traffic to 45%. | Aims at preparing the railways ahead of the realisation of actual demand. | | The National Digital Communications Policy (NDCP) 2018. | Universal coverage of the population through the digital modes. | Accelerate economic growth and prepare the economy for next generation developments and reforms. | | ‘Bharatnet’ initiative | Connect 600,000 villages through broadband. | Accelerate economic growth and prepare the economy for next generation developments and reforms. | | Tourism - Liberalized Visa Regime | Increase the number of countries’ citizens who can enter India with a valid e-visa. | To boost the tourist arrivals to India. | | National Infrastructure Pipeline (NIP) | Structural reforms across 34 sub-sectors and more than 9000 infrastructure projects. | Boost the infrastructure development across several sectors of the economy. |
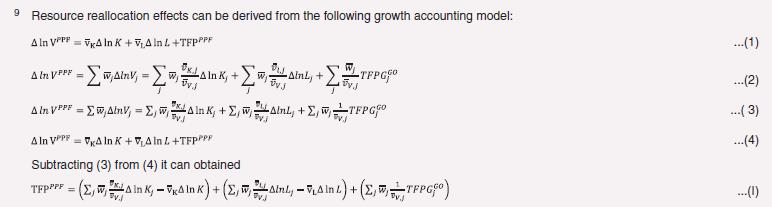 |