I. Macroeconomic Outlook The global economic environment has drastically altered, with the escalating geopolitical situation clouding the outlook for both growth and inflation in India and across the world warranting a revision in forecasts. Lingering war and sanctions, elevated oil and commodity prices, prolonged supply chain disruptions, accentuated global financial market volatility emanating from monetary policy shifts in major economies, and renewed waves of COVID-19 across countries pose downside risks to the growth and upside risks to the inflation outlook. I.1 Key Developments since the October 2021 MPR Since the release of the October 2021 Monetary Policy Report (MPR), the global economic environment has drastically altered, with the escalating geopolitical situation clouding the outlook for both growth and inflation in India and across the world warranting a revision in forecasts. Amidst persisting global supply chain disruptions, elevated energy and input prices and tighter labour markets, apprehensions of heightened global financial and commodity market volatility come together in a perfect storm. Brent crude prices crossed US$ 130 per barrel on March 8, 2022 and have hovered in the US$ 100-120 range since mid-March, posing the biggest risk to India’s economic prospects and putting the global recovery at heightened risk. The Bloomberg commodity index spiked by around 10 per cent since the war erupted on February 24 and 52 per cent on a year-on-year basis (as on April 5, 2022) as supply concerns exacerbated across commodities. Gold prices crossed US$ 2,000 per ounce on safe haven demand before some correction. Global food prices were at an all-time high in February 2022 and are expected to harden further in view of potential supply disruptions. With inflation turning out to be persistent and broad-based and well above targets, major advanced economies (AEs) quickened the pace of unwinding of their ultra-accommodative monetary policies. A number of emerging market economies (EMEs) have been in a tightening mode since 2021, and more are expected to follow. Sovereign bond yields in major AEs had hardened substantially in anticipation of a faster and steeper tightening of policy rates, but geopolitical risks have imparted high volatility as risk sentiment experiences sudden and sizeable shifts by every passing day. Equity markets have seen sharp corrections since the start of the calendar year with the market volatility index rising to a one-year high amidst geopolitical tensions. Currency markets have turned highly volatile in response to these developments, with the US dollar index reaching its highest since June 2020 due to flight to safety. Turning to the domestic economy, real gross domestic product (GDP) rose by 8.9 per cent in 2021-22, above its pre-pandemic (2019-20) level by just 1.8 per cent. Economic activity, which gained strength in Q2:2021- 22 (July-September) with the ebbing of the second wave, has lost pace since Q3:2021-22 (October- December), exacerbated by the spread of the Omicron variant in Q4 (January-March). The beneficial effects of the rapid ebb of infections have, however, been overwhelmed by the geopolitical conflagration since February 2022. Consumer price index (CPI) inflation edged above the upper tolerance band in February 2022 as unfavourable base effects combine with the onset of supply shocks as conflict escalates. While India’s direct trade and financial exposures are modest, indirect spillovers from the slowing global economy, the sharp jump in commodity prices across the board and elevated risk aversion and uncertainty owing to geopolitical developments weigh heavily on the outlook. Monetary Policy Committee: October 2021-March 2022 During October 2021-March 2022, the Monetary Policy Committee (MPC) met thrice. When the MPC met for its October 2021 meeting, CPI inflation had returned within the tolerance band after breaching the upper threshold in May-June 2021. The outlook for aggregate demand was progressively improving but output was still below the pre-COVID level and the recovery was uneven. The external environment had turned uncertain and challenging, with headwinds from slowing growth in major economies, a steep jump in natural gas prices and concerns emanating from normalisation of monetary policy in major advanced economies. Against this backdrop, the MPC noted that the domestic recovery needed to be nurtured assiduously through all policy channels and decided unanimously to keep the policy repo rate unchanged at 4 per cent and by a majority of 5 to 1 to continue with an accommodative stance as long as necessary to revive and sustain growth on a durable basis and continue to mitigate the impact of COVID-19 on the economy, while ensuring that inflation remains within the target going forward. In its December 2021 meeting, the MPC noted that continuing the normalisation of excise duties and value added taxes (VATs) on petroleum products alongside measures to address other input cost pressures assumed critical importance for a sustained lowering of core inflation. The domestic recovery was gaining traction but was just about catching up with pre-pandemic levels and downside risks remained significant, rendering the outlook highly uncertain, especially on account of global spillovers, the potential resurgence in COVID-19 infections with new mutations, persisting shortages and bottlenecks and the widening divergences in policy actions and stances across the world. Against this backdrop, the MPC judged that the ongoing domestic recovery needed sustained policy support to make it more broad-based and decided unanimously to maintain status quo on the policy repo rate and with a majority of 5 to 1 to continue with the accommodative stance set out in the October resolution. At the time of MPC’s February 2022 meeting, CPI inflation had edged even higher, driven up by unfavourable base effects while demand-pull pressures remained muted. The MPC noted that inflation was likely to moderate in H1:2022-23 and move closer to the target thereafter, providing room to remain accommodative. The potential pick up of input costs was seen as a contingent risk, especially if international crude oil prices remained elevated. On economic activity, the MPC observed that COVID-19 continued to impart some uncertainty to the future outlook while the global macroeconomic environment was characterised by deceleration in global demand, with increasing headwinds from financial market volatility induced by monetary policy normalisation. Judging that the domestic recovery was still incomplete and needed continued policy support, the MPC decided unanimously to keep the policy repo rate unchanged and on a 5 to 1 majority to continue with the accommodative stance. The MPC’s voting pattern reflects the diversity in individual members’ assessments, expectations and policy preferences, a characteristic also reflected in voting patterns of other central banks (Table I.1). Macroeconomic Outlook Chapters II and III analyse macroeconomic developments related to inflation and economic activity during H2:2021-22 (October-March). For the updated projections set out in this Chapter, the evolution of key macroeconomic and financial variables over the past six months warrants revisions in the baseline assumptions (Table I.2). First, international crude oil prices have surged over the past six months. Crude oil prices initially declined in late November 2021 in the wake of the Omicron wave and the expected reduction in demand; since then, global crude oil prices have been on the rise as demand increased with the ebbing of Omicron infections while supply remained sluggish due to the chronic under-performance versus targets by the Organization of the Petroleum Exporting Countries (OPEC) plus, a subdued shale response, multi-year low oil inventories, dwindling spare capacity and Russia- Ukraine developments (Chart I.1). The outlook has become highly uncertain due to escalating geopolitical tensions and sanctions, even as the US has decided to release about 180 million barrels of oil from its stockpile in a bid to cool crude prices. Taking into account these developments, crude prices (Indian basket) are assumed at US$ 100 per barrel in the baseline, 33 per cent above the October MPR baseline. | Table I.1 Monetary Policy Committees and Policy Rate Voting Patterns | | Country | Policy Meetings: October 2021-March 2022 | | Total meetings | Meetings with full consensus | Meetings without full consensus | Variation in policy rate (basis points) | | Brazil | 4 | 4 | 0 | 550 | | Chile | 4 | 4 | 0 | 550 | | Colombia | 4 | 0 | 4 | 300 | | Czech Republic | 4 | 0 | 4 | 350 | | Hungary | 6 | 6 | 0 | 275 | | India | 3 | 3 | 0 | 0 | | Israel | 4 | 3 | 1 | 0 | | Japan | 4 | 0 | 4 | 0 | | South Africa | 3 | 0 | 3 | 75 | | Sweden | 2 | 2 | 0 | 0 | | Thailand | 4 | 4 | 0 | 0 | | UK | 4 | 0 | 4 | 65 | | US | 4 | 3 | 1 | 25 | | Sources: Central bank websites. | Second, the nominal exchange rate (the Indian rupee or INR vis-à-vis the US dollar) has exhibited two-way movements in a range of INR 74-77 per US dollar since October 2021. The INR exhibited a depreciating bias till the middle of December 2021 over concerns about the economic fallout from the Omicron wave, elevated crude oil prices, and expectations of faster rate hikes by the US Fed. Subsequently, as the Omicron caseloads declined sharply, the INR showed signs of appreciation. The INR came under pressure from late February due to geopolitical tensions and the surge in crude oil prices. Taking these developments into consideration, the exchange rate is assumed at INR 76 per US dollar in the baseline as against INR 74.3 in the October 2021 MPR. | Table I.2: Baseline Assumptions for Projections | | Indicator | MPR October 2021 | MPR April 2022 | | Crude Oil (Indian basket) | US$ 75 per barrel during H2:2021-22 | US$ 100 per barrel during 2022-23 | | Exchange rate | ₹74.3/US$ during H2:2021-22 | ₹76/US$ during 2022-23 | | Monsoon | 1 per cent below long-period average | Normal for 2022-23 | | Global growth | 6.0 per cent in 2021
4.9 per cent in 2022 | 3.5 per cent in 2022
3.5 per cent in 2023 | | Fiscal deficit (per cent of GDP) | To remain within BE 2021-22
Centre: 6.8
Combined: 10.2 | To remain within BE 2022-23
Centre: 6.4
Combined: 9.0 | | Domestic macroeconomic/ structural policies during the forecast period | No major change | No major change | Notes: 1. The Indian basket of crude oil represents a derived numeraire comprising sour grade (Oman and Dubai average) and sweet grade (Brent) crude oil.
2. The exchange rate path assumed here is for the purpose of generating the baseline projections and does not indicate any ‘view’ on the level of the exchange rate. The Reserve Bank is guided by the objective of containing excess volatility in the foreign exchange market and not by any specific level of and/or band around the exchange rate.
3. BE: Budget estimates.
4. Combined fiscal deficit refers to that of the Centre and States taken together.
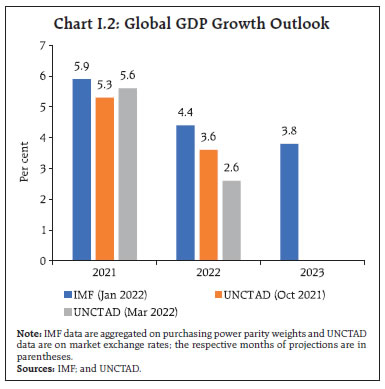
Sources: RBI staff estimates; Budget documents; and IMF. | Third, the global economic prospects have weakened significantly since the October MPR, with a sequence of headwinds from the Omicron wave, prolonged global supply chain disruptions, persistent container shortages, multi-decadal inflation highs in major advanced economies forcing their central banks to quicken the pace of monetary policy normalisation and more recently by the escalating geopolitical tensions (Chart I.2). According to the Organisation for Economic Co-operation and Development (OECD), the rise in commodity prices and financial market volatility since the ratcheting up of the geopolitical tensions in February, if sustained, could reduce global GDP growth by over one percentage point in the first year and push up global consumer price inflation by around 2.5 percentage points; the output losses could be higher in case of further sanctions, consumer and business boycotts, disruptions to shipping and air traffic, the unavailability of key products from Russia, trade restrictions such as export bans on food commodities, and undermined consumer confidence.1 In March, the United Nations Conference on Trade and Development (UNCTAD) projected global growth for 2022 to be 100 bps below its October 2021 assessment.2 
 I.2 The Outlook for Inflation After easing to 4.3 per cent in September 2021, CPI inflation rose in the following months to reach 6.1 per cent in February 2022, driven by the increase in food inflation. Looking ahead, the three months and one year ahead median inflation expectations of urban households increased marginally by 10 bps each in the March 2022 round of the Reserve Bank’s survey.3 The proportion of respondents expecting the general price level to increase by more than the current rate also increased for both the three months and one year ahead horizons vis-à-vis the previous round (Chart I.3). Manufacturing firms polled in the January-March 2022 round of the Reserve Bank’s industrial outlook survey expected increase in their input costs and selling prices in Q1:2022-23 (Chart I.4a).4 Service and infrastructure sector companies expected moderation in the pace of increase in input costs and selling prices in Q1:2022-23 (Charts I.4b and I.4c).5 The respondents in manufacturing and services PMI reported continued input and output price pressures in March 2022.
Professional forecasters surveyed by the Reserve Bank in March 2022 expected CPI inflation to move from 6.1 per cent in Q4:2021-22 to 5.8 per cent in Q1:2022-23, 5.9 per cent in Q2, 5.4 per cent in Q3 and 5.2 per cent in Q4 (Chart I.5 and Table I.3).6 One-year ahead inflation expectations of professional forecasters are anchored around the inflation target, while those of households seem to be sensitive to volatility in food prices (Box I.1). | Table I.3: Projections - Reserve Bank and Professional Forecasters | | (Per cent) | | | 2021-22 | 2022-23 | 2023-24 | | Reserve Bank’s Baseline Projections | | | | | Inflation, Q4 (y-o-y) | 6.2 | 5.1 | 5.5 | | Real GDP growth | 8.9@ | 7.2 | 6.3 | | Median Projections of Professional Forecasters | | Inflation, Q4 (y-o-y) | 6.1 | 5.2 | | | Real GDP growth | 8.8 | 7.5 | | | Gross domestic saving (per cent of GNDI) | 29.0 | 28.7 | | | Gross capital formation (per cent of GDP) | 30.1 | 30.6 | | | Credit growth of scheduled commercial banks | 8.0 | 9.4 | | | Combined gross fiscal deficit (per cent of GDP) | 10.4 | 9.7 | | | Central government gross fiscal deficit (per cent of GDP) | 6.9 | 6.4 | | | Repo rate (end-period) | 4.0 | 4.5 | | | Yield on 91-days treasury bills (end-period) | 3.9 | 4.5 | | | Yield on 10-year central government securities (end-period) | 6.8 | 7.1 | | | Overall balance of payments (US$ billion) | 42.5 | -18.1 | | | Merchandise exports growth | 39.0 | 8.9 | | | Merchandise imports growth | 53.0 | 12.9 | | | Current account balance (per cent of GDP) | -1.7 | -2.6 | | @: Second advance estimates, National Statistical Office.
Note: GNDI: Gross National Disposable Income.
Sources: RBI staff estimates; and Survey of Professional Forecasters (March 2022). |
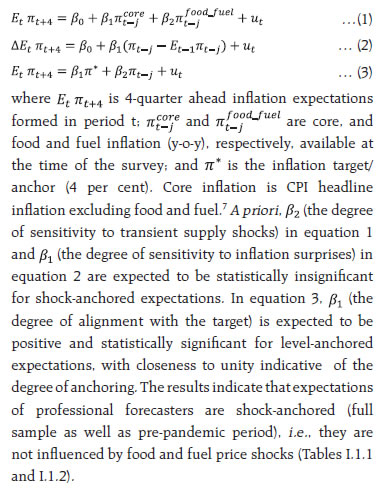
Box I.1: Inflation Expectations Anchoring Inflation expectations of firms and households are a key determinant of actual inflation dynamics. Two facets of the degree of anchoring of inflation expectations can be empirically examined – shock and level anchoring (Ball and Mazumder, 2011; Chen, 2019). Shock anchoring would imply that transitory supply-side shocks and inflation surprises (difference between the realised inflation and prior inflation expectations) do not affect inflation expectations of economic agents (equations 1 and 2 below). Level anchoring – a stronger form of the hypothesis – assesses directly whether inflation expectations are anchored at the inflation target (equation 3 below). Drawing upon this conceptual framework, an empirical analysis is undertaken for 4-quarter ahead inflation expectations of professional forecasters (SPF) and households (IESH) in the Indian context for the period October 2016 to February 2022. The analysis is also conducted for the pre-pandemic period for robustness, given the persistent supply-side shocks in the period since March 2020. | Table I.1.1: Shock Anchoring | | | SPF | IESH | | FIT period | FIT period excluding pandemic | FIT period | FIT period excluding pandemic | | Core inflation | 0.244** | 0.240* | 0.233** | 0.214** | 0.687*** | 0.596** | 0.657*** | 0.743*** | | Food and fuel inflation | -0.013 | - | -0.024 | - | 0.156** | - | 0.399*** | - | | Food inflation | - | -0.012 | - | -0.020 | - | 0.130** | - | 0.288*** | | Fuel inflation | - | 0.013 | - | 0.015 | - | 0.079 | - | 0.025 | | Constant | 3.242*** | 3.183*** | 3.397*** | 3.418*** | 5.411*** | 5.602*** | 4.628*** | 4.545*** | | Observations | 33 | 33 | 21 | 21 | 33 | 33 | 21 | 21 | | Adjusted R2 | 0.47 | 0.46 | 0.74 | 0.73 | 0.51 | 0.48 | 0.57 | 0.51 | | DW Statistic | 1.56 | 1.59 | 1.47 | 1.49 | 1.86 | 1.82 | 2.00 | 1.92 | Note: ***, **, * denote the level of significance at 1%, 5% and 10%, respectively. Regression estimates are corrected for first-order serially correlated residuals by using the Prais–Winsten transformation. FIT refers to Flexible Inflation Targeting.
Source: RBI staff estimates. |
 One-year ahead expectations of professional forecasters are also level-anchored (i.e., they remain in close proximity to the inflation target); the null hypothesis of a unit coefficient on the inflation target and a zero coefficient on the actual realisation of inflation is not rejected (Table I.1.3 and Chart I.1.1a). Such anchoring of medium- and long-term inflation expectations can impart stability to bond yields and improve monetary transmission. Inflation expectations of households, on the other hand, seem to be adaptive and backward-looking, driven by changes in food prices (food items have a weight of 46 per cent in the CPI in India) as well as the relatively more volatile nature of food prices (Singh et al., 2022). A comparison of the regressions of households for the full period and the pre-pandemic period (Tables I.1.1 and I.1.2) indicates a reduction in the coefficients on food and fuel inflation as well as on inflation surprises in the extended sample, suggesting reduced sensitivity of their expectations to shocks. An upward bias in households’ inflation expectations is observed in other countries as well (Chart I.1.1.b). The co-movement of households’ inflation expectations with actual inflation appears to be in consonance with the cross-country experience with expectations responding more to an increase in prices than to an equivalent fall in prices (Baqaee, 2020). | Table I.1.2: Shock Anchoring | | | SPF | IESH | | FIT period | FIT period excluding pandemic | FIT period | FIT period excluding pandemic | | News shock | 0.082 | 0.030 | 0.219** | 0.442** | | Constant | -0.014 | -0.052 | 0.969** | 1.896** | | Observations | 33 | 21 | 33 | 21 | | Adjusted R2 | 0.03 | -0.04 | 0.08 | 0.15 | | DW Statistic | 1.61 | 1.52 | 2.27 | 2.26 | Note: ***, **, * denote the level of significance at 1%, 5% and 10%, respectively.
Source: RBI staff estimates. |
| Table I.1.3: Level Anchoring | | | SPF | IESH | | FIT period | FIT period excluding pandemic | FIT period | FIT period excluding pandemic | | Target | 1.082*** | 1.118*** | 2.228*** | 1.574*** | | Inflation | 0.027 | -0.017 | 0.169 | 0.711*** | | Observations | 33 | 21 | 33 | 21 | | Adjusted R2 | 0.87 | 0.96 | 0.96 | 1.00 | | DW Statistic | 1.54 | 1.18 | 1.96 | 1.84 | | Wald Test for β1=1 & β2=0 (p-value) | 0.27 | 0.14 | 0.00 | 0.00 | Note: ***, **, * denote the level of significance at 1%, 5% and 10%, respectively. Regression estimates are corrected for first-order serially correlated residuals by using the Prais–Winsten transformation.
Source: RBI staff estimates. | References: Ball, Laurence, and S. Mazumder (2011), “Inflation Dynamics and the Great Recession”, Brookings Papers on Economic Activity 42 (Spring), pp. 337–405. Baqaee, David Rezza (2020), “Asymmetric Inflation Expectations, Downward Rigidity of Wages, and Asymmetric Business Cycles”, Journal of Monetary Economics, 114, pp. 174-193. Chen, Yiqun Gloria (2019), “Inflation, Inflation Expectations, and the Phillips Curve';, Congressional Budget Office Working paper, 2019-07. Singh, D. P., Mishra, A., and Shaw, P. (2022), “Taking Cognisance of Households’ Inflation Expectations in India”, RBI Working Paper Series, 02/2022. | Looking ahead, the record foodgrains production in 2021-22, ample foodgrains buffer stocks and the government’s supply side interventions augur well for food inflation in 2022-23 on the assumption of a normal monsoon. Taking into account the initial conditions, signals from forward-looking surveys, estimates from structural and other time-series models, and crude oil (Indian basket) at US$ 100 per barrel in 2022-23, CPI inflation is projected to average 5.7 per cent in 2022-23 – 6.3 per cent in Q1, 5.8 per cent in Q2, 5.4 per cent in Q3, and 5.1 per cent in Q4 (Chart I.6). The 50 per cent and the 70 per cent confidence intervals for headline inflation in Q4:2022-23 are 3.4-6.8 per cent and 2.5-7.7 per cent, respectively. For 2023-24, assuming a progressive normalisation of supply chains, a normal monsoon and no further exogenous or policy shocks, structural model estimates indicate that inflation will move in a range of 4.6-5.7 per cent. The 50 per cent and the 70 per cent confidence intervals for Q4:2023-24 are 3.8-7.2 per cent and 2.9-8.1 per cent, respectively. 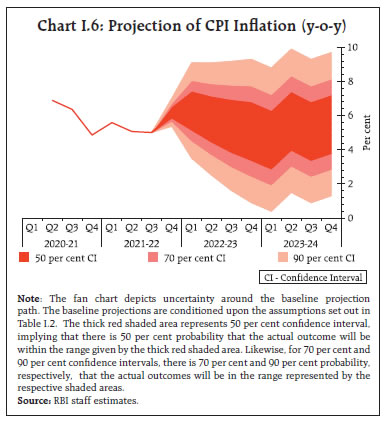 There are a number of upside and downside risks to the baseline inflation forecasts. The upside risks emanate from a further hardening of global crude and other commodity prices due to geopolitical tensions, longer-than-expected supply chain disruptions, a larger pass-through of input cost pressures to output prices in the event of stronger demand conditions and global financial market volatility from a quicker-than- expected normalisation of monetary policy by the advanced economies. The downside risks arise from an early mending of supply chain disruptions, a muted pass-through to output prices and a correction in global commodity prices due to global demand weakening more than expected and an easing of geopolitical tensions. I.3 The Outlook for Growth Economic activity which was recovering with the ebbing of the third wave, rapid stride towards universal vaccination, and supportive fiscal and monetary policies now faces significant headwinds from the exacerbating geopolitical developments and the accompanying sharp rise in global commodity prices and weakening global growth outlook. Turning to the key messages from forward-looking surveys, the consumer confidence (the current situation index) rose in the March 2022 survey round, although it remained in the pessimistic zone. For the year ahead, consumers’ optimism strengthened further on the back of improved sentiments on the general economic situation, employment and household income (Chart I.7).8
Optimism in the manufacturing sector for the quarter ahead moderated marginally in the January-March 2022 round of the Reserve Bank’s industrial outlook survey due to an ebb in sentiments on inventory of raw materials and finished goods (Chart I.8a). Services and infrastructure sectors also reported lower optimism on the overall business situation in Q1:2022-23 (Charts I.8b and I.8c). Recent surveys by other agencies indicate a sequential moderation in business expectations (Table I.4). According to the PMI surveys, one year ahead business expectations of firms in the manufacturing sector moderated while those of firms in the services sector remained steady in March 2022. Professional forecasters polled in the March 2022 round of the Reserve Bank’s survey expected real GDP growth at 3.9 per cent in Q4:2021-22, 14.0 per cent in Q1:2022-23 (due to favourable base effects), 6.4 per cent in Q2, 5.1 per cent in Q3, and 4.9 per cent in Q4 (Chart I.9). | Table I.4: Business Expectations Surveys | | Item | NCAER Business Confidence Index
(December 2021) | FICCI Overall Business Confidence Index
(January 2022) | Dun and Bradstreet Composite Business Optimism Index
(February 2022) | CII Business Confidence Index
(March 2022) | | Current level of the index | 124.4 | 63.9 | 89.9 | 65.0 | | Index as per previous survey | 117.4 | 75.7 | 94.6 | 66.8 | | % change (q-o-q) sequential | 6.0 | -15.6 | -5.0 | -2.7 | | % change (y-o-y) | 46.6 | -13.9 | 12.5 | -5.4 | Notes: 1. NCAER: National Council of Applied Economic Research.
2. FICCI: Federation of Indian Chambers of Commerce & Industry.
3. CII: Confederation of Indian Industry.
Sources: NCAER; FICCI; CII; and Dun & Bradstreet Information Services India Pvt. Ltd. | 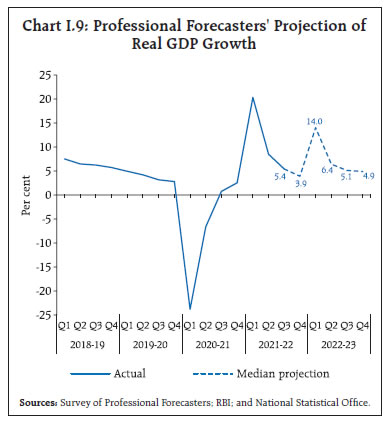 Taking into account the baseline assumptions, including crude oil (Indian basket) at US$ 100 per barrel, the survey indicators, and model forecasts, real GDP growth is expected at 7.2 per cent in 2022- 23 - Q1:2022-23 at 16.2 per cent; Q2 at 6.2 per cent; Q3 at 4.1 per cent; and Q4 at 4.0 per cent - with risks evenly balanced around this baseline path (Chart I.10 and Table I.3). For 2023-24, assuming a normal monsoon, and no major exogenous or policy shocks, the structural model estimates indicate real GDP growth at 6.3 per cent, with quarterly growth rates in the range of 5.9-6.8 per cent. There are upside and downside risks to the baseline growth path. Upside risks to the baseline trajectory could emanate from stronger and sustained expansion in domestic demand, including for contact-intensive services, a boost to private investment activity from the confluence of government’s thrust on capital expenditure, and healthier corporate balance sheets (Chapter III). On the contrary, the heightened geopolitical tensions – resulting in the significant hardening of international crude oil and other commodity prices to multi-year highs, the upsurge in global financial market turmoil and the loss of momentum in global trade and demand – pose sizeable downside risks to the baseline growth path. Additional downside risks emanate from renewed COVID-19 infections, new and more contagious variants of the virus, pandemic-related global supply bottlenecks stretching longer than expected, and AE monetary policy normalisation-induced global financial market volatility. I.4 Balance of Risks The baseline projections of inflation and growth presented in the previous sections are conditional on the assumptions of key domestic and international macroeconomic variables set out in Table I.2. This section explores plausible alternative scenarios to assess the balance of risks to the baseline projections. (i) Geopolitical Risks The global recovery from the COVID-19 pandemic is turning out to be muted relative to earlier expectations. Downside risks to even this subdued recovery have jumped significantly from the escalation of geopolitical tensions, which have led to a broad-based increase in global commodity prices and are expected to have a large negative impact on global trade and growth. Even as the share of Russia and Ukraine in global economy is modest, they are among the major global suppliers of key commodities such as crude oil, natural gas, fertilisers, wheat, corn, and metals. A more protracted conflict, extended sanctions, sustained further hardening of global commodity prices and prolonged supply bottlenecks could push global growth well below the baseline. Recurrent waves of COVID-19 infections amidst new mutants of the virus, uneven vaccination progress across countries, and a sharper and deeper tightening of monetary policy by major AE central banks to anchor inflation expectations impose further downside risks to the global outlook. In such a scenario, if global growth is 100 bps lower than the baseline, domestic growth and inflation could be around 40 bps and 20 bps, respectively, below the baseline trajectories; however, the jump in crude oil prices due to geopolitical tensions, as discussed later, would harden domestic inflation. Conversely, an early easing of geopolitical tensions, growing vaccination coverage across countries, a more even distribution of vaccines towards low-income countries, a faster easing of supply chain disruptions and a more gradual withdrawal of monetary accommodation by the major AEs could provide a boost to economic activity. In this scenario, assuming that global growth surprises by 100 bps on the upside, domestic growth and inflation could edge higher by around 40 bps and 20 bps, respectively, over the baseline (Charts I.11a and I.12a). (ii) International Crude Oil Prices International crude oil prices have risen sharply, driven by sudden and overwhelming disruptions caused by war, strong demand and a less than proportionate expansion in output by the OPEC plus. While future prices and the medium-term outlook for supplies suggest a correction in crude oil prices in the months ahead, this could easily be overwhelmed by the fallout of the conflict. The outlook poses sizeable risks on either side for a net energy importer like India. An escalation of geopolitical tensions and further drawdown of global inventories amidst OPEC plus production continuing to lag demand could harden international crude oil prices even further and US$ 150 per barrel could easily be tested. 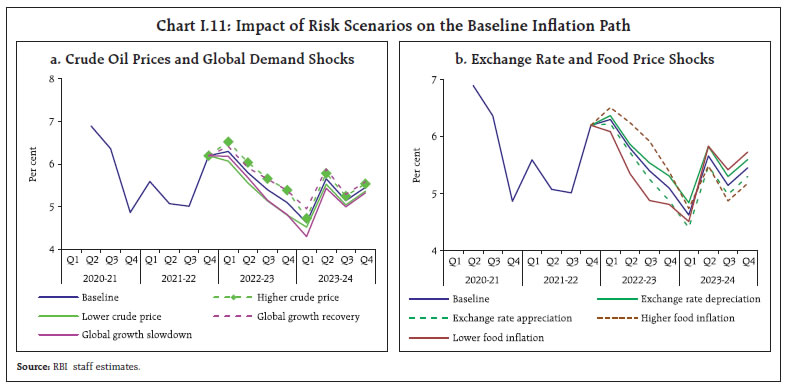
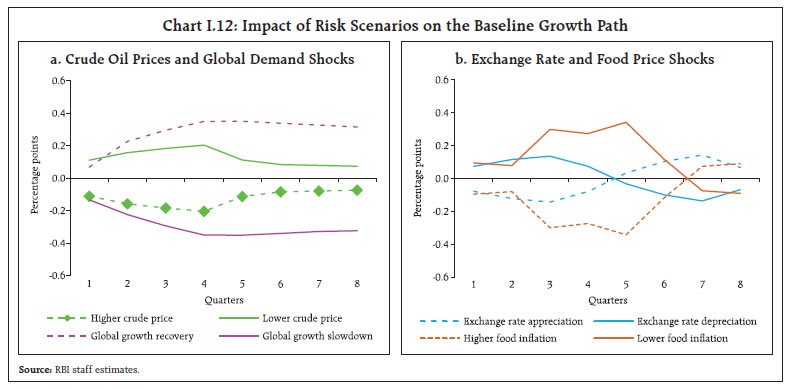 Assuming crude oil price to be 10 per cent above the baseline of US$ 100 per barrel, domestic inflation and growth could be higher by around 30 bps and weaker by around 20 bps, respectively, over the baseline. Conversely, crude oil prices could soften below the baseline due to a faster resolution of geopolitical tensions, release of emergency stockpiles, a stronger shale production response, and global demand becoming subdued owing to renewed waves of the virus. As a result, if the Indian basket of crude prices falls by 10 per cent relative to the baseline, inflation could ease by around 30 bps with a boost of 20 bps to growth (Charts I.11a and I.12a). Crude oil prices impact growth and inflation through multiple channels. First, international crude prices have a direct impact on inflation, given the weights of petrol and diesel in the CPI basket, which wear off in a year. Second, indirect effects through cost push and higher inflation expectations could push up headline inflation in the medium run. Third, higher trade and current account deficits in the balance of payments can exert downward impact on the INR exchange rate, adding to inflationary pressures. On the output side, higher petroleum prices act as a negative terms of trade shock to the economy, reduce the consumption of non-oil items of households and lower profit margins of firms, cash flows and investment. The consequent moderation in aggregate demand helps to offset some of the inflationary pressures. On net, inflation increases and might attract a monetary policy response (Chart I.13). The impact of crude oil prices on domestic inflation and output is also conditional on the initial level of crude oil prices in view of the retail petroleum product prices containing specific (non-ad valorem) elements such as excise duty and refining costs which do not co-move with crude oil prices. Therefore, the higher the initial level of crude oil prices, the higher is the impact of a given shock on domestic headline inflation, imparting non-linearity and time variations (Chart I.14). Finally, the impact of crude oil prices on the domestic economy would also be dependent on the persistence of the oil shock. A transitory shock to crude oil prices (Scenario 1) has only a negligible and temporary impact on inflation and output, while the adverse impact can be substantially higher and more protracted in case crude oil prices remain at elevated levels for longer (Scenarios 2 and 3) (Chart I.15).
(iii) Exchange Rate The INR has exhibited two-way movements over the past six months, reflecting both global and domestic factors. Looking ahead, the protracted geopolitical tensions, the heightened volatility in global financial markets, elevated global sovereign bond yields on the back of more than currently anticipated monetary policy tightening in major AEs, and new COVID-19 mutations could lead to a broader risk aversion towards EME assets and net capital outflows. Such developments can put downward pressure on the INR. Should the INR depreciate by 5 per cent from the baseline, inflation could edge up by around 20 bps while GDP growth could be higher by around 15 bps through increased net exports; the exchange rate pass-through to inflation can, however, be non-linear and time-varying in an environment of high volatility in financial and commodity markets (Patra et al, 2018).9 On the other hand, given that India is among the fastest growing large economies with relatively better growth outlook, strong capital flows led by foreign direct investment could continue. In this scenario, if the INR appreciates by 5 per cent relative to the baseline, inflation and GDP growth could moderate by around 20 bps and 15 bps, respectively (Charts I.11b and I.12b). (iv) Food Inflation Food inflation has risen in recent months, largely due to adverse base effects. The expected seasonal correction seems to be getting backloaded. Going forward, however, robust rabi prospects, ample buffer stocks of cereals, easing of supply chain bottlenecks and effective supply management measures could soften food inflation more than anticipated, and push headline inflation 50 bps below the baseline. Conversely, hardening global food prices due to geopolitical tensions and domestic demand-supply gaps in key food items like pulses and edible oils could lead to upward pressures on food prices and raise headline inflation by around 50 bps. The baseline assumes a normal south-west monsoon in 2022 and any deviations in the actual outturn on either side as well as unseasonal rains would be a critical factor for the food as well as headline inflation trajectory (Charts I.11b and I.12b). I.5 Conclusion Economic activity was recovering from the ebbing of the Omicron wave when the fallout of the Ukraine- Russia conflict has overcast the near-term outlook with heightened uncertainties. Growth and inflation outcomes are at high risk across the world as well as in India. In the face of this extraordinary risk, the positive effects expected from the release of pent-up demand, especially for contact-intensive services, the government’s thrust on infrastructure and capital expenditure, congenial financial conditions and improving capacity utilisation appear ephemeral. Updated forecasts indicate that headline inflation, which was expected to ease from current elevated levels as food inflation gets contained on the back of record production and abundant stocks, is now subject to a large geopolitical shock. The escalation of war, continued supply chain disruptions, global financial market volatility emanating from monetary policy normalisation in major advanced economies and the evolving COVID-19 trajectory pose downside risks to growth and upside risks to the inflation outlook and could get exacerbated significantly by the intensification of geopolitical tensions. The concomitant surge in global oil and commodity prices to multi-year highs has increased risk aversion as reflected in jumps in financial market volatility and these developments could increasingly shape the economic prospects globally and for India.
_______________________________________________________________________________________________
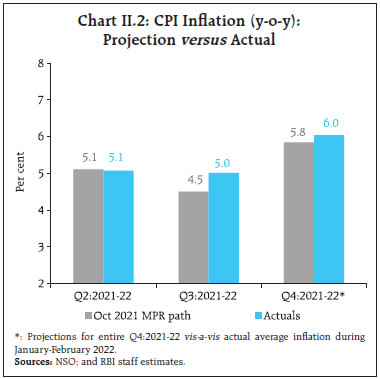
II. Prices and Costs Consumer price index (CPI) inflation remained volatile during September 2021 to February 2022. After moderating close to the target rate in September, headline CPI inflaiton rose sequentially to the upper tolerance threshold during January-February 2022 mirroring the movements in food inflation, even as fuel inflation remained elevated and core inflation sticky. Costs of farm and non-farm inputs remained elevated. Growth in nominal rural wages for both agricultural and non-agricultural labourers as well as staff costs in the organised sector remained contained. Since the publication of the October 2021 MPR, headline inflation1 has registered two-way movements – first, it moderated close to the target at 4.3 per cent in September 2021; thereafter, it moved up sequentially to the upper tolerance threshold of 6 per cent in January 2022, breaching it at 6.1 per cent in February. The movements in headline inflation mirrored the sharp movements in food inflation, which oscillated between a low of 1.6 per cent in September 2021 and a peak of 5.9 per cent in February 2022. A combination of transitory supply dislocation shocks, elevated import price pressures and unfavourable base effects drove the surge in food inflation. With international petroleum product prices on an unrelenting upward trajectory, fuel group inflation remained in double digits during September to December, moderating a little to 9.3 per cent in January 2022 and further to 8.7 per cent in February. Core inflation2 has remained elevated, sticking close to the upper tolerance threshold of 6.0 per cent as cost-push pressures impacted both manufactures and services (Chart II.1). The Reserve Bank of India (RBI) Act enjoins the RBI to set out deviations of actual inflation outcomes from projections, if any, and explain the underlying reasons thereof. The October 2021 MPR projected inflation to moderate to 4.5 per cent in Q3:2021-22 before increasing to 5.8 per cent in Q4:2021-22. Actual inflation outcomes were higher than projections by around 50 bps in Q3, but the gap narrowed to 20 bps in Q4 (Chart II.2). The overshoot in Q3 was primarily on account of vegetables prices shooting up disproportionately and falling out of alignment with projections in the months of October-November 2021 as a result of crop damage from heavy unseasonal rainfall. In addition, crude oil prices, which were assumed to be at US$ 75 per barrel during H2:2021-22, averaged US$ 82 per barrel in October itself, pushing domestic pump prices to the then historic high levels3 by the beginning of November. Subsequent reductions in excise duties and State value-added taxes (VATs) in early November led to a reduction in pump prices. Thereafter, barring tax cuts, pump prices remained unchanged in rest of Q3 even as crude oil prices moderated. In Q4 (up to February 2022), actual outcomes have turned out to be closer to projections, as the seasonal correction in some vegetable prices materialised as anticipated; but it turned out to be shallower, resulting in the overshoot over projections. Moreover, cereal prices were provided some upside, by rising export unit values – India is the world’s largest exporter of rice; it has also exported 19.1 million tonnes of rice during April 2021 to February 2022. 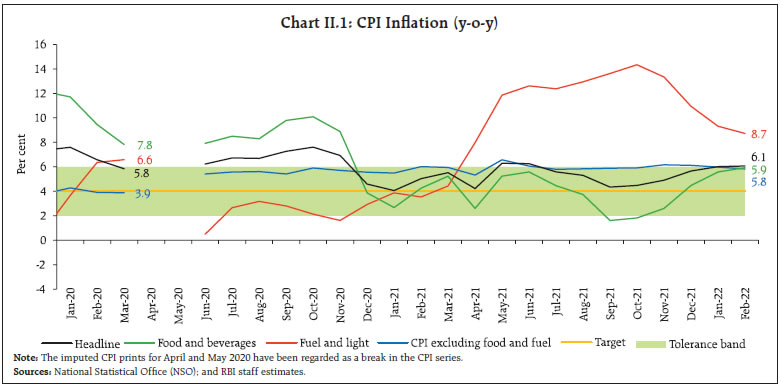
 II.1 Consumer Prices The sequential rise in CPI inflation from September 2021 was initially driven up by a pick-up in price momentum, followed by adverse base effects even as price momentum declined.4 In October and November 2021, price momentum increased across food and core categories, but this was couched by favourable base effects in food prices. With the winter setting in, a sharp correction in food prices caused the price momentum to decline in December 2021, but this was more than offset by large unfavourable base effects, resulting in headline inflation hardening by 75 basis points. In January 2022, the decline in food price momentum deepened, but adverse base effects pushed up headline inflation to 6.0 per cent. In February, the CPI headline price momentum turned positive on price pressures from fuel and core categories even though the food price momentum remained negative (Chart II.3). The distribution of CPI inflation during the financial year reveals a high dispersion of inflation rates in the CPI basket, with a considerable positive skew co-existing with a sharp rise in volatility. The large positive skew reflected outliers – oils and fats, fuel and transport – which registered inflation in double digits. The increase in volatility reflected surges and sharp deflation in vegetables prices (Chart II.4). Diffusion indices increased sharply during January-February 2022 across goods and services, indicating a broadening of price pressures (Chart II.5).5 II.2 Drivers of Inflation A historical decomposition of inflation using vector autoregression (VAR) estimates6, to ascertain the various macro-factors that drove inflation dynamics, indicate that the inflationary pressures in H2:2021-22 can be attributed mainly to adverse cost-push factors, coming from supply-side shocks in food and fuel prices, even as weak aggregate demand conditions continued to exert downward pressure on inflation (Chart II.6a).
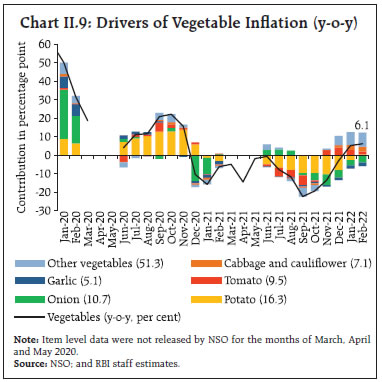
The pick-up in inflation since September 2021 was driven largely by goods inflation, particularly perishables such as vegetables (non-durable goods with a 7-day recall7). The contribution of semi-perishable goods (non-durable goods with a 30-day recall) edged up till October, but declined thereafter, reflecting primarily the movement in petroleum products inflation (Chart II.6b). Durable goods inflation has transmitted heightened cost-push pressures in the manufacturing sector. 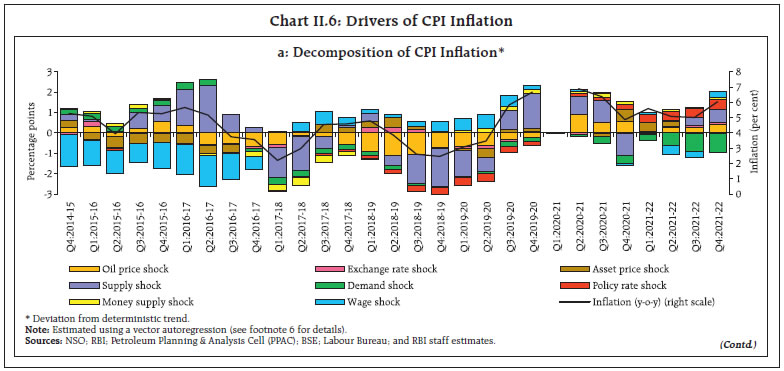 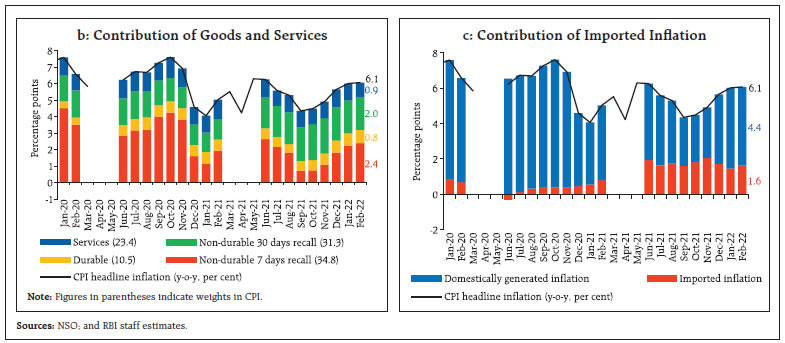 The increase in international prices of precious metals, edible oil and petroleum products led to an increase in the contribution of imported components to headline inflation – from 1.8 percentage points (or 40.4 per cent) in October to 2.1 percentage points (41.9 per cent) in November 2021. The decline in international commodity prices in December contributed to lower imported inflation. The cut in central excise duties on petrol and diesel during November, and the series of cuts in edible oils import duties helped in containing the contribution of domestically generated inflation pressures (Chart II.6c). Food Food and beverages (weight of 45.9 per cent in the CPI basket) inflation rose steadily between September 2021 and February 2022. The food price build-up in 2021-22 (up to February) was higher than historical patterns, driven by vegetable and edible oil prices even as protein-based products (milk, egg, meat and fish, and pulses), cereals, fruits and prepared meals experienced lower food price build-ups (Chart II.7a and b). In case of edible oil prices, however, the price declines during November 2021 to January 2022 have not proved sufficient to meaningfully offset the sustained price increases seen in the earlier part of the year, resulting in the price build-up remaining much above historical averages (Chart II.8). Prices of cereals (weight of 9.7 per cent in headline CPI and 21.1 per cent in the CPI food and beverages group), on a year-on-year basis, emerged out of eight months of deflation in October 2021 and reached 4.0 per cent in February 2022. Within cereals, wheat prices have increased sharply since September on higher exports (336.8 per cent y-o-y increase during April 2021-January 2022) and larger procurement. The increase in production (1.6 per cent as per 2021-22 second advance estimate (AE) over 2020-21 final estimates (FE), ample buffer stocks (1.5 times the buffer norms as on March 16, 2022) and free distribution under Pradhan Mantri Garib Kalyan Anna Yojana (PMGKAY) helped contain inflation. In the case of rice, prices remained relatively stable, as the pick-up in exports (by 28.2 per cent y-o-y during April 2021-January 2022) was supported by higher production (2.9 per cent as per 2021-22 2nd AE over 2020-21) and buffer stocks (7.5 times the norm).  Vegetables prices (weight of 6.0 per cent in headline CPI and 13.2 per cent in the CPI food and beverages group) were in deflation under the weight of large favourable base effects during September-December 2021, despite price pressures due to excess rain induced crop damage. Vegetables prices, however, started receding from December, but adverse base effects drove up inflation in this category to 6.1 per cent in February 2022 (Chart II.9). Among the inflation-sensitive vegetables, onion prices hardened during October-November 2021 on account of damages to the stored rabi crop in Maharashtra and Gujarat from cyclone Tauktae in May 2021, followed by damages to kharif crops due to heavy rains in major producing states. Subsequently, prices softened as a result of effective supply side interventions – 2.1 lakh tonnes of onion were released under the price stabilisation fund (PSF) scheme and exports were reduced ((-) 8.5 per cent y-o-y during April 2021-January 2022). Potato prices also escalated during October-November 2021 on account of unseasonal rains. Fresh crop arrivals and ample stocks in cold storages have, however, kept price pressures subdued in subsequent months. Tomato prices also picked up sharply during the same period due to delay in arrivals on account of erratic rains in Punjab, Uttar Pradesh, Haryana and Himachal Pradesh, coupled with supply shortages because of heavy rains in major producing states — Tamil Nadu, Andhra Pradesh, Telangana and Karnataka. 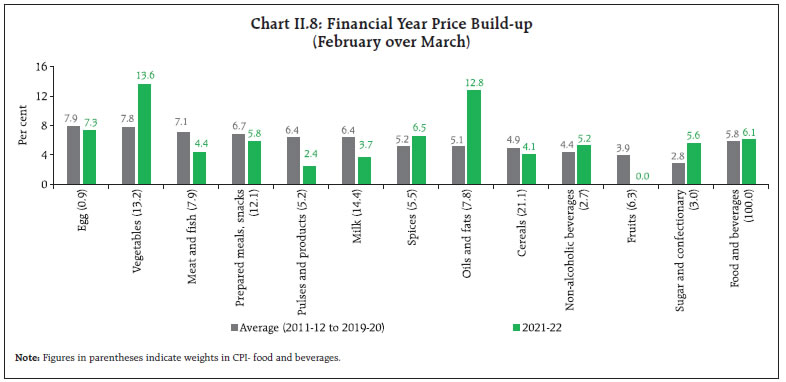
 Inflation in prices of fruits (weight of 2.9 per cent in the headline CPI and 6.3 per cent within the food and beverages group) moderated from a three-year high of 11.8 per cent in May 2021 to 2.3 per cent in February 2022, owing to decline in prices of bananas and apples, with apple production higher by 7.1 per cent in 2021-22 (1st AE) over 2020-21 (FE). The record production of pulses during 2021-22 at 269.6 lakh tonnes (2nd AE) has significantly augmented availability. The higher stock-to-use (STU) ratio at end-March 2022 over last March is reflective of improved supply conditions (Chart II.10). Supply-side measures such as moving imports of tur, urad and moong from restricted to ‘free category’ from May 15, 2021; removing import duty on masur and reducing Agriculture Infrastructure and Development Cess (AIDC) to 10 per cent from July 27, 2021; releasing masur from buffer stocks at discounted price; higher imports of pulses (1.9 per cent y-o-y during April 2021-January 2022); and open market intervention by the National Agricultural Cooperative Marketing Federation of India (NAFED) helped to keep pulses price inflation (weight of 2.4 per cent in the CPI and 5.2 per cent in the food and beverages group) on a moderating trajectory since September 2021. 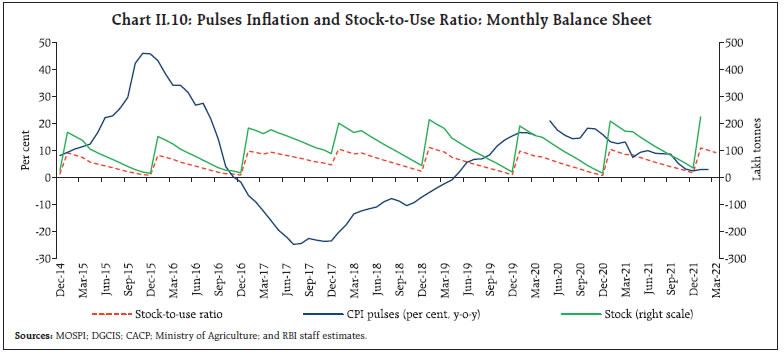 As regards to animal-based protein items, prices declined in the case of meat and fish (weight of 3.6 per cent in the CPI and 7.9 per cent within the food and beverages group) largely during September 2021-January 2022, primarily reflecting easing feed costs with the import of 12 lakh tonnes of genetically modified soya meal and gradual normalisation of supplies. Prices increased in February 2022 due to winter demand. In the case of eggs, price pressures set in during November 2021-January 2022 and eased in February in accordance with the usual seasonal pattern. Inflation in milk and products gradually increased to 4.1 per cent in January 2022, before easing to 3.8 per cent in February 2022 on favourable base effects, due to successive upward revisions in milk prices by milk co-operatives in various states after July 2021, following the increase in prices by around ₹2 per litre by major milk co-operatives like Amul and Mother Dairy. Inflation in prices of oils and fats (weight of 3.6 per cent in the CPI and 7.8 per cent within the food and beverages group) continued to rule in double digits since September 2021 albeit with some moderation on the back of supply-side measures and improved prospects for the rabi crop (rabi oilseeds production was higher by 9.1 per cent as per 2nd AE 2021-22) and moderation in international prices of edible oils (Chart II.11). Some important steps taken to ebb price pressures include imposition of stock limits on edible oils and oilseeds pan India, except for six states (Bihar, Himachal Pradesh, Karnataka, Rajasthan, Telangana and Uttar Pradesh which imposed their own stock limit order) up to June 30, 2022, and significant reduction in import duty in a gradual manner on palm oil, soyabean oil and sunflower oil. Overall, during the period from October 2021 to February 2022, the effective import duty on the three major imported crude edible oils, viz. palm oil, soyabean oil and sunflower oil, was reduced by 19.25 percentage points to a weighted average of 5.5 per cent. During the same period, the effective import duty of RBD palmolein/ RBD palm oil and refined soyabean/ sunflower oil was also reduced by 22.0 percentage points and 16.5 percentage points, respectively, to 13.75 and 19.25 per cent. 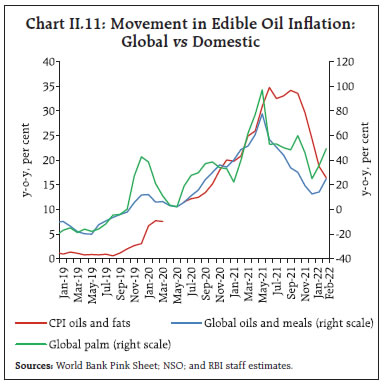 Prices of sugar and confectionery (weight of 1.4 per cent in the CPI and 3.0 per cent in the food and beverages group) emerged out of deflation in September 2021 and averaged 5.2 per cent during September 2021 to February 2022, reflecting, higher exports (54.0 per cent y-o-y in April 2021-January 2022, as per DGCIS), the government’s enhanced target of 10 per cent ethanol blending (against 8.5 per cent earlier) and adverse base effects. Prices declined during December 2021-February 2022 due to the onset of domestic production season, coupled with the decision to extend the sale of unsold sugar quota of previous months in November 2021 and January 2022 and moderation in international sugar prices since December 2021. Among other food items, prices hardened in the case of prepared meals, driven by cooked meals and cooked snacks as increased input costs fed through. For non-alcoholic beverages, tea prices rose on lower production and higher consumption. In the case of spices, price pressures emerged since December 2021 on account of production shortfalls. Retail Margins The retail price margin8, defined as the difference of retail and wholesale prices, for cereals, pulses, and edible oil remained elevated till March 2022. On the other hand, margins in the case of vegetables softened, particularly for tomatoes, as per the seasonal pattern, but remained higher than in the past (Chart II.12). Impact of the Russia Ukraine War on Domestic Food Prices The Russia-Ukraine conflict poses considerable upside risks to prices of key food items. Even as adverse spillovers through direct trade remain limited (Chapter III), the Russia-Ukraine war may have a significant impact on inflation through the global commodity markets channel (Chapter V). In the case of edible oils, the loss of supplies of sunflower oil from Black Sea region is likely to keep domestic prices under pressure. The Black Sea region accounts for around 75 per cent of global production of sunflower oil and is a key supplier to India. The situation is being compounded by the tightness in global soybean market and the increase in export levies as well as export restrictions by key producing countries. On the other hand, the significant increase in domestic mustard production is likely to provide some cushion to the price pressures. Russia and Ukraine account for about a quarter of global wheat exports. Since the beginning of the Ukraine war, international wheat prices have soared. India is not an importer of wheat, but exports from India have picked up sharply in the current year (336.8 per cent y-o-y during April 2021-January 2022). Therefore, international prices could set a floor for domestic wheat prices through the export channel, even if domestic prices do not move in sync with global prices. However, ample stocks along with a bumper production may help to keep any price increase range bound. Fuel Fuel inflation surged from 12.9 per cent in August 2021 to 13.6 per cent in September and further to 14.3 per cent in October, reaching new peaks in these three consecutive months (Chart II.13a). The key driver of this pick-up was the sharp rise in international prices of kerosene and liquefied petroleum gas (LPG) and its transmission to domestic prices (Chart II.13b and c). From November, fuel inflation moderated sequentially to 8.7 per cent in February 2022, enabled by the abrupt slip in electricity prices to deflation since November and LPG prices remaining unchanged since October 2021. Kerosene prices moderated during December 2021-January 2022, reflecting the fall in international prices. In February, as international prices picked up and pass-through became evident, domestic prices also registered a sharp increase. LPG prices were also increased by ₹50 per cylinder on March 22, 2022. Core Core inflation, i.e., CPI inflation excluding food and fuel, remained elevated at around 6 per cent in 2021-22 as relentless cost-push pressures impinged on goods and services selling prices (Table II.1). | Table II.1: Exclusion-based Measures of Inflation (y-o-y) | | Period | Exclusion based measures | | CPI excluding food and fuel (47.3) | CPI excluding food fuel petrol diesel (45.0) | CPI excluding food fuel petrol diesel gold silver (43.8) | | Jun-19 | 4.1 | 4.6 | 4.6 | | Sep-19 | 4.2 | 4.9 | 4.5 | | Dec-19 | 3.8 | 3.7 | 3.3 | | Mar-20 | 3.9 | | | | Jun-20 | 5.4 | 5.3 | 4.6 | | Sep-20 | 5.4 | 5.2 | 4.5 | | Dec-20 | 5.6 | 5.3 | 4.7 | | Jan-21 | 5.5 | 5.2 | 4.7 | | Feb-21 | 6.0 | 5.5 | 5.1 | | Mar-21 | 5.9 | | | | Apr-21 | 5.3 | | | | May-21 | 6.6 | | | | Jun-21 | 6.1 | 5.3 | 5.4 | | Jul-21 | 5.8 | 5.1 | 5.3 | | Aug-21 | 5.8 | 5.1 | 5.6 | | Sep-21 | 5.9 | 5.2 | 5.6 | | Oct-21 | 5.9 | 5.0 | 5.4 | | Nov-21 | 6.2 | 5.5 | 5.7 | | Dec-21 | 6.1 | 5.6 | 5.9 | | Jan-22 | 6.0 | 5.6 | 5.8 | | Feb-22 | 5.8 | 5.6 | 5.7 | Note: (1) Figures in parentheses indicate weights in CPI.
(2) Derived as residual from headline CPI.
Sources: NSO; and RBI staff estimates. | Core inflation was sticky and higher than in the pre-COVID period during 2021-22, with elevated core price pressures coexisting with significantly lower volatility than a year ago (Chart II.14). A comparative assessment of the drivers of core inflation in 2021-22 (April-February) vis-à-vis pre-COVID years (i.e., 2017-18 to 2019-20) and 2020-21 (June 2020 to March 20219) shows that core goods as well as core services inflation were higher in 2021-22. Also, inflation rates across core sub-groups, barring housing and education, were higher than in 2020-21. Transport and communication, in addition to health, remained the key drivers, as in 2020-21. While the contribution of clothing and footwear to overall core inflation edged up sharply in 2021-22, the contribution of personal care and effects declined (Chart II.15). 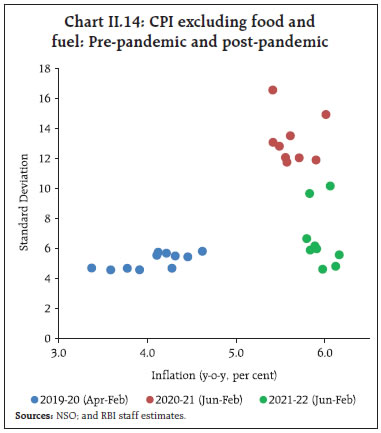
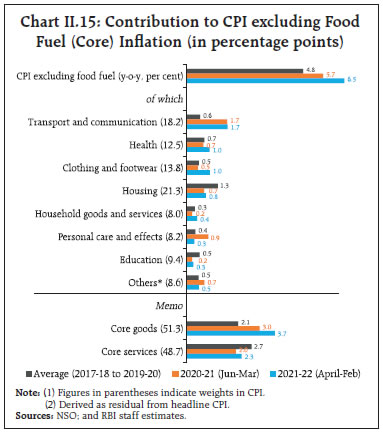 A key source of core inflationary pressures during September 2021 to February 2022 has been petrol and diesel. Some softening since November was facilitated by the cut in central excise duties on petrol by ₹5 per litre and on diesel by ₹10 per litre on November 4, 2021 along with a reduction in State VATs in petrol and/or diesel by 28 States/ UTs during November-December 2021. As a result, pump prices scaled down from historic highs recorded during November 1-3, 2021. However, Oil Marketing Companies (OMCs) after adjusting for the tax cuts kept the retail selling prices unchanged till the third week of March, even as international crude oil prices exhibited two-way movement – a moderation during December 2021 before reversing course since early January 2022 and a precipitous rise from end-February on Russia-Ukraine conflict (Chart II.16). Since March 22, with OMCs commencing the pass-through of high international crude oil prices to domestic pump prices, petrol and diesel retail selling prices have registered a cumulative increase of around ₹10 per litre in 14 revisions so far (till April 6, 2022). Various measures of core inflation have remained elevated in a range of 5.0-6.2 per cent during September 2021-February 2022 (Table II.1). Decomposing CPI excluding food, fuel, petrol, diesel, gold and silver into its goods and services components points to contrasting movements. Inflation in the goods component (with a weight of 20.7 per cent in the headline CPI) increased consecutively from August 2020, reaching 7.0 per cent in November 2021 and plateauing thereafter. This was driven primarily by clothing and footwear – readymade garments and uniforms; health care goods —medicines, household goods and personal care items and toiletries (Chart II.17a). On the other hand, services inflation (with a weight of 23.0 per cent in the headline CPI) which was at 4.5 per cent in August 2021, softened to 4.2 per cent in October before firming up to 4.7 per cent during December 2021-February 2022 (Chart II.17b). The pick-up in services inflation was on account of the transport and communication sub-group, coming from an increase in mobile telephone charges during December 2021-January 2022. The contribution of household services (which includes domestic servant/cook/sweeper charges, monthly maintenance charges) and recreation and amusement services (cinema; club; hotel lodging charges) also increased during this period. The contribution of services to core inflation continued to remain lower, on an average, than what was seen in the pre-pandemic period, particularly on account of relatively subdued growth in house rentals (Chart II.15). 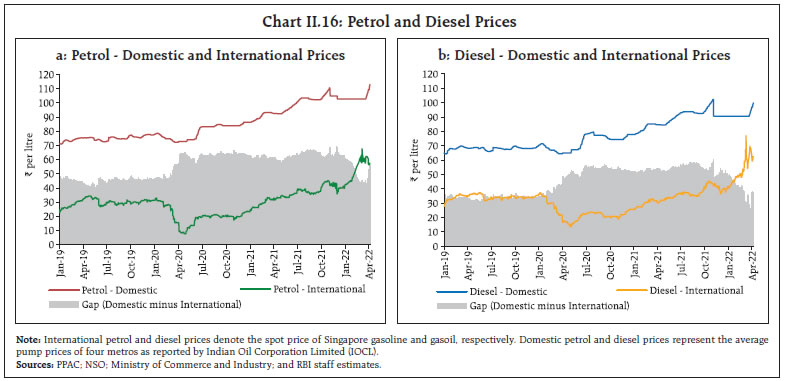
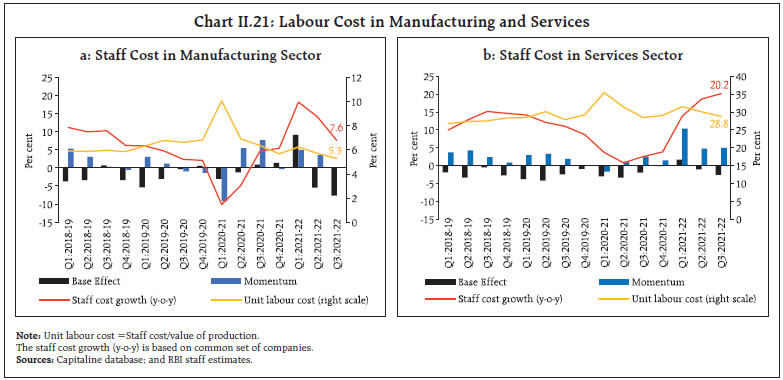
 In order to filter noise out of CPI inflation, two common approaches are (i) excluding a fixed set of components from the CPI basket that display volatile price movements, and (ii) excluding different components each month if they are located in the tails of the inflation distribution. The exclusion-based measures show high and persistent inflationary pressures during September 2021-February 2022 (Table II.1). Inflation measured by trimmed means also edged up during this period (Table II.2). | Table II.2: Trimmed Mean Measures of Inflation (y-o-y) | | Month | 5% trimmed | 10% trimmed | 25% trimmed | Weighted Median | | Jun-19 | 3.0 | 3.1 | 3.0 | 2.8 | | Sep-19 | 3.3 | 3.2 | 3.1 | 2.8 | | Dec-19 | 4.4 | 4.0 | 3.7 | 4.0 | | Mar-20 | | | | | | Jun-20 | 5.8 | 5.4 | 5.1 | 4.9 | | Sep-20 | 6.2 | 5.6 | 4.7 | 5.1 | | Dec-20 | 5.6 | 5.1 | 4.3 | 4.0 | | Jan-21 | 5.0 | 4.8 | 4.0 | 3.6 | | Feb-21 | 5.1 | 4.9 | 4.1 | 3.7 | | Mar-21 | | | | | | Apr-21 | | | | | | May-21 | | | | | | Jun-21 | 5.7 | 5.2 | 5.0 | 5.2 | | Jul-21 | 5.8 | 5.3 | 5.0 | 4.6 | | Aug-21 | 5.5 | 5.1 | 4.9 | 4.3 | | Sep-21 | 5.0 | 4.9 | 4.8 | 4.3 | | Oct-21 | 5.2 | 4.9 | 4.7 | 4.6 | | Nov-21 | 5.5 | 5.1 | 5.0 | 5.0 | | Dec-21 | 5.8 | 5.4 | 5.2 | 4.7 | | Jan-22 | 5.9 | 5.6 | 5.3 | 5.1 | | Feb-22 | 6.0 | 5.7 | 5.3 | 5.6 | | Sources: NSO; and RBI staff estimates. | Other Measures of Inflation Inflation measured by sectoral CPIs for agricultural labourers (CPI-AL) and rural labourers (CPI-RL) has persisted below CPI headline inflation for the past 20 months. By February 2022, however, the extent of divergence gradually narrowed. Both food and fuel inflation were generally lower in the CPI-AL and CPI-RL vis-à-vis CPI, resulting in lower inflation prints. Inflation in terms of the CPI for industrial workers (CPI-IW) has moved broadly in line with the headline CPI during September to January 2022. In February 2022, however, there was a substantial divergence on account of lower food inflation in CPI-IW vis-à-vis headline CPI. WPI inflation, which was in double digits since the start of 2021-22, edged up further since September 2021, reaching an all-time high of 14.9 per cent (as per the WPI series, 2011-12=100) in November 2021. A sharp and broad-based surge in price momentum, despite strong favourable base effects, drove the pick-up in WPI inflation. Persistently high WPI core10 inflation, which remained in double digits from May to December 2021, reflected high commodity and input price pressures as well as supply-side disruptions. WPI inflation moderated somewhat to 14.3 per cent and further to 13.0 per cent in December 2021 and January 2022, respectively, before picking up marginally to 13.1 per cent in February 2022. In line with WPI inflation, the deflators for gross value added (GVA) and gross domestic product (GDP) remained elevated between Q1:2021-22 to Q3:2021-22. In H2:2021-22, WPI and CPI inflation have diverged markedly (Chart II.18a). During September 2021 to February 2022, all the major subgroups of WPI, namely, food, fuel and excluding food and fuel (core) remained substantially above the corresponding subgroups in the CPI. Year-on-year growth in prices of petrol and diesel diverged considerably between CPI and WPI (Chart II.18b) as the CPI, which records prices inclusive of taxes, moderated following the reduction in excise duties and State VATs in November-December 2021. Among food sub-groups, fruits and eggs registered higher price increases on a y-o-y basis in the WPI relative to the CPI. In the WPI, vegetable inflation remained elevated whereas in the CPI, prices of vegetables recorded deflation during September-December 2021, before turning up. II.3 Costs Costs, as measured by WPI inflation in industrial raw materials and farm inputs, remained elevated during H2:2021-22 (Chart II.19). Disruptions in global supply chain in the form of logistics bottlenecks, increase in shipping costs, and longer delivery times resulted in input cost pressures. The firming up of global crude oil prices was the main factor that impacted the prices of industrial inputs such as naphtha, aviation turbine fuel, bitumen, petroleum coke and furnace oil. They also contributed to double-digit inflation in high-speed diesel, which in turn drove up farm input price inflation. Other contributory factors comprise fertiliser prices that edged up in sympathy with international prices, and prices of some non-food articles that remained in double digits – raw cotton and oilseeds. Price of electricity – a key input in both industrial and farm inputs – also increased sharply during the period in line with revival in demand. Inflation in industrial raw materials and farm inputs, however, eased during December 2021-January 2022 on account of softer prices of petroleum products but picked up again in February 2022 amidst rising international prices and heightened geopolitical uncertainties. 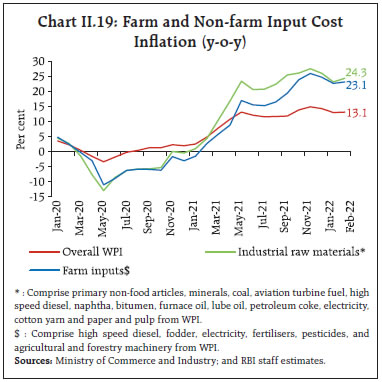 The ongoing conflict in the Black Sea region and ensuing sanctions have hampered global supply chains and have also sent prices soaring with aluminium and nickel prices rising to highest level in the last decade. Russia is one of the largest producers of aluminium, widely used in transportation and construction industry, and of nickel, mostly used for high grade steel manufacturing and in batteries. Further geopolitical tension in the region is likely to aggravate global chip shortage and could impact prices of vehicles and electronic products. Nominal rural wages for both agricultural and non-agricultural labourers picked up during H2:2021-22, with easing of restrictions/lockdowns imposed by states and restoration in economic activity. However, the wage growth remained soft (Chart II.20). In the organised sector, staff cost growth (y-o-y) for both manufacturing and services picked up in Q1 of 2021-22 but decelerated for manufacturing and remained steady for services in the next two quarters, with softer momentum in Q2 and Q3. Unit labour costs also moderated in Q3:2021-22 owing to the sharp increase in growth in value of production of the listed firms both in manufacturing and services vis-à-vis staff costs during Q2 and Q3:2021-22 (Chart II.21a and b). 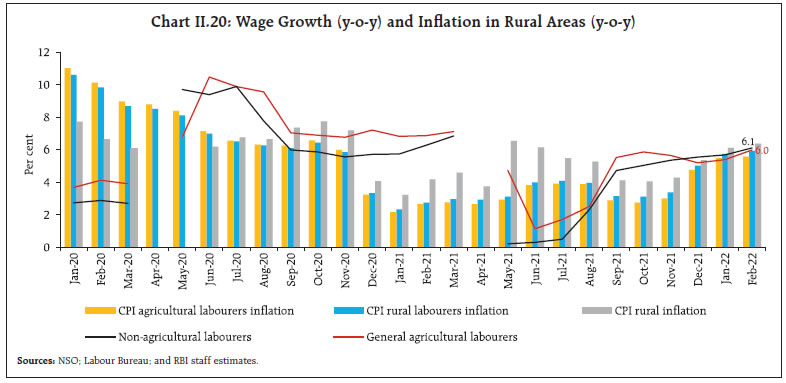
 Manufacturing firms polled for the purchasing managers’ index (PMI) reported a sustained increase in input prices in March 2022. Also, the PMI services sector reported continued increase in input prices till March 2022 with firm momentum, mainly driven by higher fuel, raw material, chemical, retail, vegetable and transportation costs. However, the pace of output prices for both manufacturing and services sectors so far remained modest as compared to input prices, reflecting restricted pass-through amidst firms’ limited pricing power due to the prevalent slack in the economy (Box II.1). Box II.1: An Analysis of Sensitivity of Output Prices to Input prices Input cost prices have been rising during 2021-22, though its pass-through to output prices has remained muted in view of the continuing slack in demand (Patra, 2022). The gap between input and output prices has remained wide during 2021-22 (Chart II.1.1). In advanced economies like the United States and the Euro area, pricing power of firms has increased significantly against intense pressures from elevated input prices and in the presence of strong demand (Vijlder, 2022). In the Indian context, PMI price indices have significant predictive power about changes in wholesale price inflation (WPI) (Khundrakpam and George, 2013) 11. Granger causality tests using monthly data from January 2011 to February 2022 confirm that PMI input prices do influence output prices and core CPI, a measure of inflation exclusive of volatile components i.e., food and fuel, with no evidence of reverse causality12. To further examine the strength of the relationship, ordinary least squares (OLS) and autoregressive distributed lag (ARDL) models are used depending upon the degree of integration of the variables.13 Empirical analysis in an OLS framework suggests pass-through from lagged PMI composite input prices to corresponding output prices, after controlling for future output14 (Table II.1.1a). The pass-through is, however, less than complete, reflecting, inter alia, the role of other demand side factors. Analysis of PMI composite input prices and core CPI inflation along with PMI future output for the period April 2012 to February 2022 in an ARDL model of co-integration, which allows for use of variables of different degrees of integration, confirms the existence of a long run co-integrating relationship (Table II.1.1b). The long run pass-through coefficient from PMI input prices to core CPI at 0.11 is modest. | Table II.1.1: Empirical Results: Input to Output prices | | a. OLS: Composite PMI Input to Output prices | b. ARDL: Composite PMI Input prices to Core CPI | | Dependent Variable: Output prices | Bounds test for Co-integration@ | F-statistic | 3.50* | | Constant | 31.213***
(0.00) | Note: “Ho: No Co-integration”; “H1: There is long run co-integrated relationship”;
@: Future output as a control; Conventional significance based on F-statistics as extracted from Narayan (2005). | | Input Prices (lagged) | 0.233***
(0.00) | | Future Output | 0.130***
(0.00) | | Dum_Apr20 | -9.563***
(0.00) | Long run estimation
(Dependent variable: Core CPI) | | Adjusted R-square | 0.74 | PMI input prices | 0.108***
(0.00) | Note: ***, ** and * indicate the rejection of the null hypothesis at 1, 5 and 10 per cent levels of significance. Figures in parenthesis are p-values. The ARDL models are chosen based on automatic selection by AIC criteria. OLS model is with four lags.
The results are estimated for period: April 2012-Febraury 2022.
Source: RBI staff estimates. | References: Khundrakpam, J. K., & George, A. T., (2013), “An Empirical Analysis of the Relationship between WPI and PMI-Manufacturing Price Indices in India”, Reserve Bank of India, WPS (DEPR):06 Patra, M.D. (2022), “Taper 2022: Touchdown in Turbulence” speech at the IMC Chamber of Commerce and Industry”, March. Vijlder, W., (2022), “Companies’ Pricing Power and the Inflation Outlook”, BNP Paribas. | The salary outgo for the manufacturing, services and infrastructure firms polled in Reserve Bank’s enterprise surveys15 reported an increase in Q3:2021-22. For manufacturing firms, the pace of increase moderated in Q4:2021-22 and expected to pick up again in Q1:2022-23, but in the case of services and infrastructure firms, it is expected to moderate in Q1:2022-23. Input cost pressures remained elevated for manufacturing, services and infrastructure firms during Q3 and Q4:2021-22. During Q1:2022-23, manufacturing input costs are expected to remain elevated while some moderation in pace of increase may occur for services and infrastructure firms. Manufacturing firms may charge higher selling prices in Q1:2022-23, vis-à-vis their services and infrastructure sector counterparts (Chart II.22). One year ahead business inflation expectations16 polled by the Indian Institute of Management, Ahmedabad, rose sequentially, crossing 6 per cent in February 2022. The businesses polled in the survey reported further heightening of cost pressures, which along with weak demand conditions impacted profit margins of the sampled firms. 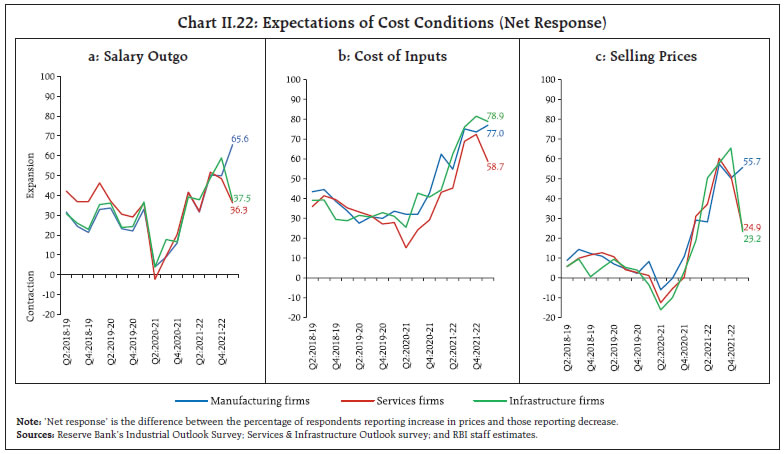 II.4 Conclusion Recent geopolitical events have accentuated upside risks to inflation. Global supply shocks are still unfolding and their ambit across commodities is widening. Input costs, including energy costs, for various manufacturing goods and services are also likely to go up. The impact of recent events will also be conditioned by the outlook for aggregate demand going forward. Persistent commodity price pressures along with the resurgence of global supply chain and logistics disruptions pose risk of their pass-through to domestic inflation. Though the pass-through so far has been limited due to weak demand conditions, going forward it may need to be monitored carefully. The headroom available for supply side measures remain critical to limit the extent of transmission of adverse cost conditions onto retail prices of goods and services. _______________________________________________________________________________________________
III. Demand and Output The recovery in aggregate demand lost some momentum in H2:2021-22 with the emergence of the Omicron variant. External demand remained buoyant. The intensification of geopolitical tensions, the surge in global oil and commodity prices to multi-year highs and intense financial market volatility pose significant downside risks to global economic activity and could have spillovers on domestic growth prospects. The recovery in aggregate demand that had resumed with the ebbing of the second wave of the pandemic lost some momentum in H2:2021-22 with the emergence of the Omicron variant. Although more transmissible, the third wave turned out to be less severe and short-lived relative to the second wave (Chart III.1). As a result, GDP in H2 is estimated to be higher by 6.8 per cent than the corresponding pre-pandemic levels, with the demand for contact-intensive activities impacted in December 2021-January 2022 and the informal sector and micro, small and medium enterprises (MSMEs) still lagging. External demand, on the other hand, remained buoyant, with merchandise exports clocking double-digit growth for the thirteenth month in a row in March 2022. On the aggregate supply side, manufacturing weakened in the face of headwinds from persisting global supply bottlenecks and muted discretionary consumption and investment spending domestically. In contrast, agriculture and allied activities remained buoyant on the back of a record kharif production and expansion in sowing acreage in the rabi season relative to a year ago. 
| Table III.1: Real GDP Growth | | (y-o-y, per cent) | | Item | 2020-21 | 2021-22 | Weighted Contribution* | 2020-21 | 2021-22 | | (FRE) | (SAE) | 2020-21 | 2021-22 | Q1 | Q2 | Q3 | Q4 | Q1 | Q2 | Q3 | Q4# | | Private final consumption expenditure | -6.0 | 7.6 | -3.4 | 4.4 | -23.7 | -8.3 | 0.6 | 6.5 | 14.2 | 10.2 | 7.0 | 1.5 | | | | (1.2) | | | | | | | (-13.0) | (1.1) | (7.6) | (8.1) | | Government final consumption expenditure | 3.6 | 4.8 | 0.4 | 0.5 | 13.6 | -22.9 | -0.3 | 29.0 | -4.4 | 9.3 | 3.4 | 11.7 | | | | (8.6) | | | | | | | (8.6) | (-15.8) | (3.1) | (44.0) | | Gross fixed capital formation | -10.4 | 14.6 | -3.3 | 4.4 | -45.3 | -4.5 | -0.6 | 10.1 | 62.5 | 14.6 | 2.0 | 1.3 | | | | (2.6) | | | | | | | (-11.2) | (9.5) | (1.4) | (11.5) | | Exports | -9.2 | 21.1 | -1.8 | 4.0 | -25.5 | -6.4 | -8.6 | 3.7 | 40.4 | 20.5 | 20.9 | 7.8 | | | | (9.9) | | | | | | | (4.6) | (12.7) | (10.5) | (11.8) | | Imports | -13.8 | 29.9 | -3.2 | 6.3 | -41.1 | -17.9 | -5.2 | 11.7 | 60.7 | 40.7 | 32.6 | 1.3 | | | | (11.9) | | | | | | | (-5.3) | (15.5) | (25.8) | (13.2) | | GDP at market prices | -6.6 | 8.9 | -6.6 | 8.9 | -23.8 | -6.6 | 0.7 | 2.5 | 20.3 | 8.5 | 5.4 | 4.8 | | | | (1.8) | | | | | | | (-8.3) | (1.3) | (6.2) | (7.4) | Note: *: Component-wise contributions to growth do not add up to GDP growth because change in stocks, valuables and discrepancies are not included.
Figures in parentheses are growth rates over 2019-20. FRE: First revised estimates; SAE: Second advance estimates. #: Implicit.
Source: National Statistical Office (NSO). | III.1 Aggregate Demand Aggregate demand, measured by real gross domestic product (GDP), decelerated to 5.4 per cent year-on-year (y-o-y) in Q3:2021-22 (Table III.1 and Chart III.2a). All its major constituents surpassed their pre-pandemic levels, as recovery gained traction. With the fast ebbing of the third wave, the demand for contact-intensive services also recovered in February-March 2022. For the financial year 2021-22, real GDP is estimated to have risen by 8.9 per cent, taking its level 1.8 per cent above that recorded in 2019-20. Private consumption and government expenditure were the key drivers of aggregate demand in H2 (Chart III.2b). The negative contribution of net exports to aggregate demand moderated. GDP Projections versus Actual Outcomes The October 2021 Monetary Policy Report (MPR) had projected real GDP growth at 7.9 per cent for Q2:2021-22, 6.8 per cent for Q3 and 6.1 per cent for Q4. Actual growth in Q2 overshot the projection by 60 basis points (bps) while it undershot the projection by 140 bps in Q3 (Chart III.3). These upside and downside surprises stemmed mainly from a stronger than expected release of pent-up demand and a pick-up in investment on the back of government capex in Q2, followed by a loss of momentum in Q3. Data for Q4:2021-22 are scheduled for release by the NSO on May 31, 2022. III.1.1 Private Final Consumption Expenditure Private final consumption expenditure (PFCE) – the mainstay of aggregate demand – regained some traction, but its share in overall GDP dropped to 56.6 per cent in 2021-22 from 57.3 per cent in the previous year, weighed down by incomplete recovery in the labour force participation rate, the third wave and weak consumer confidence (Box III.1). The sluggish recovery in the informal sector and among MSMEs also restrained private consumption. Expanding vaccination coverage, and relaxation of restrictions on mobility and activity enabled a recovery in demand for contact-intensive services such as air travel, hotels and restaurants, recreation and culture in February-March 2022. 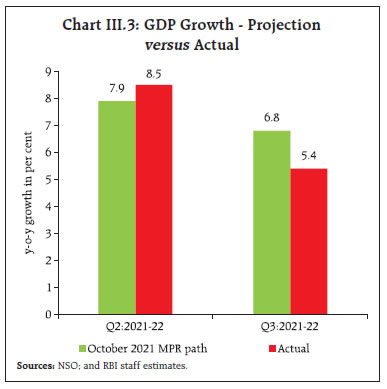
Box III.1: Drivers of Private Consumption Income, wealth, inflation, interest rate and consumer confidence are potential determinants of private consumption (Singh, 2012; Vihriälä, 2017; Wong, 2017; Dossche, et. al., 2018). According to unit root tests, private consumption and income (real GDP) are non-stationary1. For the pre-pandemic period, i.e., 2004-19, quarterly data indicate a long-run co-integrating relationship between real private consumption and income2. The short-run error-correction dynamics points to the role of the cyclical factors – lower interest rates and lower inflation support consumption demand, attesting to a role of accommodative monetary policy. Going ahead, given the long-run relationship, consumption can be expected to recover with rising incomes. References: Dossche, M., M Forsells, L Rossi, G Stoevsky (2018), “Private Consumption and its Drivers in the Current Economic Expansion”, Economic Bulletin, European Central Bank. Singh, Bhupal (2012), “How Important is the Stock Market Wealth Effect on Consumption in India?”, Empirical Economics, Vol. 42, pp. 915-927. Vihriälä, E. (2017), “Household Consumption in Japan- Role of Income and Asset Developments”, IMF Working Paper WP/17/23. Wong, M. (2017), “Revisiting the Wealth Effect on Consumption in New Zealand”, Reserve Bank of New Zealand Analytical Note, AN2017/03. | Urban consumption was lifted by a recuperation in domestic air passenger traffic, especially during February-March, and a moderation in the contraction of passenger vehicle sales that had been hit by shortages in respect of semi-conductor chips (Chart III.4). Consumer durables production, on the other hand, fell in Q3 and January due to subdued discretionary spending. As regards rural demand, sales of two-wheelers recorded y-o-y contraction during H2, indicative of pressures on discretionary household spending and slow recovery in the informal sector. Tractor sales were lower during November-February partly due to protracted and heavy precipitation in some areas. Fertiliser sales also remained lower during January- February, reflecting inventory de-stocking and lower imports amidst rising international prices. Consumer non-durables production, on the other hand, rebounded in January 2022 (Chart III.5). Consumer pyramids household survey data of the CMIE show that the labour force participation rate (LFPR) fell from 40.9 per cent in December to 39.5 per cent in March 2022; the unemployment rate, however, dropped from 7.9 per cent to 7.6 per cent over the same period and remained lower than the levels recorded during the first and second waves (Chart III.6a). Employment conditions improved in Q3 and January in the organised sector (Chart III.6b). III.1.2 Gross Fixed Capital Formation Gross fixed capital formation (GFCF) expanded by 14.6 per cent in 2021-22 on the back of a favourable base (-10.4 per cent in 2020-21) and its share in GDP rose marginally to 32.0 per cent as against 31.8 per cent in 2019-20. In H2, however, investment activity weakened, driven down by sluggish construction activity (reflected in steel consumption and cement production) due to unseasonal rains, rising input costs and shortage of manpower (Chart III.7). The domestic production of capital goods slipped into contraction in Q3:2021-22 and January 2022, weighing on overall investment activity, even as imports of capital goods expanded during Q3 and Q4.
Capacity utilisation (CU) in the manufacturing sector recovered to 72.4 per cent in Q3:2021-22 from 68.3 per cent in the previous quarter (72.2 per cent from 68.6 per cent on a seasonally adjusted basis) (Chart III.8); it reached the pre-pandemic levels, although it was below the long-period average. The interest coverage ratio (ICR)3 of listed non-financial private companies in the manufacturing and information technology (IT) sectors remained steady in Q3:2021-22 (Chart III.9). Stronger corporate balance sheets – comfortable ICR and deleveraging – can be expected to support capacity expansion further (Box III.2). Under the production-linked incentives (PLI) scheme, the government approved a programme of ₹2.3 lakh crore to position India as a global hub for electronics manufacturing. Gati Shakti – the National Master Plan for Multi-modal Connectivity – incorporates the infrastructure schemes of various Ministries and State Governments such as Bharatmala, Sagarmala, inland waterways, dry/land ports and UDAN for integrated planning and coordinated implementation of infrastructure connectivity projects. The multi-modal plan will help improve India’s logistics network and competitiveness, providing integrated and seamless connectivity for the movement of people, goods and services from one mode of transport to another. Box III.2: Private Sector Investment Cycle Drivers: An Investigation with Firm-Level Data A revival in the investment cycle is vital for ensuring a durable recovery. Despite congenial financial conditions and a strengthening of corporate balance sheets – moderation in listed firms’ leverage in terms of debt/asset and debt/equity ratios – private investment remains weak in India (Chart III.2.1). Using a panel data of a common set of 1,054 listed nongovernment non-financial (NGNF) companies over the past twenty half year periods (H2:2011-12 to H1:2021-22), it is observed that firm-specific factors – leverage (measured by either debt to total assets or debt to equity); demand conditions (own sales); internal resources and funding costs (own cash flows and effective cost of borrowings); and size of the firm have diverse effects on investment. Leverage exerts a negative impact on fixed investment, while demand in terms of own sales and cash flows has a positive effect (Table III.2.1). The cost of borrowings dampens investment, and firm size has a negative impact on capacity expansion (i.e., the small-sized firms add more to their existing capital stock compared with large-sized firms). Aggregate demand conditions in the economy, especially expected growth prospects, have a positive and statistically significant impact. References: Das, S., and V. Tulin (2017), “Financial Frictions, Underinvestment, and Investment Composition: Evidence from Indian Corporates”, IMF Working Paper, WP/17/134. Shukla, A. K., and T. S. Shaw (2020), “Impact of Leverage on Firms’ Investment: Decoding the Indian Experience”, RBI Working Paper, WPS 07/2020. Table III.2.1: Panel Regression Results
(Period: H1:2012-13 – H1:2021-22) | | Dependent Variable: Investment growth | All Listed NGNF Companies | Manufacturing | | Constant | 13.458*** | 16.724*** | 16.388*** | 21.900*** | | | (3.506) | (4.088) | (4.370) | (4.947) | | Debt to total assetst-1 | -0.119*** | | -0.101*** | | | Debt to equityt-1 | (0.019) | -0.024*** | (0.023) | -0.021*** | | | | (0.005) | | (0.006) | | Demandt-1 | 0.006*** | 0.006*** | 0.008*** | 0.008*** | | | (0.001) | (0.001) | (0.001) | (0.001) | | Cash flowt-1 | 0.016*** | 0.016*** | 0.039*** | 0.044*** | | | (0.005) | (0.005) | (0.008) | (0.009) | | Cost of borrowingst-1 | -0.048*** | -0.041*** | -0.037* | -0.038* | | | (0.016) | (0.016) | (0.020) | (0.021) | | Sizet-1 | -2.849*** | -3.665*** | -3.239*** | -4.390*** | | | (0.611) | (0.724) | (0.720) | (0.829) | | Real GDP growtht-1 | 0.150*** | 0.138*** | 0.127*** | 0.104*** | | | (0.027) | (0.029) | (0.032) | (0.034) | | Expected growtht+1 | 0.504*** | 0.588*** | 0.485*** | 0.609*** | | | (0.108) | (0.115) | (0.114) | (0.120) | | WPI inflationt-1 | 0.127** | 0.137*** | 0.075 | 0.093 | | | (0.049) | (0.051) | (0.056) | (0.058) | | Observations | 18,972 | 17,878 | 12,744 | 12,002 | | Number of firms | 1,054 | 1,038 | 708 | 697 | Notes: ***, ** and * indicate statistical significance at 1 per cent, 5 per cent and 10 per cent, respectively. Fixed effect estimates, with robust standard errors in parenthesis. Variables are defined as follows: Demand is annualised sales scaled by the beginning of the period gross fixed assets; cash flow as annualised net profits plus depreciation scaled by the beginning of period gross fixed assets; size is log of total assets; expected growth is taken as one year ahead growth projection from the survey of professional forecasters.
Sources: RBI staff estimates; and Capitaline database. | Wang, J., M. Gochoco and N. Sotocinal (2013), “Corporate Investments in Asian Emerging Markets: Financial Conditions, Financial Development, and Financial Constraints”, ADB Economics Working Paper Series, 346. | The gross domestic saving rate fell to 28.2 per cent in 2020-21 from 29.9 per cent of GDP in 2019-20, dampened by increased dissaving of the government due to a rise in spending to ameliorate the stress of the pandemic (Chart III.10). Net household financial saving inched up to 11.6 per cent of GDP in 2020-21 from 8.0 per cent in 2019-20, driven by the pandemicinduced forced as well as precautionary savings. With the investment rate declining from 30.7 per cent of GDP to 27.3 per cent, the saving-investment gap turned positive in 2020-21 (for the first time since 2004-05), mirrored in a current account surplus recorded in the balance of payments. Net household financial saving rate fell to 10.7 per cent in H1:2021-22 from 14.1 per cent in the same period of 2020-21. III.1.3 Government Consumption The pace of government final consumption expenditure (GFCE) moderated in Q3 on a y-o-y basis due to adverse base effects. Government capital spending, on the other hand, surged in Q3, reflecting the push to infrastructure (Chart III.11). During 2021-22, the fiscal position of the Central Government strengthened (Table III.2 and Chart III.12). The centre’s net tax revenue increased by 21.8 per cent during April-February 2021-22. Corporate tax collections jumped by 61.3 per cent, supported by strong corporate performance while customs duties collections rose by 46.6 per cent on increased imports. Excise duty collections, however, rose relatively modestly by 5.4 per cent, owing to the cut in excise duty on petrol and diesel in November. GST collections surpassed ₹1 lakh crore mark consistently in H2, driven by the revival in economic activity and improved tax compliance (Chart III.12c). Centre's revenue and capital expenditure rose y-o-y by 10.2 per cent and 19.7 per cent, respectively, during April-February 2021-22. | Table III.2: Central Government Finances | | Indicator | Per cent to GDP | | 2019-20 | 2020-21 | 2021-22 (RE) | 2022-23 (BE) | | 1. Revenue receipts | 8.4 | 8.3 | 8.8 | 8.5 | | a. Tax revenue (Net) | 6.8 | 7.2 | 7.5 | 7.5 | | b. Non-Tax revenue | 1.6 | 1.0 | 1.3 | 1.0 | | 2. Non-debt capital receipts | 0.3 | 0.3 | 0.4 | 0.3 | | 3. Revenue expenditure | 11.7 | 15.6 | 13.4 | 12.4 | | a. Interest payments | 3.0 | 3.4 | 3.4 | 3.6 | | b. Major subsidies | 1.1 | 3.6 | 1.8 | 1.2 | | 4. Revenue expenditure excluding interest payments and subsidies | 7.5 | 8.6 | 8.1 | 7.5 | | 5. Capital expenditure | 1.7 | 2.2 | 2.5 | 2.9 | | 6. Capital outlay | 1.6 | 1.6 | 2.3 | 2.4 | | 7. Total expenditure | 13.4 | 17.7 | 15.9 | 15.3 | | 8. Gross fiscal deficit | 4.7 | 9.2 | 6.7 | 6.4 | | 9. Revenue deficit | 3.3 | 7.3 | 4.6 | 3.8 | | 10. Primary deficit | 1.6 | 5.7 | 3.3 | 2.8 | | Sources: Union Budget 2022-23 and RBI staff estimates. | Overall, the centre’s gross tax revenues improved from 10.2 per cent of GDP in 2020-21 to 10.6 per cent in 2021-22 (Table III.3). Higher revenues along with the containment of revenue expenditure contributed to fiscal consolidation in 2021-22.
| Table III.3: Central Government Tax Revenues | | Indicator | Per cent to GDP | | 2019-20 | 2020-21 | 2021-22 (RE) | 2022-23 (BE) | | 1. Direct tax | 5.2 | 4.8 | 5.3 | 5.5 | | (i) Corporation | 2.8 | 2.3 | 2.7 | 2.8 | | (ii) Income | 2.5 | 2.5 | 2.6 | 2.7 | | 2. Indirect tax | 4.8 | 5.4 | 5.3 | 5.1 | | (i) GST | 3.0 | 2.8 | 2.9 | 3.0 | | (ii) Customs | 0.5 | 0.7 | 0.8 | 0.8 | | (iii) Excise | 1.2 | 2.0 | 1.7 | 1.3 | | 3. Gross tax revenue (1+2) | 10.0 | 10.2 | 10.6 | 10.7 | | 4. Net tax revenue | 6.8 | 7.2 | 7.5 | 7.5 | Note: BE: Budget Estimates. RE: Revised Estimates.
Source: Union Budget, 2022-23. | The central government’s revenue expenditure excluding interest and subsidy payments is budgeted to fall to 7.5 per cent in 2022-23 – back to the pre-pandemic position – from 8.1 per cent of GDP in 2021-22 (Table III.2). Capital expenditure increased to 2.5 per cent in 2021-22 from 2.2 per cent of GDP in 2020-21 and is budgeted to rise further to 2.9 per cent in 2022-23, reflecting the government’s emphasis on public infrastructure such as road transport, railways. The centre’s market borrowing programme for 2021-22 remained at elevated levels for the second successive year (Table III.4). Ample surplus liquidity, open market operations (OMO), including the secondary market government securities acquisition programme (GSAP), facilitated the completion of the borrowing calendar in a non-disruptive manner at a weighted average cost of 6.28 per cent in 2021- 22 (5.79 per cent in 2020-21). The weighted average maturity of the central government issuances was further elongated to a record 16.99 years in 2021- 22 from 14.49 years during 2020-21. States’ gross borrowings of ₹7.02 lakh crore were completed at a weighted average cost of 6.97 per cent during 2021- 22 (6.52 per cent in 2020-21). | Table III.4: Centre’s Borrowings | | (₹ Lakh Crore) | | Item | 2019-20 | 2020-21 | 2021-22 (RE) | 2022-23 (BE) | | I Net borrowings (G-Sec) | 4.7 | 10.4 | 7.8 | 11.1 | | Repayments | 2.4 | 2.3 | 2.7 | 3.8 | | Gross borrowings (G-Sec) | 7.1 | 12.6 | 10.5 | 14.9 | | II T-Bills/Cash management bills (Net) | 1.5 | 2.0 | 1.0 | 0.5 | | III Net market borrowings (I+II) | 6.2 | 12.4 | 8.8 | 11.6 | | IV Securities against small savings | 2.4 | 4.8 | 5.9 | 4.3 | | V State provident fund | 0.1 | 0.2 | 0.2 | 0.2 | | VI Other receipts | 0.4 | 0.1 | -0.9 | 0.4 | | VII External debt | 0.1 | 0.7 | 0.2 | 0.2 | | VIII Total debt (III to VII) | 9.3 | 18.3 | 14.2 | 16.6 | | IX Drawdown on cash balances | 0.1 | -0.1 | 1.7 | 0.0 | | X Total funding (VIII+IX) | 9.4 | 18.2 | 15.9 | 16.6 | | Sources: Government of India; and RBI staff estimates. | The Union Budget 2022-23 has placed gross market borrowings at ₹14.95 lakh crore (44.2 per cent above the previous year). Taking into account the switch operations conducted on January 28, 2022, the gross market borrowings through dated securities for 2022- 23 are estimated at ₹14.31 lakh crore. In H1:2022-23, gross market borrowings of the central government through dated securities have been planned at ₹8.45 lakh crore, 59.0 per cent of the estimated gross borrowing for the year. The central government has been provided ways and means advances (WMA) limit of ₹1.50 lakh crore for H1:2022-23 for bridging shortterm mismatches between receipts and payments. The WMA limit for state governments has been fixed at ₹47,010 crore with effect from April 1, 2022. III.1.4 External Demand Merchandise exports and imports remained buoyant in H2:2021-22. With the expansion in imports outpacing exports, the trade deficit widened in H2. Exports at US$ 40.4 billion touched a new record in March 2022 and remained above US$ 30 billion for the thirteenth consecutive month (Chart III.13). During 2021-22, merchandise exports at US$ 417.8 billion crossed the target of US$ 400 billion. Merchandise exports were driven by engineering goods, petroleum products, chemicals, gems and jewellery, cotton textiles, and electronic goods (Chart III.14a and b). Ready-made garments, primarily labour-intensive, also contributed positively, reversing the losses observed during April-September 2021. Exports from the Special Economic Zones (SEZs) contribute around 30 per cent to India’s total exports. The Union Budget 2022-23 proposal to replace the Special Economic Zone Act with new legislation is expected to further enhance SEZ exports through efficiency gains from more effective leveraging of the existing infrastructure, reduction in the compliance burden and integration of the SEZs and customs administration. The free trade agreement (FTA) with the United Arab Emirates (UAE) – the second-largest export destination for India – will boost India’s labour-intensive exports such as gems and jewellery, textiles, leather and footwear and engineering goods and pharmaceuticals and enhance India’s market access to the Middle East and African regions. The recently signed Economic Cooperation and Trade Agreement (ECTA) with Australia provides preferential access to India on 100 per cent of Australian tariff lines and is expected to double the bilateral trade to almost US$ 50 billion in five years. 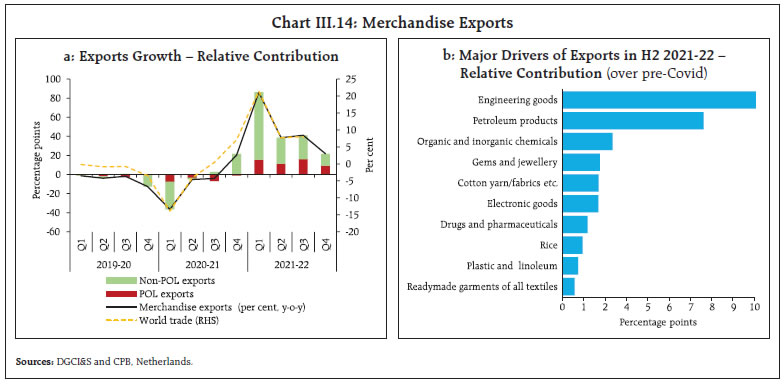 Merchandise imports reached an all-time high of US$ 60.3 billion in December 2021 and remained above US$ 50 billion for the seventh consecutive month in March 2022. During H2:2021-22, oil imports (US$ terms) were higher by 38.5 per cent over the corresponding pre-pandemic period; in volume terms, however, oil imports were still below the pre-pandemic levels. After registering a robust growth for three consecutive quarters, gold imports posted decelerated growth in Q3:2021-22 but contracted during Q4 as festival demand waned (Chart III.15a). The rise in non-oil non-gold imports during H2 was led by electronic goods, coal, coke and briquettes and chemicals (Chart III.15b). The trade deficit widened to US$ 118.2 billion in H2:2021-22 from US$ 76.3 billion a year ago. 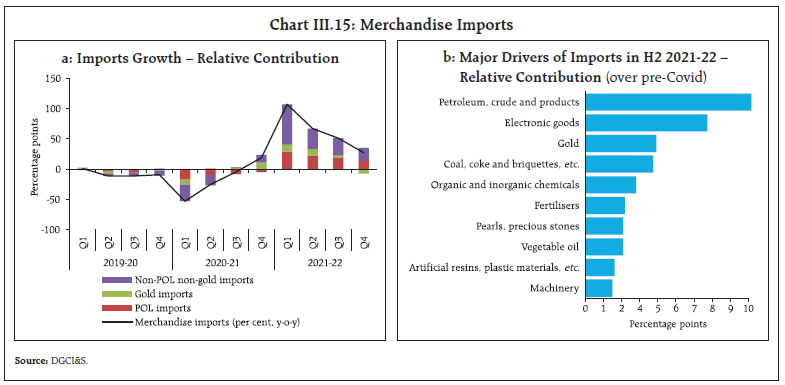 In the context of the recent geopolitical developments, India’s merchandise exports to Russia and Ukraine are only 0.8 per cent and 0.1 per cent of total exports while the corresponding import shares are 1.5 per cent and 0.5 per cent, respectively (Table III.5). The direct spillovers from Russia-Ukraine developments on India’s overall merchandise trade and output are thus expected to be limited although the indirect channels – global slowdown, surge in commodity prices, risk aversion and financial market volatility – could have a more sizeable impact. Services sector trade recovered during 2021-22, surpassing pre-pandemic levels (Chart III.16). Software services, constituting more than 40 per cent of India’s total services exports, exhibited a strong growth in 2021-22 led by banking, financial and insurance services; retail and consumer business; communication, media and technology; and healthcare segments. The migration towards cloud services and the strengthening of infrastructure specifically to meet the pandemic-centric demand significantly aided the sector. The overall growth in the services exports rose to 25.6 per cent in Q3:2021-22 (the highest since Q2:2011-12) and stayed strong in Q4. Inward remittances remained buoyant in Q3:2021-22. Notwithstanding the resilience in the services exports and remittances, the current account deficit rose to 2.7 per cent of GDP in Q3 from 1.3 per cent in Q2 mirroring the widening merchandise trade deficit. | Table III.5: India’s Merchandise Trade with Russia and Ukraine | | (US$ million) | | Commodities | Exports | Commodities | Imports | | 2019 | 2020 | 2021 | 2019 | 2020 | 2021 | | A. Trade with Russia | | Drug formulations, biologicals | 461 | 269 | 503 | Petroleum crude | 1,470 | 781 | 2,306 | | Telecom instruments | 455 | 174 | 384 | Coal, coke and briquettes | 970 | 532 | 1,121 | | Iron and steel | 106 | 93 | 193 | Petroleum products | 440 | 363 | 969 | | Marine products | 100 | 56 | 130 | Pearl and stones | 504 | 316 | 861 | | Bulk drugs & intermediates | 97 | 70 | 118 | Fertilisers manufactured | 458 | 458 | 483 | | Residual chemicals and allied | 66 | 57 | 106 | Project goods | 440 | 318 | 399 | | Auto components | 77 | 40 | 106 | Gold | 0 | 98 | 325 | | Tea | 105 | 64 | 85 | Vegetable oils | 156 | 338 | 304 | | Other construction machinery | 57 | 32 | 75 | Other rubber products | 91 | 56 | 151 | | Machinery for dairy | 165 | 38 | 66 | Silver | 138 | 145 | 137 | | Total of top 10 | 1,689 | 894 | 1,765 | Total of top 10 | 4,668 | 3,405 | 7,055 | | Total exports to Russia | 2,977 | 1,835 | 3,331 | Total imports from Russia | 6,238 | 4,608 | 8,436 | | Share in India's total exports (%) | 0.92 | 0.91 | 0.84 | Share in India's total imports (%) | 1.28 | 1.77 | 1.47 | | B. Trade with Ukraine | | Drug formulations, biologicals | 107 | 93 | 150 | Vegetable oils | 1,553 | 1,081 | 1,852 | | Telecom instruments | 35 | 27 | 25 | Fertilisers manufactured | 115 | 158 | 341 | | Iron and steel | 19 | 9 | 24 | Inorganic chemicals | 70 | 63 | 200 | | Agro chemicals | 8 | 9 | 19 | Project goods | 9 | 18 | 37 | | Auto tyres and tubes | 7 | 6 | 16 | Plywood and allied products | 23 | 15 | 34 | | Coffee | 14 | 8 | 15 | Machinery for dairy | 20 | 19 | 20 | | Ceramics and allied products | 8 | 9 | 15 | Plastic raw materials | 71 | 39 | 18 | | Marine products | 4 | 5 | 12 | Iron and steel | 69 | 16 | 15 | | Plastic sheet, film, etc | 8 | 8 | 11 | Processed minerals | 16 | 7 | 15 | | Machinery for dairy | 8 | 4 | 11 | Railway transport equipment | 0 | 0 | 12 | | Total of top 10 | 219 | 178 | 297 | Total of top 10 | 1,946 | 1,416 | 2,545 | | Total exports to Ukraine | 456 | 306 | 510 | Total imports from Ukraine | 2,093 | 1,483 | 2,599 | | Share in India's total exports (%) | 0.14 | 0.15 | 0.13 | Share in India's total imports (%) | 0.43 | 0.57 | 0.45 | | Source: DGCI&S. |
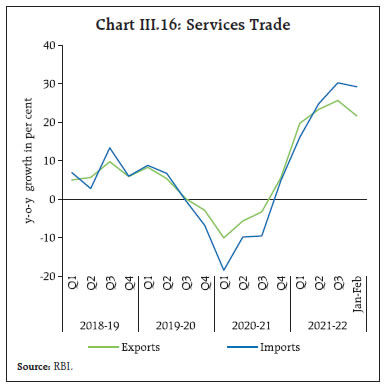 Turning to the financial account, capital flows moderated during H2:2021-22 (Chart III.17). Net FDI flows fell to US$ 11.0 billion in H2:2021-22 (October- January) from US$ 18.9 billion a year ago on the back of higher outward FDI flows and repatriations by FDI companies. Foreign portfolio investors, net buyers in Q2:2021-22, turned net sellers from Q3 in view of the resurgence of COVID-19 infections, concerns over the pace of US Fed’s monetary policy normalisation, correction in the equity market and geopolitical tensions. Net inflows under external commercial borrowings remained at US$ 2.5 billion during H2 (October-February), around the same level as a year ago, the funds being used for on-lending/ sub-lending, refinancing of rupee loans, repayment of the earlier borrowings, working capital, and new projects. Accretions under non-resident deposit accounts moderated to US$ 1.0 billion during H2 (October-January) from US$ 3.1 billion a year ago. As on March 31, 2022, India’s foreign exchange reserves stood at US$ 607.3 billion, equivalent to 12 months of merchandise imports in 2021-22 or 98.8 per cent of outstanding external debt at end-December 2021. 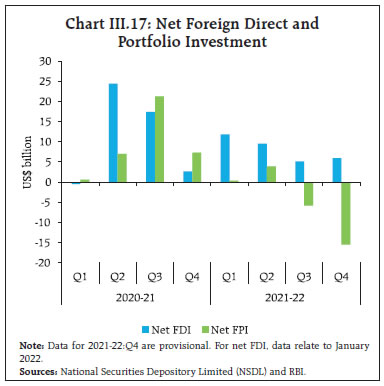 III.2 Aggregate Supply Growth in gross value added (GVA) moderated to 4.4 per cent in H2:2021-22 from 13.0 per cent in H1. Overall, GVA expanded by 8.3 per cent in 2021-22 and exceeded its 2019-20 level by 3.1 per cent (Table III.6). | Table III.6: Real GVA Growth | | (y-o-y, per cent) | | Sector | 2020-21 (FRE) | 2021-22 (SAE) | Weighted Contribution | 2020-21 | 2021-22 | | 2020-21 | 2021-22 | Q1 | Q2 | Q3 | Q4 | Q1 | Q2 | Q3 | Q4# | | Agriculture, forestry and fishing | 3.3 | 3.3 | 0.5 | 0.5 | 3.0 | 3.2 | 4.1 | 2.8 | 3.5 | 3.7 | 2.6 | 3.5 | | | | (6.7) | | | | | | | (6.6) | (7.0) | (6.8) | (6.5) | | Industry | -1.8 | 10.4 | -0.4 | 2.3 | -28.1 | 3.0 | 6.2 | 11.6 | 40.4 | 6.6 | 1.4 | 3.0 | | | | (8.4) | | | | | | | (0.9) | (9.8) | (7.6) | (15.0) | | Mining and quarrying | -8.6 | 12.6 | -0.2 | 0.3 | -17.8 | -7.9 | -5.3 | -3.9 | 17.6 | 14.2 | 8.8 | 10.7 | | | | (2.9) | | | | | | | (-3.3) | (5.2) | (3.1) | (6.4) | | Manufacturing | -0.6 | 10.5 | -0.1 | 1.9 | -31.5 | 5.2 | 8.4 | 15.2 | 49.0 | 5.6 | 0.2 | 1.7 | | | | (9.8) | | | | | | | (2.1) | (11.0) | (8.6) | (17.2) | | Electricity, gas, water supply and other utilities | -3.6 | 7.8 | -0.1 | 0.2 | -14.8 | -3.2 | 1.5 | 3.2 | 13.8 | 8.5 | 3.7 | 5.4 | | | | (3.9) | | | | | | | (-3.0) | (5.0) | (5.2) | (8.8) | | Services | -7.8 | 8.8 | -4.9 | 5.4 | -24.3 | -10.4 | 0.0 | 4.3 | 15.5 | 10.0 | 6.7 | 4.7 | | | | (0.4) | | | | | | | (-12.5) | (-1.4) | (6.7) | (9.2) | | Construction | -7.3 | 10.0 | -0.6 | 0.8 | -49.4 | -6.6 | 6.6 | 18.3 | 71.4 | 8.2 | -2.8 | -2.6 | | | | (1.9) | | | | | | | (-13.2) | (1.0) | (3.6) | (15.2) | | Trade, hotels, transport, communication | -20.2 | 11.6 | -4.1 | 2.0 | -49.9 | -18.8 | -10.1 | -3.4 | 34.3 | 9.5 | 6.1 | 7.2 | | | | (-10.9) | | | | | | | (-32.8) | (-11.1) | (-4.6) | (3.6) | | Financial, real estate and professional services | 2.2 | 4.3 | 0.5 | 1.0 | -1.1 | -5.2 | 10.3 | 8.8 | 2.3 | 6.2 | 4.6 | 4.2 | | | | (6.6) | | | | | | | (1.2) | (0.6) | (15.3) | (13.3) | | Public administration, defence and other services | -5.5 | 12.5 | -0.7 | 1.6 | -11.4 | -10.2 | -2.9 | 1.7 | 6.3 | 19.5 | 16.8 | 7.1 | | | | (6.4) | | | | | | | (-5.8) | (7.4) | (13.4) | (8.9) | | GVA at basic prices | -4.8 | 8.3 | -4.8 | 8.3 | -21.4 | -5.9 | 2.1 | 5.7 | 18.4 | 8.4 | 4.7 | 4.1 | | | | (3.1) | | | | | | | (-7.0) | (2.0) | (6.9) | (10.1) | Note: FRE: First revised estimates; SAE: Second advance estimates.
Figures in parentheses are growth rates over 2019-20. #: Implicit.
Source: NSO. | III.2.1 Agriculture GVA in agriculture and allied activities expanded by 3.0 per cent in H2, supported by adequate and well-spread southwest and northeast monsoon rains, good reservoir levels and improved soil moisture, which helped rabi acreage to increase by 1.5 per cent over the previous year. Foodgrains production touched a new record in 2021-22 with both kharif and rabi output exceeding the final estimates for 2020-21 as well as the targets (Table III.7). The production of pulses in 2021- 22 rose by 5.9 per cent, while oilseeds and sugarcane production achieved record levels. Horticulture production fell by 0.4 per cent to 3,332.5 lakh tonnes during 2021-22 due to lower output of tomato, other vegetables, spices, flowers, aromatics and medicinal plants; the output of total fruits and onion production, on the other hand, rose. Table III.7: Agricultural Production in 2021-22
(Second Advance Estimates) | | (Lakh tonnes) | | Crop | 2020-21 | 2021-22 | Variation in 2021-22 (Per cent) | | SAE | Final | Target | SAE | Over SAE 2020-21 | Over Final 2020-21 | Over Target | | Foodgrains | 3033.4 | 3107.4 | 3107.4 | 3160.6 | 4.2 | 1.7 | 1.7 | | Kharif | 1479.5 | 1505.8 | 1505.8 | 1535.4 | 3.8 | 2.0 | 2.0 | | Rabi | 1554.0 | 1601.7 | 1601.7 | 1625.3 | 4.6 | 1.5 | 1.5 | | Rice | 1203.2 | 1243.7 | 1211.0 | 1279.3 | 6.3 | 2.9 | 5.6 | | Wheat | 1092.4 | 1095.1 | 1100.0 | 1113.2 | 1.9 | 1.7 | 1.2 | | Pulses | 244.2 | 254.6 | 254.6 | 269.6 | 10.4 | 5.9 | 5.9 | | Oilseeds | 373.1 | 359.5 | 384.0 | 371.5 | -0.4 | 3.3 | -3.3 | | Sugarcane | 3976.6 | 4054.0 | 3970.0 | 4140.4 | 4.1 | 2.1 | 4.3 | | Cotton # | 365.4 | 352.5 | 370.0 | 340.6 | -6.8 | -3.4 | -7.9 | | Jute & Mesta ## | 97.8 | 93.5 | 106.0 | 95.7 | -2.1 | 2.3 | -9.7 | #: Lakh bales of 170 kgs. each.
##: Lakh bales of 180 kgs. each.
SAE: Second advance estimates.
Source: Ministry of Agriculture and Farmers’ Welfare, Government of India. |
 Allied activities – livestock, forestry and fishing – impart substantial resilience to the agricultural sector as a whole. Though allied activities have a share of around 45 per cent in the overall GVA of the sector, their contribution to growth in aggregate agricultural GVA for 2020-21 was higher at 68 per cent (Chart III.18). As on March 31, 2022, the overall procurement of rice touched 503.42 lakh tonnes which is 8.2 per cent higher than a year ago. Buffer stocks remained above the norms – 571.6 lakh tonnes for rice (7.5 times the norm) and 212.7 lakh tonnes for wheat (1.5 times the norm) at mid-March 2022, notwithstanding the offtake of 365.7 lakh tonnes of cereals (April- February 2021) for COVID-19 relief (mainly the Pradhan Mantri Garib Kalyan Anna Yojana, PM-GKAY) (Chart III.19). High-frequency indicators of the rural economy suggest a mixed picture during H2 (Table III.8). Agriculture and allied exports and agriculture credit registered robust growth in H2. Demand for jobs under the Mahatma Gandhi National Rural Employment Guarantee Scheme (MGNREGS) was lower than a year ago due to higher rabi sowing, although it was still above pre-pandemic levels. Sales of tractors, fertilisers and two-wheelers remained lower than in the previous year. The agricultural sector will benefit from measures announced in the Union Budget 2022-23 which include strengthening public and private investment in agriculture, research and education, promotion of domestic oilseed production, use of Kisan drones, delivery of digital and high-tech agriculture services. The Ken-Betwa River Linking Project with an outlay of ₹44,605 crore aims to bring 9.1 lakh hectare area under irrigation. Under the PM Gati Shakti plan, transport and infrastructure facilities will be expanded/upgraded to revamp agri-supply chain efficiency. 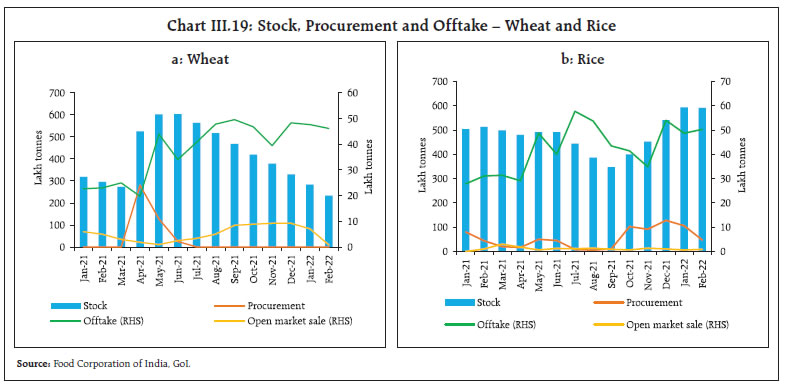
| Table III.8: Rural Economy - High Frequency Indicators | | Item | Unit | H1 (Apr-Sep) | H2 (Oct-Feb) | | 2019-20 | 2020-21 | 2021-22 | 2019-20 | 2020-21 | 2021-22 | | Tractor sales | Number (in lakh) | 3.6 | 4.0 | 4.4 | 3.2 | 4.1 | 3.3 | | Two-wheeler sales | Number (in lakh) | 97.0 | 59.9 | 65.2 | 68.5 | 76.4 | 57.6 | | Fertiliser sales | Lakh tonnes | 256.8 | 294.2 | 257.9 | 254.6 | 268.9 | 232.0 | | Demand for employment (MGNREGA) | Crore households | 11.9 | 17.6 | 16.7 | 8.6 | 12.9 | 11.2 | | Agriculture and allied sector exports | USD billion | 17.1 | 17.9 | 22.7 | 15.1 | 18.5 | 22.2 | | Agriculture credit growth | y-o-y | 7.4 | 6.2 | 9.9 | 10.6 | 8.6 | 10.4 | | Rice stock to buffer norm | Ratio | 2.0 | 1.8 | 2.6 | 6.6 | 6.7 | 7.8 | | Wheat stock to buffer norm | Ratio | 1.4 | 1.6 | 1.7 | 2 | 2.1 | 1.7 | | Sources: Tractor Manufactures Association; SIAM; Ministry of Chemicals and Fertilisers; Ministry of Rural Development; CMIE; RBI; and Food Corporation of India. | III.2.2 Industry Industrial activity lost momentum in H2, as manufacturing was affected by supply side shortages and input cost pressures (Chart III.20). Mining activity was supported by coal and natural gas, offsetting the contraction in crude oil production. Industrial production (IIP) growth decelerated to 2.1 per cent in Q3 from 9.5 per cent in Q2, as the production of electrical and machinery equipment, chemical products, and transport equipment declined in Q3. On the other hand, petroleum products, electronic products, metals, and textiles output expanded. In terms of the use-based classification, capital goods and consumer durables contracted in Q3, while primary goods, infrastructure goods, and intermediate goods rose, albeit at a decelerating pace. In Q4, IIP rose by 1.3 per cent in January 2022, but capital goods and consumer durables remained in contraction territory (Chart III.21). 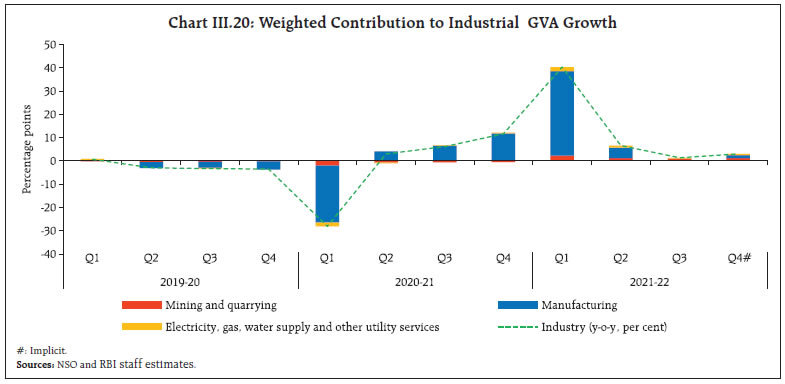
 Electricity generation edged up by 2.4 per cent in Q3 over the corresponding period of the previous year and 7.6 per cent over its 2019-20 level. Electricity generation from thermal and renewable sources increased by 1.0 per cent and 6.0 per cent, respectively, in Q3 (Chart III.22a). The thermal generation was hindered for a short period due to coal supply bottlenecks owing to unseasonal rains impacting domestic coal production and dispatches on the one hand and higher import prices of coal sharply curtailing imports on the other (Chart III.22b). In Q4, electricity generation growth improved to 4.0 per cent (Chart III.22c). Robust corporate profits supported the manufacturing sector’s GVA in Q3 (Chart III.23). According to the Reserve Bank’s industrial outlook survey, business expectations index suggest expansion in 2022-23:Q1, although at a slower pace than in the previous survey round. The manufacturing purchasing managers’ index (PMI) remained in expansion zone, although moderated to 54.0 in March from 54.9 in February reflecting lower increase in output and new export orders (Chart III.24a).
While overall manufacturing activity in H2 remained above 2019-20 levels, the production of two-wheelers and passenger vehicles trailed pre-pandemic levels due to the persistence of supply shortages as well as subdued demand (Table III.9). III.2.3 Services Services sector activity grew by 5.7 per cent in H2 and crossed its pre-pandemic level (8.0 per cent over 2019-20). The contact-intensive services, viz., trade, hotels, transport, and communication inched towards normalisation, though their rebound was held back by the Omicron variant. Construction activity contracted in H2 due to unseasonal rains in Q3 (Chart III.25). Among its proximate indicators, finished steel consumption contracted in Q3 as well as Q4, while cement production rose in December-February after a temporary setback in November (Chart III.7c and d). Collections under the goods and services tax (GST) and issuance of E-way bills in Q4 point towards further normalisation of domestic trading activity (Table III.10). After a rebound in Q3, domestic air traffic moderated in January due to the spread of the Omicron variant; however, it picked up again from February as infections receded. Commercial vehicle sales remained in expansion in Q3 and crossed pre-pandemic levels, while other indicators of transportation services – toll collections and rail freight traffic – grew robustly in Q3 and Q4. Communication services also performed well in Q3, driven by pandemic-induced digitisation. The services PMI rose sharply to 53.6 in March from 51.8 in the preceding month on improving demand conditions and relaxation of COVID-19 restrictions (Chart III.24b). The PMI composite output index also improved to 54.3 in March from 53.5 in February. 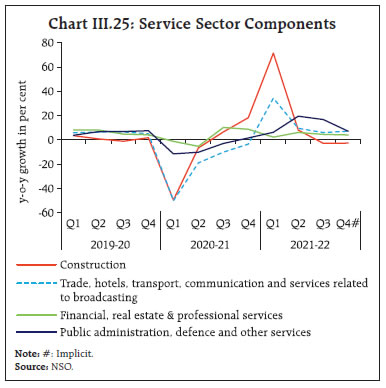
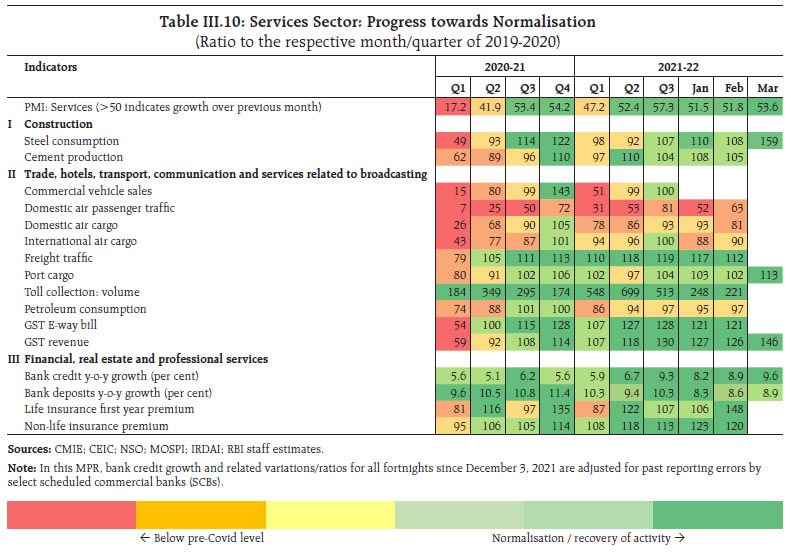 The IT sector exhibited steady growth in Q3, supported by sustained domestic and international demand, as noted earlier. Non-IT services also recorded robust growth in sales, with the gradual pick-up in contact-intensive services (Chart III.26). Real estate activity improved in Q3, with higher new launches and sales on the back of low mortgage rates and improving affordability; the inventory overhang also declined, albeit marginally (Chart III.27a). Housing prices inched up in Q3:2021-22, led by Kochi, Ahmedabad, Jaipur and Mumbai (Chart III.27b). Public administration, defence and other services (PADO) maintained robust expansion in H2. Amidst subdued growth in central government revenue expenditure, private services appear to have been the main driver of PADO in Q3. Centre’s revenue expenditure excluding interest payments and subsidies rose by 44.2 per cent (y-o-y) during January-February.
III.3 Conclusion The thrust of the government on capital expenditure and infrastructure development, and manufacturing activities through the PLI scheme should give an impetus to private investment activity, which would also benefit from the improving capacity utilisation, stronger corporate balance sheets and conducive financial conditions. The intensification of geopolitical tensions following the Russia-Ukraine conflict and the concomitant surge in global oil and commodity prices to multi-year highs amidst high financial market volatility pose significant downside risks to global economic activity and could have spillovers on domestic growth prospects. The uncertainty associated with the pace of monetary policy normalisation in the major advanced economies and the future course of the pandemic would also weigh on domestic industry.
_______________________________________________________________________________________________
IV. Financial Markets and Liquidity Conditions During H2:2021-22, domestic financial markets remained relatively stable amidst surplus liquidity conditions with intermittent bouts of volatility caused by several factors such as Omicron’s outbreak, faster pace of monetary policy normalisation in advanced countries, domestic inflation, government borrowing programme, geopolitical conflict and the sympathetic jump in crude oil prices. Going forward, the RBI’s market operations will contextually factor in the developments in global markets to insulate domestic financial markets from spillovers. Introduction Since the October 2021 MPR, global financial markets experienced dramatic swings from buoyancy in the first half of Q3 (October-December 2021) to a whirlpool of volatility amidst heightened uncertainties over the Omicron variant and imminent tapering of asset purchases and rate hikes by the US Federal Reserve (Fed) and other leading central banks. During Q4, the sharp escalation of geopolitical tensions in late February culminating in military intervention in Ukraine stunned global markets across asset classes. Global oil and commodity prices spiked to multi-year highs, equity markets in a number of advanced economies (AEs) and emerging market economies (EMEs) experienced sharp declines, sovereign bond yields in major AEs fell with flights to safety – partly reversing the earlier hardening over inflation and monetary tightening concerns – and the US dollar strengthened on safe haven demand while EME currencies weakened. As the Fed commenced raising rates in March along with guidance for quantitative tightening beginning May, the US dollar softened on profit taking, bond yields firmed up, equities traded higher and commodity prices, especially oil, witnessed correction. Overall, global financial markets remained volatile in Q4 and shadowed by turbulence. IV.1 Domestic Financial Markets Domestic financial markets remained relatively stable in H2:2021-22 amidst surplus liquidity conditions with intermittent bouts of volatility caused by Omicron’s outbreak, faster than anticipated pace of normalisation in advanced countries, domestic inflation concerns, bearishness about the large government borrowing programme and, more recently, geopolitical conflict and the sympathetic jump in crude oil prices. Amidst portfolio outflows in Q4:2021-22, a pick-up in government spending has kept short-term liquidity conditions comfortable. IV.1.1 Money Market During H2:2021-22, money market rates firmed up in closer alignment with the reverse repo rate – the lower bound of the policy rate corridor – reflecting the rebalancing of surplus liquidity from the overnight fixed rate reverse repo window towards the variable rate reverse repo (VRRR) auctions of varying maturities (Chart IV.1). As a result, the weighted average call rate (WACR) – the operating target of monetary policy – traded 2 basis points (bps) below the reverse repo rate, on average, in H2 as compared with 17 bps below in H1. The WACR sporadically firmed up above the reverse repo rate due to transient factors such as the occurrence of public holidays towards the end of the reserve maintenance cycle in the third week of November 2021, advance tax payments in the second half of December 2021 and March 2022, and larger than anticipated collections under the goods and services tax (GST). In the overnight call money segment, the weighted average rate (WAR) of traded deals was 16 bps above the reverse repo rate while that on reported deals1 was 16 bps below, reflecting market segmentation as small cooperative banks – principal lenders in reported deals – lend at lower rates towards the close of market hours (Chart IV.2a). The average monthly volume of reported deals in H2 at ₹1.06 lakh crore exceeded that in the traded segment of ₹0.74 lakh crore (Chart IV.2b) which, along with lower rates in the reported deals, pulled down the WACR below the reverse repo rate. The greater share of the reported deals in the total volume of the call money market reflected the increased share of lending by co-operative banks (85 per cent in March 2022 as against 80 per cent in September 2021). 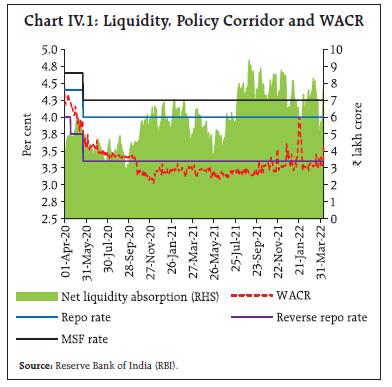 The share of the uncollateralised call money market in the total overnight money market volume at 2.0 per cent in H2 was the same as in H1. In the collateralised segment, the share of tri-party repo increased to 76 per cent in H2 from 73 per cent in H1, with a corresponding decline in the market repo share to 22 per cent from 25 per cent (Chart IV.3). Mutual funds – the major lender in both the collateralised segments – increased their participation from 68 per cent in H1 to 72 per cent in H2 in the tri-party repo segment; their share in the market repo, however, declined from 70 per cent in H1 to 56 per cent in H2. On the borrowing side, the share of public sector banks (PSBs) in the tri-party repo segment increased from 52 per cent in H1 to 64 per cent in H2 and from 8 per cent to 16 per cent in market repo, driven by low-cost funds from mutual funds. 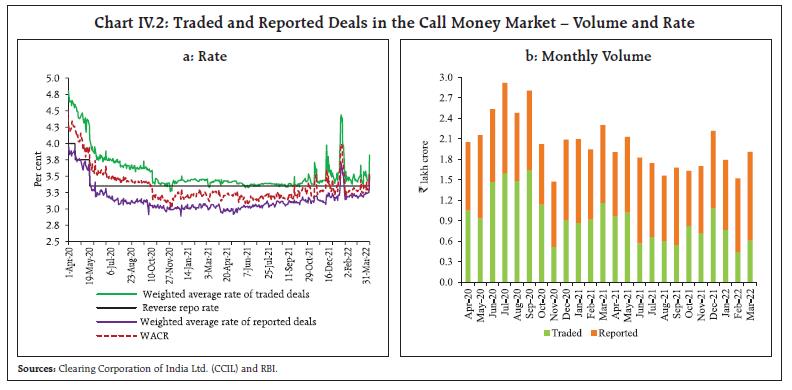 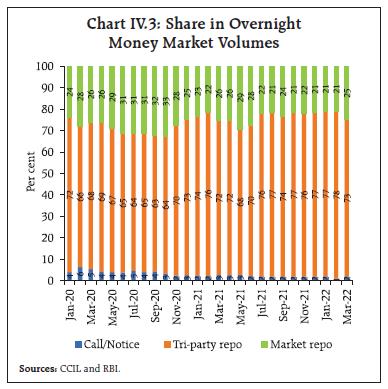 With increasing amounts absorbed under the VRRR auctions at higher cut-offs (see section IV.3 for details), the effective reverse repo rate (ERRR)2 increased from 3.39 per cent in September 2021 to 3.78 per cent in March 2022, inching closer to the repo rate (Table IV.1). The overnight segment rates – the weighted average call rate (WACR), the tri-party repo rate and the market repo – which traded below the reverse repo rate during H1:2021-22 – gradually trended upwards. Similarly, the rates on 3-month T-bill, certificates of deposit (CDs) and commercial paper issuances by non-banking financial companies (CP-NBFCs) moved higher, with their spreads at 26 bps, 38 bps and 80 bps, respectively, above the reverse repo rate during H2 as against 1 bps, 8 bps and 28 bps during H1 (Chart IV.4). | Table IV.1: Correlation of Money Market Rates with the ERRR | | | Overnight Rates | Short-term Rates (3-month) | | WACR | Tri-party Repo | Market Repo | T-bill | CDs | CPs (NBFC) | | Correlation Coefficient | 0.51 | 0.61 | 0.61 | 0.77 | 0.67 | 0.86 | | p-value | (0.00) | (0.00) | (0.00) | (0.00) | (0.00) | (0.00) | Note: Based on daily data for August 13, 2021 to March 31, 2022.
Source: RBI staff estimates. |
Issuances of CDs increased to ₹1.73 lakh crore in H2 from ₹0.60 lakh crore in H1, reflecting additional fund mobilisation by banks alongside an uptick in bank credit. Commercial paper (CP) issuances remained at ₹10.1 lakh crore during H2, unchanged from H1, supported by ample surplus liquidity and congenial financing conditions (Chart IV.5.a). Short-term CP issuances were boosted by the rush of initial public offerings (IPOs) and their financing by non-banking financial companies (NBFCs) (Chart IV.5.b). Monthly CP issuances and weighted average discount rate (WADR) peaked in mid-November 2021, tracking IPO issuances. Outstanding CPs moderated to ₹3.52 lakh crore in March 2022 from ₹3.71 lakh crore in September 2021, reflecting higher issuances of short tenors (Table IV.2). | Table IV.2: Maturity Profile of CP Issuances | | (₹ lakh crore) | | Tenor | Mar-21 | Sep-21 | Dec-21 | Mar-22 | | 7- 30 days | 1.08 | 0.32 | 1.53 | 0.15 | | 31-90 days | 0.66 | 0.54 | 0.56 | 0.42 | | 91-180 days | 0.31 | 0.36 | 0.24 | 0.39 | | 181-365 days | 0.18 | 0.12 | 0.15 | 0.19 | | Total@ | 2.24 | 1.34 | 2.48 | 1.16 | | Outstanding | 3.64 | 3.71 | 3.50 | 3.52 | @: Total issuances during the month.
Source: CCIL, F-Trac and RBI. | IV.1.2 Government Securities (G-sec) Market During H2:2021-22, the 10-year G-sec yield hardened by 63 basis points, reflecting global and domestic factors (Chart IV.6). It rose by 24 bps during Q3, driven by higher international crude oil prices, domestic inflation and increasing government bond yields in major economies including the US, which more than offset the intermittent softening owing to the lower-than-expected CPI print for India for September, tax cuts on petrol and diesel, and a sharp decline in US yields following the outbreak of the Omicron variant of COVID-19. In Q4, the benchmark yield firmed up by a further 39 bps owing to higher-than-expected indicative calendar of market borrowings of State Governments/Union Territories, planned market borrowings by the Centre indicated in the Union Budget 2022-23 and the rise in US yields, international crude oil and other commodity prices over escalating geopolitical tensions. The cancellation of two consecutive central government bond auctions, however, tempered the hardening of domestic yields. 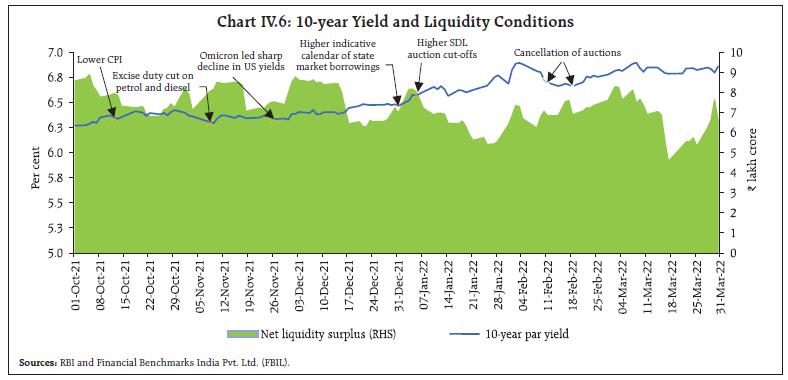 At the shorter end of the primary market segment, yields on T-bills firmed up in sync with the increase in the effective reverse repo rate (Chart IV.7). Average trading volume in both G-secs and T-bills dipped in H2:2021-22, amidst rising yields and elevated uncertainty (Chart IV.8). The average level of yield increased by 38 bps during H2. The slope flattened by 41 bps in view of the sharper increase in the short-term rates on account of the liquidity rebalancing (Chart IV.9)3. To facilitate debt consolidation, the Reserve Bank conducted five switch operations on behalf of the central government amounting to ₹1.7 lakh crore during H2:2021-22. The weighted average maturity (WAM) of the outstanding stock of G-secs increased to 11.71 years as on March 31, 2022 from 11.57 years as at end-September 2021. The weighted average coupon (WAC) at 7.11 per cent was lower than 7.15 per cent over the same period. The weighted average spread of cut-off yields on state development loans (SDLs) over G-sec yields of comparable maturities moderated to 36 bps in H2 from 48 bps in H1 (Chart IV.10). The average inter-state spread on securities of 10-year tenor (fresh issuances) was 4 bps in H2, the same as in H1. IV.1.3 Corporate Bond Market Tracking G-sec yields, corporate bond yields moved higher and risk premia compressed amidst moderation in new issuances. The yields on AAA-rated 3-year bonds issued by NBFCs increased by 66 bps to 5.98 per cent in H2 and those on corporates and public sector undertakings (PSUs), financial institutions (FIs) and banks by 64 bps and 51 bps to 5.88 per cent and 5.84 per cent, respectively (Chart IV.11a). The risk premium or spread over 3-year G-sec yields declined from 49 bps to 37 bps in H2 for NBFCs, from 50 bps to 23 bps for PSUs, FIs and banks and from 40 bps to 26 bps for corporates (Chart IV.11b). The moderation in the risk premia (spreads) was seen across tenors and rating spectrum in H2 (Table IV.3). The 3-year credit default swap (CDS) spreads for the State Bank of India and ICICI Bank trading overseas increased by 2 bps and 10 bps, respectively at end-March 2022 from end-September 2021. | Table IV.3: Financial Markets - Rates and Spread | | Instrument | Interest Rates (per cent) | Spread (bps) (over corresponding risk-free rate) | | Sep 2021 | Mar 2022 | Variation (in bps) | Sep 2021 | Mar 2022 | Variation (in bps) | | 1 | 2 | 3 | (4 = 3-2) | 5 | 6 | (7 = 6-5) | | Corporate Bonds | | | | | | | | (i) AAA (1-yr) | 4.17 | 5.04 | 87 | 35 | 29 | -6 | | (ii) AAA (3-yr) | 5.24 | 5.88 | 64 | 40 | 26 | -14 | | (iii) AAA (5-yr) | 5.88 | 6.43 | 55 | 4 | 0 | -4 | | (iv) AA (3-yr) | 6.07 | 6.59 | 52 | 124 | 97 | -27 | | (v) BBB-minus (3-yr) | 9.99 | 10.25 | 26 | 516 | 464 | -52 | | 10-yr G-sec | 6.18 | 6.82 | 64 | | | | Note: Yields and spreads are computed as monthly averages.
Source: FIMMDA and Bloomberg. | 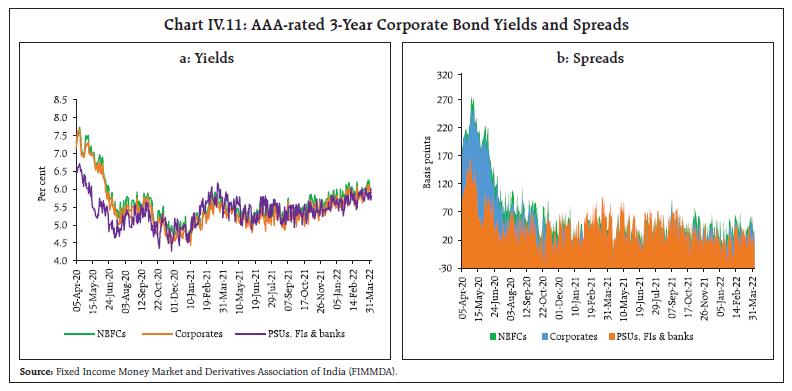 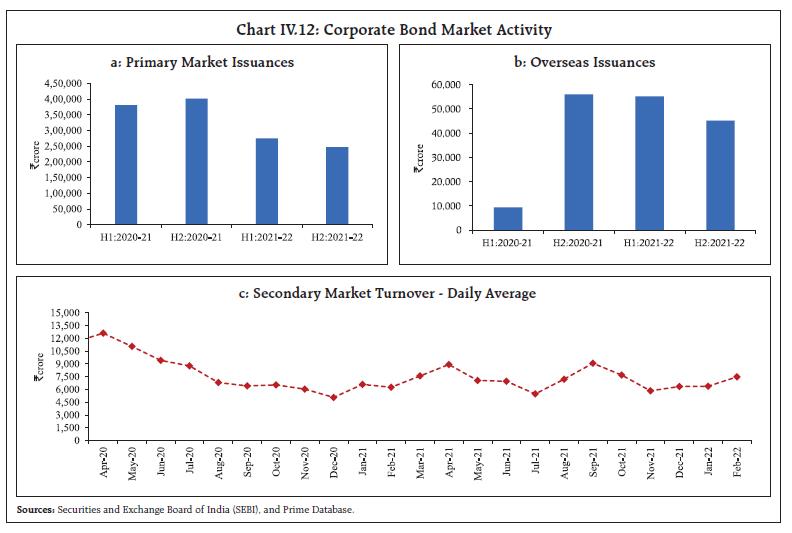 Issuances of corporate bonds in the primary market declined to ₹2.47 lakh crore during H2 (up to February 2022) from ₹3.06 lakh crore during the corresponding period of 2020-21 as corporates’ resource requirements moderated with the capex cycle being still at a nascent stage (Chart IV.12a). Corporates resorted to increased overseas issuances in 2021-22, taking advantage of lower cost of funds abroad (Chart IV.12b). Competitive lending rates offered by banks also contributed to lower domestic bond issuances. Nearly the entire resource mobilisation in the corporate bond market (98.2 per cent) was through the private placement route. The outstanding investments by foreign portfolio investors (FPIs) in corporate bonds declined marginally from ₹1.28 lakh crore at end-September 2021 to ₹1.21 lakh crore at end-March 2022, pulling down the utilisation of the approved limits from 22.3 per cent to 19.9 per cent. The daily average secondary market trading volume increased by 10.6 per cent to ₹6,730 crore during H2 (up to February 2022) over the corresponding period of the previous year (Chart IV.12c). IV.1.4 Equity Market Indian equity markets corrected marginally in H2:2021-22 amidst high volatility triggered by the outbreak of the Omicron variant of COVID-19, hawkish monetary policy stances of global central banks, elevated crude oil prices and escalating geopolitical tensions. Domestic equities witnessed sharp selloffs in the second half of February and early March 2022 over Ukraine-Russia tensions but recovered in the second half of March. Overall, the BSE Sensex lost 0.9 per cent in H2 to close at 58,569 (Chart IV.13a). The correction in the stock prices, coupled with higher corporate earnings, led to the price-to-earnings ratio (of BSE Sensex) falling to 25.1 at end-March 2022 from 27.6 at end-September 2021, moderating the valuation premium over its long-term average (Chart IV.13b). 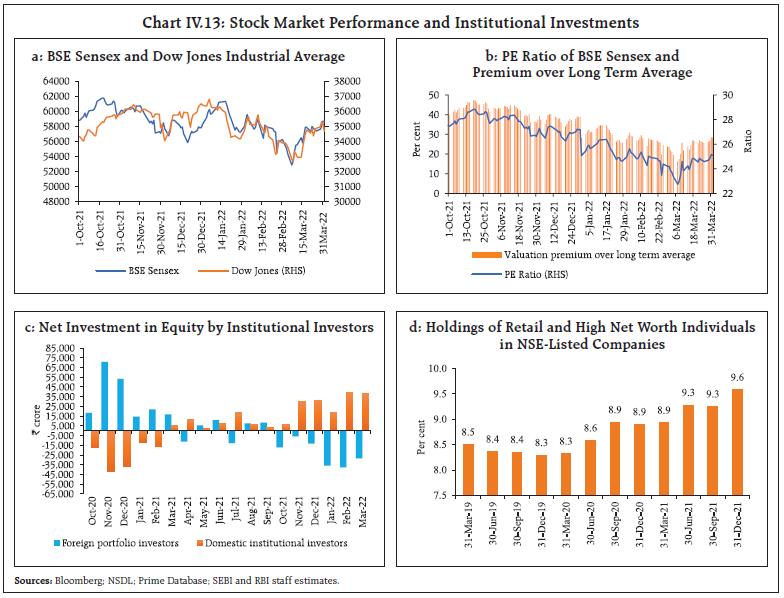 Apprehensions over the faster than anticipated pace of normalisation by the US Fed, the rise in the US treasury yields and the rush to safe haven amidst escalating tensions around Russia-Ukraine triggered a selling spree by the FPIs amounting to ₹1.38 lakh crore from the domestic equity market in H2. These sales, however, were more than offset by purchases by domestic institutional investors (DIIs) to the tune of ₹1.64 lakh crore (Chart IV.13c). Amongst domestic buyers, retail participation (including high net worth individuals) in equities rose further during H2, extending the buying interest noted in H1 (Chart IV.13d). The vibrancy in the IPO segment continued during H2 (up to February 2022), with 27 issuances mobilising ₹0.62 lakh crore (₹0.23 lakh crore in the corresponding period of the previous year) (Chart IV.14a). The amounts raised through the rights issues also increased to ₹0.25 lakh crore in H2 (up to February) from ₹0.04 lakh crore during the corresponding period of the previous year. A large chunk (nearly two-third) of the amount raised in the IPOs was through the offer for sale (OFS) route while around five per cent and three per cent were envisaged for capital expenditure and debt repayment, respectively (Chart IV.14b). IV.1.5. Foreign Exchange Market The Indian rupee (INR) exhibited two-way movements in H2:2021-22, and depreciated on an average basis (Chart IV.15a). The INR traded with an appreciating bias between mid-October and mid-November 2021. In the following months, it depreciated amidst FPI outflows, the strengthening US dollar, increasing market expectations of a faster than anticipated monetary policy normalisation by the US Fed and other major AEs, rise in crude oil prices and escalating geopolitical tensions, touching a low of ₹ 76.924 per US$ on March 7, 2022. The INR reversed some of these losses in the subsequent days with the correction in crude oil prices and was at ₹ 75.81 on March 31, 2022. Volatility measured by 1-month at the money (ATM) option implied volatility5 of the INR surged, surpassing levels observed during the second wave of the pandemic; it however, eased in the second half of March (Chart IV.15b). 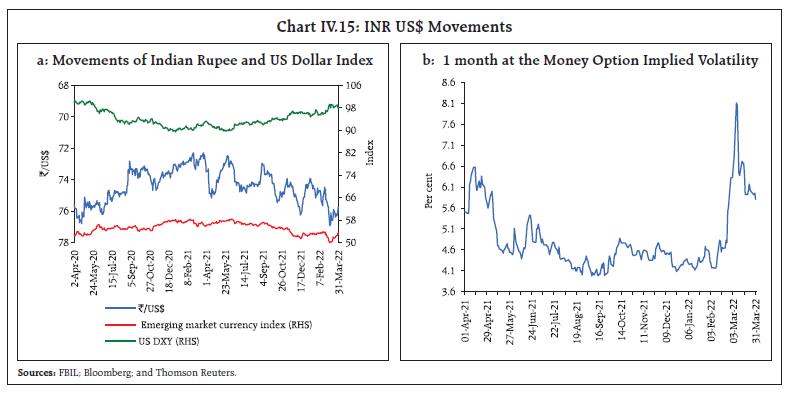 In terms of the 40-currency nominal effective exchange rate (NEER) and real effective exchange rate (REER), the INR depreciated by 1.1 per cent and 2.1 per cent, respectively, between September 2021 and March 31, 2022 (Table IV.4). The nominal and real movements in the Indian rupee exchange rate against the US dollar were muted in relation to a number of other emerging market currencies. This reflects the underlying stability of the INR even as some other emerging market peers faced sharp depreciation (Chart IV.16). Forward premia generally firmed up during H2, especially for longer maturities (Chart IV.17). Table IV.4: Nominal and Real Effective Exchange Rate Indices (Trade-weighted)
(Base: 2015-16 = 100) | | Item | Index: March 31, 2022 (P) | Appreciation (+) / Depreciation (-) (Per cent) | | March 31, 2022 over September (average) 2021 | | 40-currency REER | 103.3 | -2.1 | | 40-currency NEER | 93.5 | -1.1 | | 6-currency REER | 102.2 | -1.5 | | 6-currency NEER | 86.8 | -1.2 | | ₹/US$ | 75.8 | -3.0 | P: Provisional.
Sources: RBI; and FBIL. |
IV.1.6 Credit Market Credit offtake picked up during 2021-22, with the gradual return of normalcy after the pandemic. Non-food credit extended by scheduled commercial banks (SCBs) rose by 9.7 per cent (y-o-y) as on March 25 (4.5 per cent a year ago) (Chart IV.18). The recovery in bank credit was led by private sector banks that provided the bulk (50..4 per cent) of the incremental y-o-y credit (up to March 25, 2022), followed by PSBs (44.7 per cent) (Chart IV.19b). Credit growth was driven by all the major economic sectors6. Credit to agriculture accelerated to 10.4 per cent (y-o-y) in February 2022 from 8.6 per cent in February 2021 on the back of a higher target7, the interest subvention scheme and priority sector lending. Growth in credit to industry recovered to 6.5 per cent in February 2022 from a low of 1.0 per cent a year ago, aided by higher flows to MSMEs and a turnaround in large industry. Personal loans remained the key driver of overall bank credit, with a share of 42.7 per cent in incremental offtake (y-o-y) in February 2022 (Chart IV.20a and b). The uptick in credit growth was seen across banks (Chart IV.20c)8. 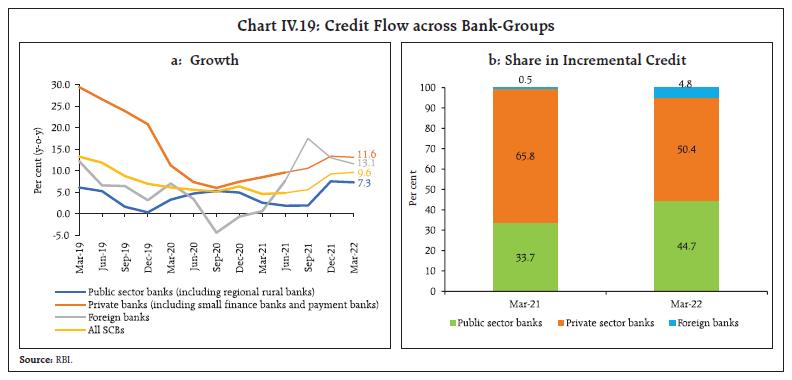 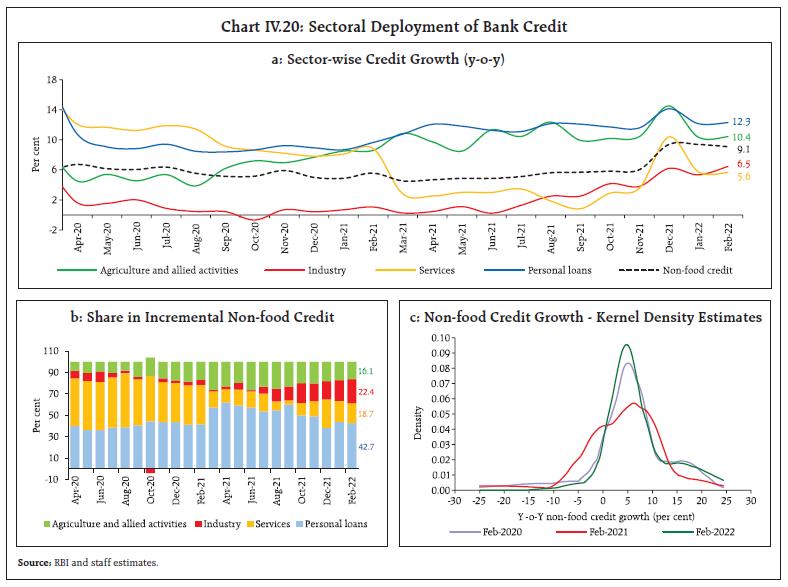 Within industry, credit to MSMEs benefitted from the launch of the Emergency Credit Line Guarantee Scheme (ECLGS) in May 2020 and the subsequent expansions in its scope, which helped push up credit growth to micro and small industries to 19.9 per cent in February 2022 (3.1 per cent a year ago) and to medium industries to 71.4 per cent (30.6 per cent a year ago) (Chart IV.21a and b). The Union Budget 2022-23 has extended the ECLGS to March 2023, with the guarantee cover increasing by ₹ 50,000 crore to a total cover of ₹5 lakh crore. Credit to large industry emerged out of an extended period of contraction/ slow growth and recorded 0.5 per cent growth in February 2022, supported by key industries such as engineering; chemicals and chemical products; food processing; leather and leather products; and rubber, plastic, and their products. Infrastructure credit – 38 per cent of the total industrial credit – logged a robust growth of 11.9 per cent in February 2022, driven by road and power sectors and the government’s push to capex. 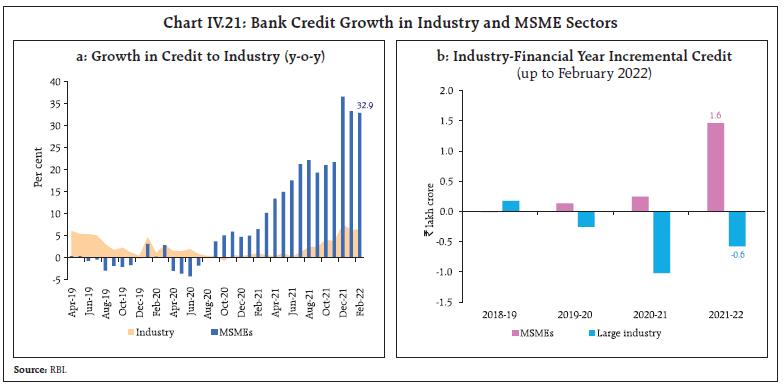 Credit expansion in the services sector was led by NBFCs and trade, which together constitute around 58 per cent of the total services sector credit. Credit growth to the NBFCs moved out of negative territory in October 2021 and rose sharply to 14.6 per cent in February 2022 from 7.0 per cent a year ago. Credit to the trade sector remained strong, while that to transport operators recovered after remaining subdued for over a year. NBFCs and trade sectors were the major contributors to the overall credit growth to the services sector in February 2022 (Chart IV.22a and b). Personal loans grew by 12.3 per cent in February 2022 (9.6 per cent a year ago), primarily driven by housing, followed by vehicle loans and loans against gold jewellery (Chart IV.23 and Box IV.1). Box IV.1: Retail Lending Behaviour of Banks Retail loans have emerged as the main driver of bank credit in recent years and now have the largest share in the outstanding credit of SCBs, displacing industrial loans (Chart IV1.1a). Within retail, housing loans have the largest share (Chart IV.1.1b). The importance of retail loans has increased for both private sector banks (PVBs) and public sector banks (PSBs) (Chart IV.1.1c). Retail loans have been supported by banks’ transformation from being traditional ‘financial intermediaries’ to lending for consumption purposes, driven by the new generation private sector banks, credit information bureaus, technological and product innovations, and alternate delivery channels (Jappelli and Pagano, 1993). In view of subdued profitability and deleveraging by corporates, risk-averse banks shifted their focus away from large infrastructure and industrial loans towards retail loans (Das, 2020). To analyse factors affecting retail credit relative to overall lending and industrial credit, key banking health variables (asset quality and profitability) and macroeconomic variables (overall economic activity) are considered for the period 2007-2020 using annual data in a dynamic panel setting, with the sample including both public sector and private sector banks (Table IV.1.1). The empirical analysis suggests that credit growth to the retail sector is less sensitive to asset quality than industrial credit. Given the higher incidence of NPAs in industry, risk aversion has contributed to credit growth in retail sector outpacing the growth in credit to industry. Furthermore, industrial loans demand tends to be more cyclical relative to retail. Overall, as economic activity picks up and with the banking system well capitalised, credit offtake can be expected to turn more broad-based. | Table IV.1.1: Determinants of Banks’ Sectoral Lending | | | (1) | (2) | (3) | | | Dependent variables | | Explanatory variables | Overall bank credit growth | Industrial loan growth | Retail loan growth | | Lag dependent variable | 0.526** | 0.219*** | 0.160* | | Lag NPA ratio | -0.695** | -1.625** | -1.109** | | Lag RoA | 2.825* | 8.316** | 3.434** | | Interest rate | -3.264*** | -4.893*** | -3.803*** | | Lag nominal GDP growth rate | 0.404** | 0.924** | 0.814** | | constant | 0.416*** | 0.564*** | 0.356** | | N | 288 | 288 | 288 | | AR(1) Test | 0.001 | 0.005 | 0.004 | | AR(2) Test | 0.100 | 0.112 | 0.782 | | Sargan Test | 0.076 | 0.084 | 0.650 | * p<0.1, ** p<0.05, *** p<0.01
Source: RBI staff estimates. | References: Das, S. (2020), “Banking Landscape in the 21st Century”, RBI Bulletin, March. Jappelli, T., and M. Pagano (1993), “Information Sharing in Credit Markets”, Journal of Finance, 48(5). | The asset quality of SCBs improved further during 2021-22, with the overall non-performing assets (NPA) ratio declining to 6.5 per cent in December 2021 from 6.8 per cent a year ago, driven by lower NPAs in credit to industry (Chart IV.24). During H2, the expansion in banks’ non-SLR investments in bonds, debentures and shares of public and private corporates was more than offset by reduction in their commercial paper holdings (Chart IV.25a). Adjusted non-food credit (i.e., banks’ non-food credit plus non-SLR investments) growth accelerated to 9.1 per cent on March 25 from 4.2 per cent a year ago, mirroring non-food credit dynamics (Chart IV.25b). Amidst improving credit offtake, growth in banks’ holdings of government securities decelerated, pulling down their excess SLR investments to 10.6 per cent of net demand and time liabilities (NDTL) as on February 25, 2022 from 11.0 per cent at end-March 2021 (Chart IV.26). IV.2 Monetary Policy Transmission The accommodative stance of monetary policy, ample surplus liquidity, and the floating rate loans linked to marginal cost of funds-based lending rate (MCLR) getting reset lower contributed to some further easing in commercial bank’s lending rates in H2:2021-22. In response to the 250 basis points (bps) reduction in the policy repo rate since February 2019 (when the current easing phase started), the weighted average lending rates (WALRs) on fresh and outstanding rupee loans have declined by 213 bps and 143 bps, respectively (Table IV.5). 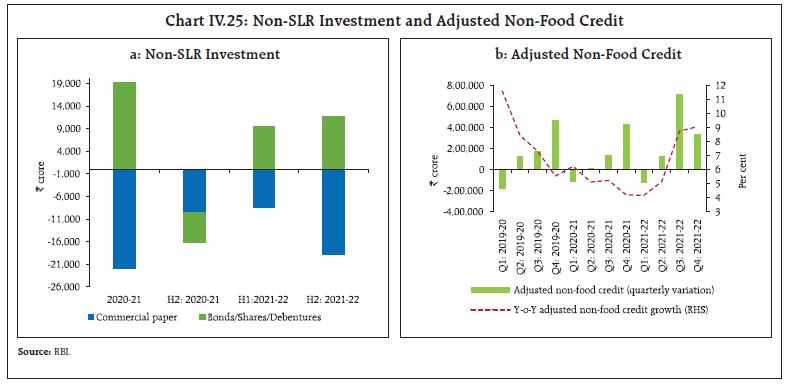 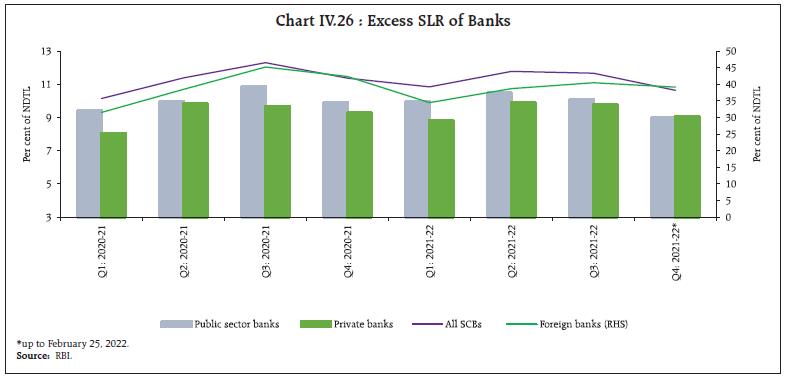 The proportion of floating rate loans linked to the external benchmarks rose further to 39.2 per cent in December 2021 from 28.6 per cent in March 2021 and 9.3 per cent in March 2020, which would strengthen transmission further going forward. Correspondingly, the share of MCLR-linked loans has come down, although these still have the largest share (53.1 per cent in December 2021) (Table IV.6). The sustained decline in the MCLRs and the periodic resetting of such loans at lower rates benefitted existing borrowers and led to a softening of WALR on outstanding loans. | Table IV.5: Transmission from the Repo Rate to Banks’ Deposit and Lending Rates | | (Variation in basis points) | | Period | Repo Rate | Term Deposit Rates | Lending Rates | | Median TDR (Fresh Deposits) | WADTDR (Outstanding Deposits) | 1 - Year Median MCLR | WALR (Outstanding Rupee Loans) | WALR (Fresh Rupee Loans) | | February 2019 - September 2019 (Pre-External Benchmark) | -110 | -9 | -8 | -30 | 0 | -43 | | October 2019 – March 2022* (External Benchmark Period) | -140 | -180 | -181 | -128 | -143 | -170 | | March 2020 - March 2022* (COVID period) | -115 | -150 | -143 | -95 | -124 | -140 | | February 2019 – March 2022* (Current Easing Cycle) | -250 | -208 | -189 | -155 | -143 | -213 | | April 2021 –September 2021 | 0 | 0 | -21 | -5 | -18 | -2 | | October 2021 – March 2022* | 0 | 0 | -5 | 0 | -11 | -8 | *: Latest data on WALRs and WADTDR pertain to February 2022.
WALR: Weighted average lending rate; WADTDR: Weighted average domestic term deposit rate;
MCLR: Marginal cost of funds-based lending rate; TDR: Term deposit rate.
Source: RBI. |
| Table IV.6: Outstanding Floating Rate Rupee Loans of SCBs across Interest Rate Benchmarks | | (Per cent to total) | | | March 2020 | March 2021 | June 2021 | December 2021 | | Base rate regime | 10.2 | 6.4 | 6.5 | 5.3 | | MCLR regime | 77.7 | 62.8 | 60.3 | 53.1 | | External benchmark regime | 9.3 | 28.6 | 32.2 | 39.2 | | Others | 1.7 | 1.5 | 0.5 | 1.9 | Note: Data pertain to 74 scheduled commercial banks.
Source: RBI. | The reduction in lending rates was seen across most sectors in 2021-22, adding to the softening recorded in 2020-21. The decline was the sharpest for agricultural loans, infrastructure, large industry and other personal loans in the case of fresh rupee loans and for infrastructure, other personal loans, vehicle and micro, small and medium enterprises (MSMEs), in the case of outstanding rupee loans (Chart IV.27). In February 2022, lending rates (outstanding loans) were the lowest in respect of housing loans, reflecting the lower risk of default and the availability of collaterals. Other personal loans, i.e., loans other than housing, vehicle and educational loans are mostly unsecured and hence they have higher credit risk and spreads (Chart IV.28). In the case of fresh loans, large industry got loans at the lowest rates, followed by infrastructure and housing loans9. Monetary transmission to WALR on fresh rupee loans in retail and MSME sectors, where new floating rate loans have been mandatorily linked to an external benchmark10, registered substantial improvement (Chart IV.29). The spreads charged by domestic banks over the policy repo rate (in the case of loans where the repo rate is the external benchmark) moderated during H2, and were the lowest for other personal loans and housing loans in February 2022 (Table IV.7). The external benchmark-based pricing of loans (which has hastened adjustments by banks in their cost of funds to maintain net interest margins), weak credit demand and ample surplus liquidity improved transmission to term deposit rates (Chart IV.30a). The median term deposit rate (MTDR) – the prevailing card rates on fresh deposits – has moderated by 150 bps since March 2020, led by shorter tenor deposits of maturity of up to one year (Chart IV.30b). Concomitantly, the weighted average domestic term deposit rate (WADTDR) on outstanding deposits declined by 143 bps. Banks with higher WADTDR have undertaken more rate cuts in the current easing cycle (Chart IV.30c). | Table IV.7: Loans linked to External Benchmark – Spread of WALR (Fresh Rupee Loans) over the Repo Rate | | (Per cent) | | Sectors | September 2021 | February 2022 | | Public sector banks | Private banks | Domestic banks | Public sector banks | Private banks | Domestic banks | | MSME loans | 5.13 | 3.98 | 4.72 | 4.24 | 3.92 | 4.07 | | Personal loans | | | | | | | | Housing | 3.14 | 3.17 | 3.16 | 2.92 | 3.50 | 3.28 | | Vehicle | 3.49 | 4.09 | 3.55 | 3.24 | 3.82 | 3.30 | | Education | 4.43 | 6.03 | 4.76 | 4.44 | 5.09 | 4.59 | | Other personal loans | 5.17 | 3.54 | 4.97 | 3.11 | 4.79 | 3.19 | | Sources: RBI; and RBI staff estimates. |
The decline in the MTDR of PvBs exceeded that of PSBs, leading to a greater alignment in the levels of deposit rates across the two bank groups. With improving credit demand, however, banks have started pricing in their deposits at higher rates to mobilise stable funding. As a result, the WADTDR on fresh deposits has increased by 24 bps since October 2021. The median saving deposit rate for domestic banks has remained sticky in the range of 2.9 to 3 per cent since June 2020. The decline in the lending rates (both fresh and outstanding rupee loans) was higher in the case of PSBs relative to PvBs, contrary to the movements in deposit rates (WADTDR) (Chart IV.31a). Lending rates (WALRs as well as MCLRs) of PSBs continue to remain below PvBs (Chart IV.31b). The transmission to lending and deposit rates was the maximum in the case of foreign banks, as a higher share of low cost and lower duration wholesale deposits in their total liabilities facilitated faster adjustment in interest rates. 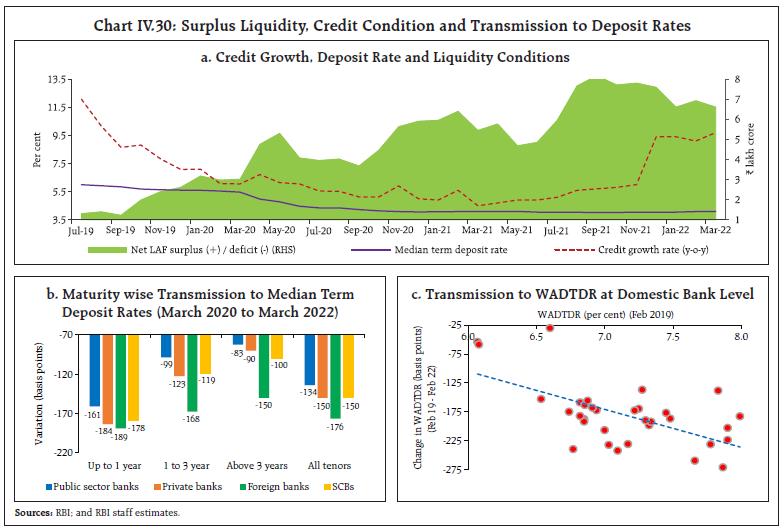 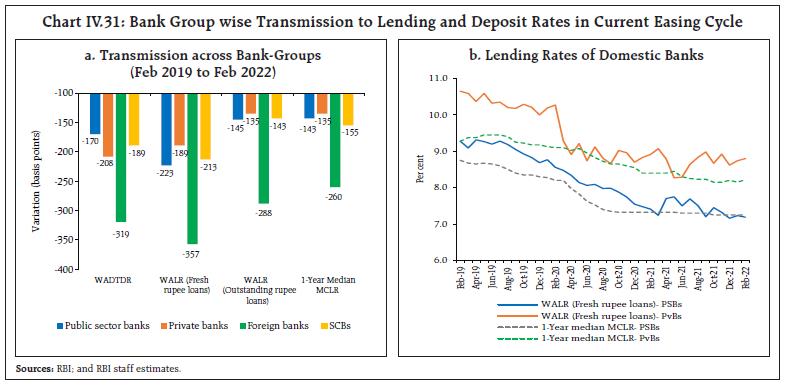
| Table IV.8: Interest Rates on Small Savings Instruments – Q1:2022-23 | | Small Savings Scheme | Maturity (years) | Spread (Percentage point) $ | Average G-sec Yield (%) of Corresponding Maturity (Dec 2021 -Feb 2022) | Formula based Rate of Interest (%) (applicable for Q1:2022-23) | Government Announced Rate of Interest (%) for Q1:2022-23 | Difference (basis points) | | (1) | (2) | (3) | (4) | (5) = (3) + (4) | (6) | (7) = (6) - (5) | | Savings Deposit | - | - | - | - | 4.00 | - | | Public Provident Fund | 15 | 0.25 | 6.76 | 7.01 | 7.10 | 9 | | Term Deposits | | | | | | | | 1 Year | 1 | 0 | 4.32 | 4.32 | 5.50 | 118 | | 2 Year | 2 | 0 | 4.76 | 4.76 | 5.50 | 74 | | 3 Year | 3 | 0 | 5.21 | 5.21 | 5.50 | 29 | | 5 Year | 5 | 0.25 | 6.10 | 6.35 | 6.70 | 35 | | Recurring Deposit Account | 5 | 0 | 5.21 | 5.21 | 5.80 | 59 | | Monthly Income Scheme | 5 | 0.25 | 6.07 | 6.32 | 6.60 | 28 | | Kisan Vikas Patra | 124 Months# | 0 | 6.76 | 6.76 | 6.90 | 14 | | NSC VIII issue | 5 | 0.25 | 6.24 | 6.49 | 6.80 | 31 | | Senior Citizens Saving Scheme | 5 | 1.00 | 6.10 | 7.10 | 7.40 | 30 | | Sukanya Samriddhi Account Scheme | 21 | 0.75 | 6.76 | 7.51 | 7.60 | 9 | $: Spreads for fixing small saving rates as per Government of India Press Release of February 2016.
#: Current maturity is 124 months.
Note: Compounding frequency varies across instruments.
Sources: Government of India; FBIL; and RBI staff estimates. | The Government has left the interest rates on various small savings instruments (SSIs) – which are fixed on a quarterly basis with a spread of 0-100 bps over and above G-sec yields of comparable maturities – unchanged since Q2:2020-21, i.e., for the eighth successive quarter. In view of the increase in the G-sec yields in recent months, the excess of the announced interest rates on SSIs over the respective formula-based rates moderated to 9-118 bps for Q1:2022-23 from 42-168 bps in Q4:2021-22 (Table IV.8). IV.3 Liquidity Conditions and the Operating Procedure The RBI Act, 1934 requires the Reserve Bank to place the operating procedure relating to the implementation of monetary policy and changes thereto from time to time, if any, in the public domain. As part of the monetary policy and other announcements of April 8, 2022 certain changes have been effected in the operating procedure to further refine it by improving its flexibility, efficiency in liquidity management and operational convenience, as set out below (Box IV.2). In consonance with the accommodative stance of monetary policy, the Reserve Bank maintained ample surplus liquidity in the system during H2, aimed at nurturing and supporting the nascent growth impulses by ensuring adequate flow of credit to the productive sectors of the economy. Simultaneously, with the objective of restoring the revised liquidity management framework – suspended in March 2020 after the outbreak of COVID-19 – the RBI continued with rebalancing of liquidity from the passive fixed rate overnight reverse repo window towards longer tenors through VRRR auctions in a gradual, calibrated and non-disruptive manner. Box IV.2: Refinements in the Operating Framework of Monetary Policy in India The amendment to Section 17 of the RBI Act in 2018 enables the Reserve Bank to introduce the Standing Deposit Facility (SDF). By removing the binding collateral constraint on the central bank, the SDF strengthens the operating framework of monetary policy. The SDF as the floor of the LAF corridor would provide symmetry to the operating framework of monetary policy by introducing a standing absorption facility at the bottom of the LAF corridor, similar to the standing injection tool at the upper end of the corridor, namely the marginal standing facility (MSF). Thus, at both ends of the LAF corridor, there will be standing facilities – one to absorb and the other to inject liquidity. Accordingly, access to SDF and MSF will be at the discretion of banks, unlike repo/reverse repo, OMO and CRR which are available at the discretion of the Reserve Bank. The SDF is also a financial stability tool in addition to its role in liquidity management. The SDF rate will be 25 bps below the policy rate, and it will be applicable to overnight deposits at this stage. It would, however, retain the flexibility to absorb liquidity of longer tenors as and when the need arises, with appropriate pricing. The MSF rate will continue to be 25 bps above the policy repo rate. Thus, the width of the LAF corridor is restored to the pre-pandemic configuration of 50 bps, symmetrically around the policy repo rate, which will be at the centre of the corridor. The fixed rate reverse repo (FRRR) rate is retained at 3.35 per cent. It will remain as part of RBI’s toolkit and its operation will be at the discretion of the RBI for purposes specified from time to time. The FRRR a long with the SDF will impart flexibility to the RBI’s liquidity management framework. Both MSF and SDF will be available on all days of the week, throughout the year. | Drivers and Management of Liquidity Currency demand was the prime source of liquidity leakage while drawdown of government cash balances emerged as the main driver of liquidity accretion during H2. Currency in circulation (CiC) increased by ₹2.1 lakh crore during H2 (up to March 25, 2022), driven by festival season demand and rabi crop harvesting. RBI’s forex operations also sucked out liquidity to the tune of ₹1.0 lakh crore in H2 on account of FPI outflows, contrary to a substantial injection of ₹3.0 lakh crore during H111. The drainage of liquidity due to these factors was to an extent offset by accretion on account of higher government spending to the tune of ₹1.5 lakh crore in H2 (Table IV.9). Open market operations (OMOs) drained liquidity in H2 in contrast to a sizeable injection in H1 from the secondary market G-Sec Acquisition Programme (G-SAP) (Box IV.3). G-SAP was discontinued in H2, given the ample liquidity surplus, the absence of additional borrowing for goods and services tax (GST) compensation and the expected expansion of liquidity on account of higher government spending. | Table IV.9: Liquidity – Drivers and Management | | (₹ crore) | | | 2020-21 | 2021-2022 | | Q1 | Q2 | H1 | Q3 | Q4* | H2* | 2021-22* | | Drivers | | (i) CiC | -4,06,452 | -1,26,266 | 54,921 | -71,344 | -61,794 | -1,48,617 | -2,10,411 | -2,81,755 | | (ii) Net Forex Purchases | 5,10,516 | 1,60,843 | 1,42,395 | 3,03,238 | -17,242 | -79,136 | -96,378 | 2,06,860 | | (iii) GoI Cash Balances | -1,81,999 | -2,23,740 | -5,600 | -2,29,340 | 1,34,537 | 19,430 | 1,53,967 | -75,373 | | Management | | (i) Net OMO Purchases | 3,13,295 | 1,38,965 | 97,960 | 2,36,925 | -15,060 | -7,880 | -22,940 | 2,13,985 | | (ii) CRR Balances | -1,46,617 | 29,392 | -16,470 | 12,922 | -77,606 | 32,996 | -44,611 | -31,689 | | (iii) Net LAF Operations | -1,52,302 | -60,759 | -2,86,162 | -3,46,921 | 60,823 | 1,65,269 | 2,26,092 | -1,20,829 | *: Data are up to March 25, 2022.
Note: Data pertain to the last Friday of the respective period.
Source: RBI. |
Box IV.3: Impact of G-Sec Acquisition Programme Asset purchase programs (APPs) have been undertaken by several central banks (including EMEs) following the COVID-19 outbreak to ease monetary and financial conditions in support of economic recovery (IMF, 2020). APPs lower yields through two main channels, viz., (i) the supply channel by which an APP announcement can immediately moderate the risk premium in anticipation of reduced net supply of government bonds in the market; and (ii) the signalling channel as market participants may perceive the recourse to an APP as an indication that the economic outlook is weak necessitating lower policy rates for a longer period (Arora et al., 2021). In the Indian context, the Reserve Bank purchased G-secs of ₹2.2 lakh crore under G-SAP in H1:2021-22 to anchor yield expectations in the context of the large borrowing programme of the Government. Asset purchases under G-SAP were different from regular open market operation (OMO) purchases as (i) these provided an upfront commitment on amounts in contrast to regular OMOs, which are discretionary; (ii) the size of G-SAP auctions was larger than conventional OMOs; and (iii) purchases included both liquid and illiquid securities (RBI, 2021). The market response to the nine G-SAP auctions was favourable (Chart IV.3.1). The last two auctions were liquidity neutral with purchases being offset by simultaneous sales of an identical amount (special OMOs). 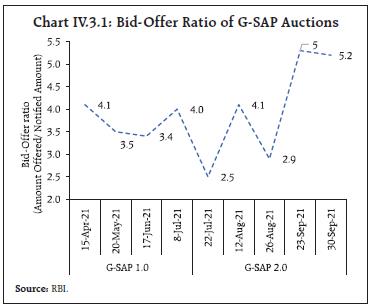 To assess the announcement effect of the G-SAP on yields in an event study (ES) framework, daily changes (closet - closet-1) in the benchmark 10-year G-sec yield (Gsec) for April-September 2021 (period during which G-SAP was conducted) are regressed on the proximate macroeconomic and financial market drivers of yields: (i) change in yield on the previous day to account for hysteresis effects (persistence); (ii) changes in US 10-year bond yield (US10Y) and crude oil prices (Crude) to capture the impact of global factors on domestic yields; and (iii) domestic inflation surprises (Δ Inflation) which is defined as the difference between actual CPI inflation and consensus forecasts. The impact of G-SAP on yields is captured by inclusion of a dummy for the policy day (April 4) when G-SAP was announced (GSAP_GS) and for each of the respective G-SAP announcement (GSAP_IA) dates12. 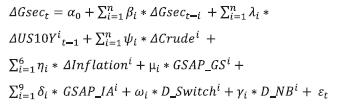 The estimated coefficients suggest a statistically significant impact of domestic and global factors (domestic inflation, US bond yields and crude oil prices) on yields (Table IV.3.1). The G-SAP announcements cumulatively softened the benchmark bond yield by 9 basis points in spite of gross market borrowings remaining elevated for the second successive year and recurrent supply shocks that kept inflation elevated. Thus, G-SAP operations facilitated congenial and orderly financing conditions that provided a conducive environment for the domestic recovery. | Table IV.3.1: G-SAP Impact on 10-year G-Sec Yields | | Variables | Coefficient | | Constant | -0.000 | | Lag (-1) | -0.084 | | Δ US10Y (-1) | 0.107** | | Δ Crude_Oil | 0.003*** | | Δ Inflation | 0.026*** | | G-SAP_GS | -0.037*** | | Σ GSAP | -0.092*** | | D-Switch | 0.100*** | | D-New Benchmark | 0.097*** | | Diagnostic tests (p-value) | | BG LM test for autocorrelation of residuals | 0.397 | | Breusch-Pagan-Godfrey – Heteroscedasticity Test | 0.987 | Note: *, **, *** denote significance at 10, 5 and 1 per cent level, respectively. Sample period for the analysis is April 1-September 30, 2021
Source: RBI staff estimates. | References: International Monetary Fund (2020), Global Financial Stability Report, October. Arora. R., S. Gungor, J. Nesrallah, G. O. Leblanc and J. Witmer (2021), ';The Impact of the Bank of Canada’s Government Bond Purchase Program';, Bank of Canada, Staff Analytical Note 2021-23. | Liquidity absorption through the reverse repo mirrored movements in government cash balances, given the latter’s transient role in driving frictional liquidity (Chart IV.32). Liquidity Rebalancing The Reserve Bank progressively enhanced the size of the 14-day VRRR auctions in H2 to re-establish them as the main liquidity management operation, complemented by fine tuning operations of varying sizes and maturities (3-28 days). The 14-day VRRR auction amount was increased in a calibrated and pre-announced path from ₹4.0 lakh crore on October 8 to ₹7.5 lakh crore by December 31, 2021. Due to their higher remuneration relative to the fixed rate reverse repos, the VRRR auctions drew favourable market responses. Reflecting these developments, the amount absorbed under the fixed rate reverse repo declined to a daily average of ₹2.0 lakh crore in H2 from ₹4.7 lakh crore in H1, with a concomitant increase in absorption through variable rates (both main and fine-tuning operations) to ₹6.2 lakh crore from ₹2.3 lakh crore over the same period (Chart IV.33). The Reserve Bank’s commitment to flexibly conduct fine tuning operations was reinforced through three variable rate repo (VRR) auctions of 1-3-day maturity, cumulatively injecting ₹2.0 lakh crore during January 20-24, 2022 to address transient liquidity tightness on account of higher than anticipated collections under the GST.  As a step towards rebalancing the liquidity surplus, it was decided to provide one more option to banks to prepay the outstanding amount of funds availed under the targeted long term repo operations (TLTRO 1.0 and 2.0) conducted during March-April 2020. Accordingly, banks cumulatively returned ₹39,882 crore in two tranches – ₹2,434 crore in December 2021 over and above ₹37,348 crore paid earlier in November 2020. Moreover, given the limited recourse by banks to the marginal standing facility (MSF) in the post-pandemic period due to surplus liquidity conditions, the normal dispensation of allowing banks to dip up to 2 per cent (instead of 3 per cent) of their NDTL was reinstated effective January 1, 2022. At the same time, the RBI extended the deadlines of key targeted liquidity facilities, given the needs of the stressed sectors: special long-term repo operations (SLTRO) facility for small finance banks (SFBs) were made available till December 31, 2021, while also making it on tap; the liquidity facilities of ₹50,000 crore to ease access to emergency health services and ₹15,000 crore for contact-intensive sectors were extended up to June 30, 2022 from March 31, 2022. 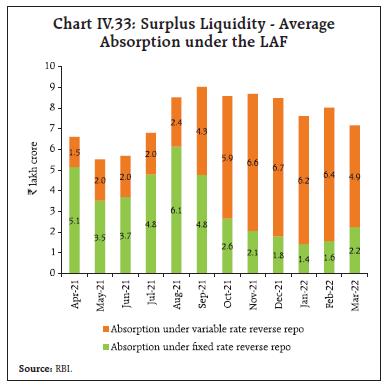 With the progressive return of normalcy, and in order to restore the revised liquidity management framework, the RBI announced on February 10, 2022 that (i) the variable rate repo (VRR) operations of varying tenors would be conducted as and when warranted by the evolving liquidity and financial conditions within the CRR maintenance cycle; (ii) VRRs and VRRRs of 14-day tenor will operate as the main liquidity management tool based on liquidity conditions, conducted to coincide with the CRR maintenance cycle; (iii) the main operations will be supported by fine-tuning operations to tide over any unanticipated liquidity changes during the reserve maintenance period while auctions of longer maturity will also be conducted, if required; and (iv) effective March 1, 2022, the windows for fixed rate reverse repo and the MSF operations would be available during 17.30-23.59 hours on all days (as against 09.00-23.59 hours since March 30, 2020 as an interim measure to provide market participants greater flexibility in their liquidity management in view of COVID-19). Market participants were advised to shift their balances out of the fixed rate reverse repo into VRRR auctions and avail the automated sweep-in and sweep-out (ASISO) facility in the e-Kuber portal for operational convenience13. IV.4 Conclusion Domestic financial markets have moved broadly in sync with the accommodative monetary policy stance. The rebalancing of liquidity from the fixed rate window to variable rate reverse repo auctions is firming up money market rates. Bond yields have risen from historic lows on the back of higher crude oil prices and the expected monetary policy normalisation by advanced economy central banks. Nevertheless, financial conditions remain conducive to growth and credit offtake is gaining traction. The RBI’s market operations remain supportive of the recovery. Going forward, they will contextually factor in the developments in global financial and commodity markets, which are witnessing volatility due to worsening geopolitical situations and monetary policy normalisation in the major AEs, so as to insulate domestic financial markets from spillovers. _______________________________________________________________________________________________
V. External Environment The global economy has been buffeted by severe shocks since the October 2021 MPR. The sharp increase in geopolitical tensions since January 2022 escalating into a full-fledged war in February is imposing a threat to the world economy and its financial system architecture. Meanwhile, inflation is at multi-decadal highs and increasingly getting persistent across major advanced economies and several emerging market economies. The global economy has been buffeted by severe shocks since the October 2021 MPR. In November, the highly transmissible Omicron variant of the virus emerged, but its impact on lives and livelihoods turned out to be benign relative to earlier waves and, on the global economy, transient. Furthermore, supply chain disruptions intensified, posing a risk to the global recovery. More recently, the sharp increase in geopolitical tensions since January 2022 escalating into a full-fledged war in February is imposing a bigger threat to the world economy and its financial system architecture. Meanwhile, inflation is at multi-decadal highs and increasingly getting persistent across major advanced economies (AEs) and several emerging market economies (EMEs). The tectonic upward shift in commodity prices, including food and energy, due to the war is making the macroeconomic picture murkier (Box V.1). Box V.1: Impact of the Russia-Ukraine War on the Global Macroeconomy Geopolitical hostilities in Ukraine are casting a strong downside to the global macroeconomy. The immediate direct hit on commodities and financial markets has aggravated, with financial sanctions and retaliation. The closure of shipping routes and air space, suspension of logistic and shipping services and shutting down of pipelines, on account of sanctions/apprehensions/voluntary private decisions are creating a new wave of supply disruptions. This is likely to further add to freight costs, ultimately feeding into inflation and impacting trade and output. A surge in geopolitical risk is associated with significant economic contraction, particularly in emerging market economies (Cheng and Chiu, 2018). Russia and Ukraine were the 11th and 55th largest economies in the world in 2020, accounting for about 1.7 per cent and 0.2 per cent, respectively, of the world’s nominal GDP. Their shares in world exports at 2.3 per cent and 0.3 per cent, respectively, notwithstanding, they have a dominant influence on supplies of key commodities, resulting in an outsized impact on inflation, trade and output at the global level (Chart V.1.1). The world runs a high exposure to fuel, gas, some agro, wood products, edible oil, wheat, minerals and metals produced by these two countries (Chart V.1.2). Global food inflation and food security are hostage to the war, as are energy-dependent nations and fertiliser importers, including India. There are second-order spillovers too – it is estimated that the global light vehicle production would be reduced by 2.6 million units in 2022 and 2023 as the conflict has disrupted supplies of vehicle components, including electric power communication parts, palladium, aluminium, nickel and semiconductor-grade neon. If commodity and financial market shocks persist for at least one year, it is estimated that in 2022, global GDP growth could be reduced by more than 1 percentage point and the global consumer price inflation could be raised by around 2.5 percentage points (OECD, 2022). Europe is likely to be the most impacted in view of high dependence on energy imports. Moreover, it is seeing a massive refugee influx. The OECD estimates that the cost of accommodating 3 million refugees – the total inflow in the first three weeks of the war – in 2022 would be around 0.25 per cent of the European Union’s GDP. The longer-term economic ramifications of the war/sanctions could be deterrence to decarbonisation, higher defence spending, move towards autarky, fragmentation of payments systems and opaque diversification of foreign exchange reserves. References: OECD (2022), “Economic and Social Impacts and Policy Implications of the War in Ukraine”, Economic Outlook, Interim Report, March. Cheng, C. H. J. and Chiu, C.-W(J.) (2018): “How Important are Global Geopolitical Risks to Emerging Countries?” International Economics, doi:10.1016/j.inteco.2018.05.002 | V.1 Global Economic Conditions While there was a pick-up in the momentum of global growth in Q4:2021, more recent high frequency indicators point to some loss of pace in Q1:2022. The US economy registered impressive gains in Q4:2021 primarily due to strong consumer/business spending and non-residential fixed investment (Table V.1). Furthermore, private inventory investment and exports also contributed positively. As a result, US GDP grew by 5.7 per cent in 2021 – the highest since 1984 – as against a contraction of 3.4 per cent in 2020. As 2022 began, the rapid spread of the Omicron variant appeared to be causing a slowdown in some sectors of the economy but the virus spread has been receding since mid-January. The S&P Global US composite Purchasing Managers’ Index (PMI) after touching an 18-month low of 51.1 in January bounced back to 55.9 in February 2022 as virus containment measures were scaled back and further rose to an 8-month high in March with broad-based acceleration in activity. The US labour market continued to tighten, with wages rising 4.5 per cent in 2021 – the fastest pace since 1983 – although the labour force participation rate remained below pre-pandemic levels. Stronger household balance sheets, rising employment and adaptation to the pandemic by businesses are factors supporting the outlook whereas the war and the pandemic are the major headwinds. The Euro area’s GDP grew by 1.0 per cent (q-o-q, saar) in Q4:2021, its slowest rate in three quarters, as the Omicron variant’s spread necessitated restrictions, creating labour shortages and denting consumer confidence. The composite PMI for the Euro zone registered its highest monthly jump in five months in February 2022 as containment measures abated but slid in March as business activity slowed down particularly in manufacturing. The growth outlook for 2022 is overcast by the war and persistently high and rising energy costs. | Table V.1: Real GDP Growth | | (Per cent) | | Country | Q1: 2021 | Q2: 2021 | Q3: 2021 | Q4: 2021 | 2020 | 2021 (E) | 2022 (P) | 2023 (P) | | Quarter-on-quarter, seasonally adjusted annualised rate (Q-o-q, SAAR) | | Canada | 4.8 | -3.6 | 5.5 | 6.7 | - | - | - | - | | Euro area | -0.5 | 9.1 | 9.3 | 1.0 | - | - | - | - | | Japan | -2.2 | 2.4 | -2.8 | 4.6 | - | - | - | - | | South Korea | 7.1 | 3.1 | 1.3 | 5.0 | - | - | - | - | | UK | -4.6 | 24.6 | 4.0 | 5.2 | - | - | - | - | | US | 6.3 | 6.7 | 2.3 | 6.9 | - | - | - | - | | Year-on-year | | Advanced Economies | | Canada | 0.2 | 11.7 | 3.8 | 3.3 | -5.2 | 4.8 | 4.1 | 2.8 | | Euro area | -0.9 | 14.6 | 4.0 | 4.6 | -6.4 | 5.3 | 3.9 | 2.5 | | Japan | -1.8 | 7.3 | 1.2 | 0.4 | -4.5 | 1.8 | 3.3 | 1.8 | | South Korea | 1.9 | 6.0 | 4.0 | 4.2 | -0.9 | 4.0 | 3.0 | 2.9 | | UK | -5.0 | 24.6 | 7.0 | 6.6 | -9.3 | 7.4 | 4.7 | 2.3 | | US | 0.5 | 12.2 | 4.9 | 5.5 | -3.4 | 5.7 | 4.0 | 2.6 | | Emerging Market Economies | | | | | | | | | | Brazil | 1.3 | 12.3 | 4.0 | 1.6 | -3.9 | 4.6 | 0.3 | 1.6 | | China | 18.3 | 7.9 | 4.9 | 4.0 | 2.2 | 8.1 | 4.8 | 5.2 | | India | 2.5 | 20.3 | 8.5 | 5.4 | -6.6 | 8.9 | 9.0 | 7.1 | | Indonesia | -0.7 | 7.1 | 3.5 | 5.0 | -2.0 | 3.7 | 5.6 | 6.0 | | Philippines | -3.9 | 12.0 | 6.9 | 7.7 | -9.6 | 5.6 | 6.3 | 6.9 | | Russia | -1.8 | -0.7 | 10.5 | | -3.0 | 4.7 | 2.8 | 2.1 | | South Africa | -2.4 | 19.6 | 2.9 | 1.7 | -6.4 | 4.9 | 1.9 | 1.4 | | Thailand | -2.4 | 7.7 | -0.2 | 1.9 | -6.2 | 1.6 | 4.1 | 4.7 | | Memo: | | | | | | | | | | World | 2020 | 2021 (E) | 2022 (P) | 2023 (P) | | Year-on-year | | | | | | Output | -3.1 | 5.9 | 4.4 | 3.8 | | Trade Volume | -8.2 | 9.3 | 6.0 | 4.9 | E: Estimate P: Projection.
Note: India's data correspond to fiscal year (April-March); E.g., 2020 pertains to April 2020-March 2021.
Sources: Official statistical agencies; Bloomberg; IMF WEO Update, January 2022; and RBI staff estimates. | In the UK, GDP grew 5.2 per cent (q-o-q, saar) in Q4:2021 but still remained 0.1 per cent below its pre-pandemic level, i.e., Q4:2019. As the economic impact of the Omicron variant ebbed, GDP increased to 0.8 per cent above its pre-pandemic level in January 2022, driven by growth in all sectors, including consumer-facing services, production and construction. The unemployment rate continued to decline despite closure of the furlough scheme at end-September 2021. The composite PMI hit an 8-month high of 59.9 in February 2022 driven by strong recovery in consumer spending on travel, leisure and entertainment and rose further in March. The growth outlook is, however, mired in uncertainty as the soaring of energy prices due to the war portends adversely for already high inflation. Japan’s GDP grew by 4.6 per cent (q-o-q, saar) in Q4:2021, in contrast to the 2.8 per cent contraction logged in Q3. The upturn marked the strongest pace of quarterly growth in a year, as both household consumption and business investment revived amidst a decline in COVID-19 cases, easing restrictions and the advancing vaccination campaign. Overall, the Japanese economy expanded by 1.8 per cent in 2021 but it remains below its pre-pandemic level of output. There was a resurgence of COVID-19 cases in the beginning of 2022. The au Jibun Bank Japan composite PMI improved to 50.3 in March 2022 from 45.8 in February – first rise in output after three consecutive months of contraction with services continuing to be in decline. Japan’s economy would likely recuperate as containment measures fade but the war may pose a downside. Moving to EMEs, the Chinese economy grew by 8.1 per cent in 2021, exceeding the government’s target of above 6 per cent; however, growth of 4.0 per cent (y-o-y) in Q4:2021 was the slowest pace of expansion since Q2:2020 (Table V.2). The government’s zero tolerance approach to COVID-19 has exacerbated pandemic-related disruptions and muted consumer spending, while the real estate sector is beset with a steep downturn in the property sector. In March, China registered its highest daily infection tally, with several regions including Shanghai going into lockdown. The Caixin China general manufacturing PMI was 48.1 in March, lowest since February 2020 amid the new wave of COVID-19 flare-ups. Looking ahead, several weaknesses lurk in the economy, ranging from rising production and raw material costs to a doubtful demand recovery and the war. The government has set a growth target of 5.5 per cent for 2022, the lowest since 1991. | Table V.2: Select Macroeconomic Indicators for BRICS Economies | Real GDP Growth Rate
(Per cent) | Country | 2020 | 2021(E) | 2022(P) | General Govt. Gross Debt
(Per cent of GDP) | Country | 2020 | 2021(E) | 2022(P) | | Brazil | -3.9 | 4.6 | 0.3 | Brazil# | 98.9 | 90.6 | 90.2 | | Russia | -3.0 | 4.7 | 2.8 | Russia | 19.3 | 17.9 | 17.9 | | India | -6.6 | 8.9 | 9.0 | India | 89.6 | 90.6 | 88.8 | | China | 2.2 | 8.1 | 4.8 | China | 66.3 | 68.9 | 72.1 | | South Africa | -6.4 | 4.9 | 1.9 | South Africa | 69.4 | 68.8 | 72.3 | CPI Inflation Rate
(Per cent) | Country | 2020 | 2021(E) | 2022(P) | Current account balance
(Per cent of GDP) | Country | 2020 | 2021(E) | 2022(P) | | Brazil | 3.2 | 7.7 | 5.3 | Brazil | -1.8 | -0.52 | -1.72 | | Russia | 3.4 | 5.9 | 4.8 | Russia | 2.4 | 5.7 | 4.4 | | India | 6.1 | 5.4 | 4.9 | India | 0.9 | -1.0 | -1.4 | | China | 2.4 | 1.1 | 1.8 | China | 1.8 | 1.6 | 1.5 | | South Africa | 3.3 | 4.4 | 4.5 | South Africa | 2.0 | 2.9 | -0.9 | General Govt. Net Lending/Borrowing
(Per cent of GDP) | Country | 2020 | 2021(E) | 2022(P) | Forex Reserves*
(in US$ billion) | Country | 2020 | 2021 | 2022 | | Brazil | -13.4 | -6.2 | -7.4 | Brazil | 355.6 | 362.2 | 357.7 | | Russia | -4.0 | -0.6 | 0.0 | Russia | 596.1 | 630.6 | 630.2 | | India | -12.8 | -11.3 | -9.7 | India | 588.4 | 635.3 | 633.8 | | China | -11.2 | -7.5 | -6.8 | China | 3536 | 3578.2 | 3576.6 | | South Africa | -10.8 | -8.4 | -7.0 | South Africa | 54.2 | 57.821 | 57.8 | E: Estimate. P: Projection.
*: Forex reserves for 2022 pertains to February 2022 except Russia (January 2022)
#: Gross debt refers to the nonfinancial public sector, excluding Eletrobras and Petrobras, and includes sovereign debt held by the central bank.
Notes: 1. India's data correspond to fiscal year (April-March).
2. The imputed CPI prints for April and May 2020 for India have been regarded as a break in the CPI series.
Sources: Official statistical agencies; WEO October 2021 database and January 2022 Update, IMF; Fiscal Monitor Update, October 2021, IMF; and IRFCL, IMF. | Brazil’s GDP growth decelerated for the second consecutive quarter to 1.6 per cent (y-o-y) in Q4:2021, with industry and agriculture registering a decline. Labour market indicators showed consistent job recovery. Exports have benefited from robust global demand for commodities. Supply bottlenecks, higher interest rates and policy uncertainty have, however, slowed the pace of recovery. The manufacturing PMI hit a 6-month high in March but overall remained in contraction in Q1:2022. Going forward, elevated interest rates and a fragile fiscal position weigh on activity, with the ongoing war-related uncertainty remaining a key risk to the outlook. South Africa’s GDP growth decelerated to 1.7 per cent (y-o-y) in Q4:2021. In January 2022, South Africa experienced its heaviest rainfall on record, which caused extensive crop damage and was declared a national disaster by the authorities. The composite PMI for March, however, signalled expansion for the third successive month due to increase in employment even as inflation weighed on activity. Looking ahead, the growth outlook is fraught with risks, including the emergence of new COVID-19 variants, low vaccination levels, poor jobs outlook and continued disruptions to power supply. The Russian economy ended 2021 on a strong footing on sturdier industrial production growth, which more than offset a slowdown in the services sector amidst cooling retail sales. GDP expanded 4.7 per cent in 2021, recording the strongest upturn since 2008. In February 2022, the composite PMI was at a 7-month high of 50.8 but slid in March 2022 to its lowest level since May 2020, registering a marked contraction in business activity. Furthermore, international sanctions are expected to lead to a sharp downward plunge in the economy. South-east Asian economies recovered in Q4:2021 as pandemic-induced restrictions eased and inoculation rates improved. The manufacturing PMI for the ASEAN economies in March 2022 eased to a 6-month low amidst softer demand conditions. The region faces headwinds due to the war and its fallout on commodity prices, especially wheat and potassic fertiliser. The OECD composite leading indicators (CLIs) available up to February 2022 suggest moderate deceleration across most major AEs and divergent movements for major EMEs (Chart V.1a). The global composite PMI suggests easing of momentum at end of Q1:2022 with the March reading moderating to 52.7 as output growth slowed in both services and manufacturing (Chart V.1b). World trade momentum has moderated since H2:2021 as pent-up demand normalised (Chart V.2a). This is corroborated by the World Trade Organization (WTO)’s Goods Trade Barometer reading of 98.7 in December 2021, which is below the barometer’s baseline value of 100. The WTO, in an October 2021 release, expected merchandise trade growth to moderate to 4.7 per cent in 2022 from 10.8 per cent in 2021. The Baltic Dry Index – a measure of shipping costs for a wide variety of bulk commodities such as coal, iron ore and grain – has moderated after peaking in October 2021. Rising uncertainty and disruptions due to the war, however, have put pressure on shipping costs (Chart V.2b). V.2 Commodity Prices and Inflation Following a blip in November 2021 on account of the Omicron’s onset, global commodity prices resumed rallying in December with the outbreak of the war sending fresh shock waves across markets from end-February. As a result, prices of most commodities soared, pushing the Bloomberg commodity price index to an 8-year high in early-March. Notwithstanding some moderation thereafter, the index increased by 23.5 per cent between September 2021 and March 2022. The food price index of the Food and Agriculture Organization (FAO) increased by 8.9 per cent between September 2021 and February 2022 (Chart V.3a). Prices hit an all-time high in February, rising 20.7 per cent (y-o-y) primarily on strong vegetable oil and dairy prices – the former reaching a new record on concerns over global supply flows. For sugar, however, favourable production prospects in major exporting countries have kept price pressures muted since December. Food prices are likely to pick up further in coming months as fertiliser prices have soared in March on fears of prolonged disruption in global supply of potash and nitrogen crop nutrients. 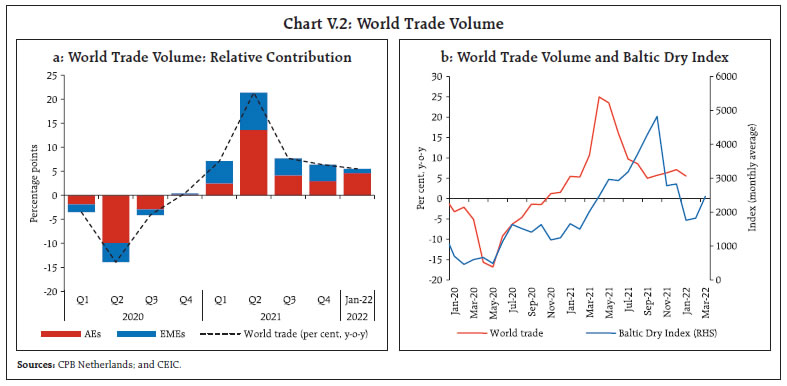 Crude oil prices ended 2021 51.4 per cent higher year-on-year, on the back of a rally in October and early November. They resurged in early 2022, breaching US$90 per barrel towards end-January – the first time in seven years – as demand remained robust while supply faced capacity constraints and escalated geopolitical tensions (Chart V.3b). With the Russia-Ukraine war propelling risks of outright supply losses and OPEC plus providing no respite, crude oil prices rocketed to a 14-year high of US$133 per barrel in the first week of March. Prices have remained volatile thereafter fluctuating around US$110 per barrel. Notwithstanding the volatility, brent crude oil prices surged by 38 per cent in Q1:2022. Base metal prices, measured by Bloomberg’s base metal spot index, increased by 25.0 per cent between September 2021 and March 2022 (Chart V.4). From end-December there has been a broad-based pick up in metal prices, underpinned by improved demand prospects as also strained supplies due to disruptions in a few major metal exporting countries. The war upended the markets and most metals scaled multi-year highs, with aluminium and nickel leading. Following the unprecedented surge in prices, the London Metal Exchange suspended nickel trading for over a week in the second week of March. Gold prices inched up and stayed around the psychological level of US$1,800 per troy ounce in Q4:2021 and January 2022. Bullion prices spurted from February on increased flight to safety before paring some gains in the second half of March. 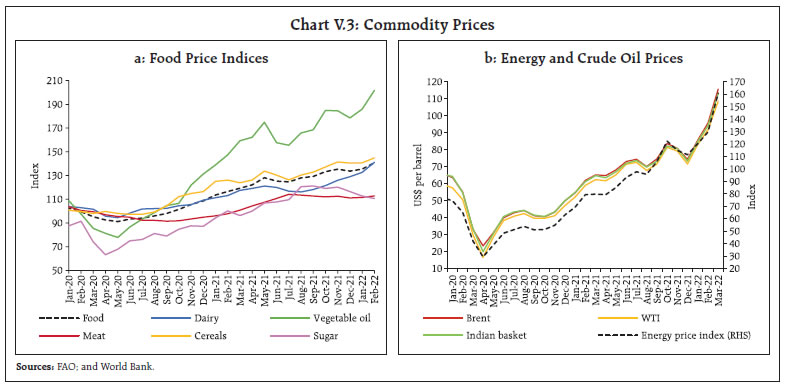
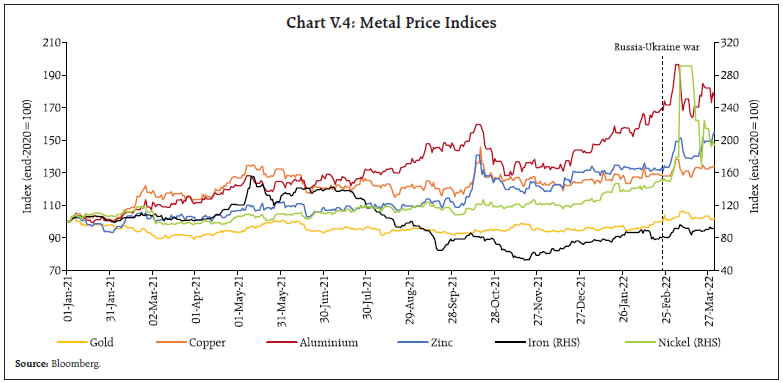 Inflation ratcheted up across economies on cost push pressures from persistent supply chain bottlenecks, high commodity prices and spiralling wage pressures. Headline inflation has soared to multi-decadal highs across most AEs, barring Japan; for EMEs too, barring China and Indonesia, it continued to hover at elevated levels (Table V.3). High energy and food costs are the major drivers for inflation in AEs besides, price pressures in durable goods, particularly used cars and trucks, and services such as rents. For most EMEs, however, inflation is essentially driven by supply shocks with demand-pull pressures remaining relatively weak, given the slack in economic activity. In the US, headline inflation in terms of both the CPI and the personal consumption expenditure (PCE) price index – the Federal Reserve (Fed)’s preferred measure of inflation – edged up to fresh 40-year high of 7.9 per cent and 6.4 per cent, respectively, in February 2022 (Chart V.5a). The monthly momentum of inflation quickened from October 2021 primarily on surging energy, food and durable goods prices. Moreover, spiralling rents and building wage pressures mirrored in the multi-decadal high annual wage growth are fuelling broad-based price pressures. Core CPI inflation has also accelerated with shelter, used cars and trucks remaining the major contributors for most months. In February, other core components such as recreation, household furnishings and operations, personal care, and airline fares also registered increases. | Table V.3: Inflation | | (Per cent) | | Country | Inflation Target | Q1:2021 | Q2:2021 | Q3:2021 | Q4:2021 | Q1:2022 | | Advanced Economies | | Canada | 2.0 | 1.4 | 3.4 | 4.1 | 4.7 | 5.4 | | Euro area | 2.0 | 1.0 | 1.8 | 2.9 | 4.7 | 6.2 | | Japan | 2.0 | -0.5 | -0.8 | -0.2 | 0.5 | 0.7 | | South Korea | 2.0 | 1.4 | 2.5 | 2.5 | 3.6 | 3.8 | | UK | 2.0 | 0.6 | 2.0 | 2.8 | 4.9 | 5.9 | | US | 2.0 | 1.8 | 3.9 | 4.3 | 5.5 | 6.2 | | Emerging Market Economies | | Brazil | 3.50 ± 1.5 | 5.3 | 7.7 | 9.6 | 10.5 | 10.5 | | Russia | 4.0 | 5.6 | 6.0 | 6.9 | 8.3 | 8.9 | | India | 4.0 ± 2.0 | 4.9 | 5.6 | 5.1 | 5.0 | 6.0 | | China | – | 0.0 | 1.1 | 0.8 | 1.8 | 0.9 | | South Africa | 3.0 - 6.0 | 3.1 | 4.8 | 4.8 | 5.5 | 5.7 | | Mexico | 3.0 ± 1.0 | 4.0 | 6.0 | 5.8 | 7.0 | 7.2 | | Indonesia | 3.0 ± 1.0 | 1.4 | 1.5 | 1.6 | 1.8 | 2.3 | | Philippines | 3.0 ± 1.0 | 4.0 | 4.0 | 4.1 | 3.6 | 3.3 | | Thailand | 1.0 - 3.0 | -0.5 | 2.4 | 0.7 | 2.4 | 4.7 | | Turkey | 5.0 | 15.6 | 17.1 | 19.3 | 25.8 | 54.8 | Notes: (1) Quarterly inflation is the simple average of inflation in each month of the quarter. For Q1:2022, the full quarterly average is only for the Euro area, South Korea, Indonesia, Thailand, Philippines and Turkey while for others it is Jan-Feb average.
(2) Inflation for US is in terms of year-on-year change in personal consumption expenditure price index.
(3) The Bank of Canada aims to keep inflation at the 2 per cent mid-point of an inflation control target range of 1-3 per cent.
(4) Brazil’s inflation target for 2021 was 3.75 ± 1.5 per cent.
Sources: Central bank websites; and Bloomberg. | In the Euro area, CPI inflation has been treading above the European Central Bank (ECB)’s target of 2 per cent since July 2021, with the headline reading scaling historical high of 7.5 per cent in March 2022. Steep increase in energy prices, especially of natural gas, remained the major driver with ripple effects for other sectors. High costs of non-energy industrial goods as also rising food prices, and high transportation and fertiliser costs have been fuelling price pressures. Market-based measures of longer-term inflation expectations, however, have remained broadly stable at just below 2 per cent, thereby supporting the ECB’s expectation of moderation in prices over the course of the year once supply bottlenecks ease. CPI inflation in the UK accelerated since Q4:2021 to 6.2 per cent in February 2022 – its highest in the Office of National Statistic’s series which began in January 19971. Transport cost due to soaring energy prices contributed 1.6 percentage points to the increase. Inflationary pressures are high for food and durable goods as well, while broadening to the services sector partly due to change in value added tax (VAT) rates for hospitality services. Inflation remained relatively benign in Japan though deflation ended in September 2021. In February, inflation accelerated to a 3-year high of 0.9 per cent as high energy prices overshadowed the effects of weak housing cost and low telecom charges. The pick-up notwithstanding, inflation remains way below the Bank of Japan (BoJ)’s 2 per cent target. Among major EMEs, inflation in Brazil and Russia has risen to levels more than twice their respective targets since Q4:2021 despite monetary policy being tightened since March 2021 (Chart V.5b). In Brazil, increase in prices have become more widespread in recent months. Apart from elevated costs for industrial goods, acceleration in services inflation has also added to the upside. CPI inflation in Russia rose to 9.2 per cent in February 2022 with cost-push pressures stemming from commodity prices, labour shortages and capacity shortfalls spiralling amidst a steady demand recovery. In South Africa, CPI inflation has edged up but remains within the central bank’s target range. In January, however, inflation eased to 5.7 per cent following some softening in the cost of fuel and health services and remained steady in February. In China, unlike in other BRICS economies, CPI inflation remained subdued reflecting broad moderation in both food, especially pork, and non-food prices. Even core inflation has remained muted due to weakening demand for services amidst sporadic COVID-19 flare-ups and associated stringent restrictions. Producer price inflation has been easing since November after hitting a 26-year high in October, as price stabilisation measures cooled off the rally in raw material prices. 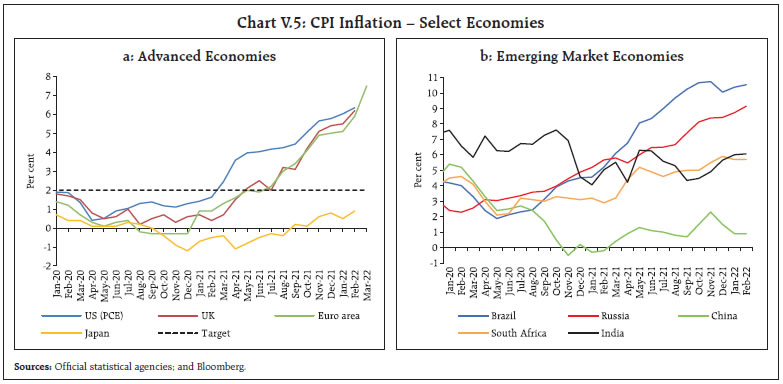 Recent research2 suggests that global inflation in 2022 could be 1.5 percentage points higher because of the increase in shipping costs in 2021. This is because the impact of rise in shipping costs peaks in 12 months and lasts up to 18 months. The increased supply disruptions due to the war and China lockdowns could further exacerbate the inflation upside. V.3 Monetary Policy Stance COVID-19 saw an unprecedented policy response mounted by governments and central banks. The IMF estimates that up to September 2021, US$16.9 trillion or 16.4 per cent of global GDP had been pledged as fiscal support in response to the pandemic, with US$14.5 trillion by AEs and US$2.4 trillion by EMEs, including the low-income developing countries (Table V.4). The total monetary support offered in response to the pandemic is estimated at US$19.0 trillion or 18.4 per cent of global GDP, of which US$16.1 trillion was by AE central banks and US$2.9 trillion by EME central banks. | Table V.4: Fiscal Support in Response to COVID-19 | | (Up to September 2021) | | (Amount in US$ billion; Per cent as proportion of GDP) | | Country | Amount | Per cent | | Advanced Economies | | | | Canada | 327 | 19.9 | | European Union | 1,361 | 10.5 | | Japan | 2,273 | 45.1 | | UK | 975 | 36.0 | | US | 5,838 | 27.9 | | Emerging Market Economies | | | | Brazil | 222 | 15.4 | | Russia | 96 | 6.5 | | India | 275 | 10.3 | | China | 903 | 6.1 | | South Africa | 30 | 9.4 | | World | 16,910 | 16.4 | | Source: IMF. | In the US, the Fed began tapering monthly asset purchases of US$120 billion in mid-November 2021 and wound-up purchases in four months. In its January meeting, the Fed issued a set of principles for reducing the size of its balance sheet: (i) target range for the federal funds rate would be the primary means of adjusting the stance of monetary policy; (ii) reduction in balance sheet size would commence after a lift-off of interest rates; (iii) size of holdings would go down by adjusting the amount of re-investment of maturing securities; (iv) to eventually hold quantum of securities as needed to implement monetary policy efficiently and effectively in an ample reserves regime; and (v) to eventually hold primarily Treasury securities. In its March 2022 meeting, Fed raised the target range for the Federal Funds rate by 25 bps to 0.25-0.5 per cent, the first rate hike since December 2018. To operationalise the rate hike, the Fed revised up the interest rates on reserve balance and overnight reverse repurchase agreement by 25 bps each to 0.4 per cent and 0.3 per cent, respectively. According to the Summary of Economic Projections released in March 2022, the majority of FOMC participants expect interest rate to be 1.75-2.0 per cent by end-2022, i.e., a further 150 bps hike this year. In its October meeting, the ECB announced a slower pace of asset purchases under the Pandemic Emergency Purchase Programme (PEPP) in Q4:2021 than in the previous two quarters. In December, it further reduced the pace of purchases for Q1:2022 and announced discontinuation of PEPP at end-March 2022 but extended the reinvestment horizon by one year at least until end-2024. To smoothen the transition from end of PEPP purchases, the ECB announced doubling of monthly purchase under the Asset Purchase Programme (APP) to €40 billion (approximately US$45.3 billion)3 in Q2:2022, to gradually revert to €20 billion (approximately US$22.7 billion) by October 2022. In its March meeting, the ECB lowered the monthly purchases under APP from €40 billion (approximately US$43.9 billion) in each month of the quarter to a reduced schedule of €40 billion in April, €30 billion (approximately US$33 billion) in May and €20 billion (approximately US$22 billion) in June and announced end of APP purchases in Q3:2022. The Bank of England (BoE) maintained a pause on its policy rate in its November meeting. In December 2021, it raised the Bank Rate by 15 bps and in February by another 25 bps. Also, in keeping with the guidance of its August 2021 MPR4, the BoE announced that it would stop re-investing for its maturing stock of government bonds. It would begin selling from its portfolio of government bonds only after the Bank Rate reaches 1 per cent, conditional on economic circumstances at that time. The BoE also announced that it would stop re-investing for maturing corporate bonds and that it would initiate a programme of corporate bond sales to be completed not earlier than end-2023. In March 2022, the BoE raised the Bank Rate by a further 25 bps to 0.75 per cent, suggesting that further modest tightening would be appropriate in the coming months. In its December meeting, BoJ extended the Special Program to Support Financing in Response to the Novel Coronavirus by six months until end- September 2022. It also signalled the completion of additional purchases of commercial paper and corporate bonds by end-March 2022 and reversion to the pre-pandemic quantum of purchases from April 2022. In its March meeting, the BoJ said that inflation is likely to remain in positive territory for some time but maintained an overall dovish stance. Among other AE central banks, the Reserve Bank of Australia discontinued its yield curve control policy in November 2021 and halted weekly bond purchases in early February 2022. The Bank of Canada ended its weekly bond-buying programme in October 2021 and raised rate by 25 bps in March 2022 to 0.5 per cent. The Bank of Korea raised rates in November 2021 and January 2022 by 25 bps each to 1.25 per cent, while the Reserve Bank of New Zealand has cumulatively increased its policy rate by 75 bps since October 2021, taking it up to 1.0 per cent in February 2022 (Chart V.6a). On the other hand, the People’s Bank of China (PBoC) effected a 50 bps cut in the reserve requirement ratio from December 15, 2021, which injected 1.2 trillion yuan (approximately $188.3 billion) liquidity into the economy. The PBoC also initiated a monetary policy easing cycle by reducing the 1-year Loan Prime Rate (LPR) by 5 bps in December, followed by a 10 bps cut in January 2022, supported by a 5 bps reduction in the 5-year LPR and 10 bps reductions in the interest rate on 1-year medium-term lending facility loans and 7-day reverse repurchase agreements. Since then, the PBoC has maintained a pause. In contrast, most other EME central banks continued with policy tightening in Q4:2021 and into Q1:2022. The Banco Central do Brazil (BCB) effected three consecutive 150 bps hike in October 2021, December 2021 and February 2022 and a 100 bps hike in March, thereby, raising the Selic rate to 11.75 per cent. The South African Reserve Bank raised its policy rate by 25 bps in November 2021 – first hike in three years – and followed it up with two more 25 bps hikes in January and March 2022, taking the policy rate to 4.25 per cent (Chart V.6b). The Bank of Russia (BoR) had raised its key rate by 275 bps in three steps between October 2021 and early February 2022 on heightening inflation concerns. On February 28, 2022, in an emergency move, the BoR increased its key rate by 10.5 percentage points to 20 per cent to compensate for a sharp rouble depreciation and inflation risks amidst the geopolitical upheaval. It also undertook unbound fine-tuning operations to meet all liquidity needs of the banking system, besides other measures to shore up liquidity and the financial markets. As the structural liquidity deficit in the banking system continued to build, the BoR reduced the reserve requirement for banks to 2 per cent, releasing 2.7 trillion rouble (approximately US$26 billion) liquidity. The sanctions have precluded BoR’s access to its currency reserves in dollar and euros. Moreover, exclusion of major Russian banks from the Society for Worldwide Interbank Financial Telecommunications (SWIFT) would affect financial transactions with the rest of the world. The BoR maintained a pause on policy rate in its March meeting but announced purchase of government bonds to limit financial stability risks. 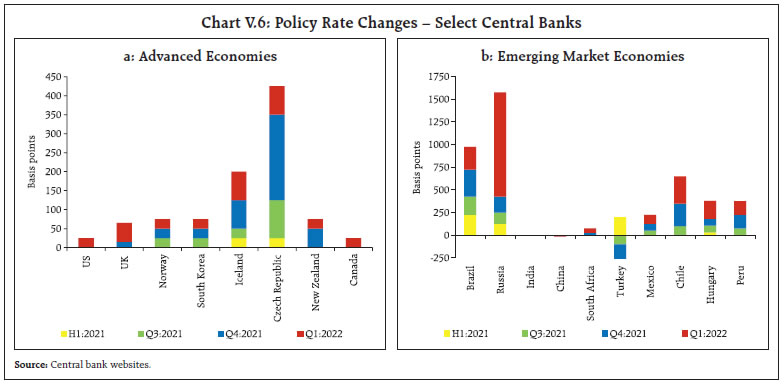 Banco de México hiked its policy rate in two steps for a total of 75 bps in Q4:2021 and by another 100 bps in Q1:2022 through 50 bps hikes each in February and March, taking the benchmark rate to 6.5 per cent. The central banks of Chile, Peru and Hungary continued their monetary tightening. The central bank of Turkey, on the other hand, followed up the 100 bps reduction in key rate in September with cuts of 200 bps in October and 100 bps each in November and December. It has, however, maintained a pause in 2022 so far, with its benchmark interest rate at 14 per cent. To normalise excess liquidity conditions, Bank Indonesia began a 300 bps increase in domestic currency reserve requirement for commercial banks in three steps from March to September 2022. V.4 Global Financial Markets Global financial markets remained largely buoyant, although the Omicron variant and policy pivots towards quicker normalisation caused sharp shifts in Q4:2021. Geopolitical tensions, however, took centre stage in Q1:2022, plunging them into a tailspin. Equity markets in most AEs and a few EMEs, shed the resilience of Q4 and went into a downswing for most part of Q1 before recouping some ground from mid-March (Chart V.7a). Bond yields had hardened across maturities, although slid briefly towards end-February as investors dashed to safe haven. The US dollar strengthened on hawkish Fed statements and safe haven demand, while EME currencies broadly weakened until mid-March. Among AEs, US equities rallied in October and early November, driven by upbeat corporate earnings data for Q3:2021 before giving up some gains towards end-November as Omicron and escalating headline inflation unnerved investors. The correction, however, proved short-lived, with the US S&P index paring losses in December as fears over the severity and economic impact of the new variant dissipated. It registered net gains in Q4 while ending 2021 almost 27 per cent per cent higher – the third successive year of double digit gains. Escalating Russia-Ukraine tensions alongside Fed’s hawkish pivot triggered sharp sell-offs in January, which intensified in late February and then rallied from mid-March to end of the quarter. European stock markets remained broadly supported in Q4:2021 by strong quarterly earnings and the ECB’s highly accommodative stance. In Q1:2022, however, markets turned extremely volatile, reversing all early gains on inflationary risks from soaring energy prices and heightened geopolitical tensions. From second week of March, European indices recovered partially on conflict resolution optimism. The Nikkei continued to lag other major AE stock indices, largely due to a relatively slower recovery in the Japanese economy. It ended Q4 in negative territory and plunged to a 15-month low in end-January as market priced in faster rate hikes by the US Fed. The downtrend steepened further, with Nikkei dipping to a 16-month low in early March following outbreak of the war, but positive developments lifted sentiments thereafter. The UK stock indices, on the other hand, have strengthened since Q4, albeit with intermittent corrections. Since mid-February, however, markets trimmed gains, tracking global cues, to close the month in the red. This was followed by a sharp plunge in the first week of March amid turbulent geopolitical conditions. In line with other AEs, stock markets in the UK picked up from the second week of March. EME stock markets underperformed developed markets, with the MSCI EME stock index posting negative returns in Q4:2021 as also for the full year. Country-specific factors weighed heavily on market sentiments along with the threats to the recovery from Omicron. Weakness intensified in Q1:2022 as most EME equity indices, barring a few commodity exporters, traded in the red on concerns over early policy tightening, mounting inflationary risks and worsening geopolitical conditions (Chart V.7b). Russian stocks plummeted by more than 30 per cent after the outbreak of war, following which trading was halted for almost a month before resuming gradually from March 24. For most other EME markets, optimism on intermittent peace talks revived confidence from mid-March, resulting in modest rise.  In treasury markets, bond yields across major AEs broadly rose in Q4:2021, as investors tussled with protracted inflation risks and withdrawal of monetary accommodation by major central banks (Chart V.8a). The increase was particularly sharp at the front end of the curve. As a result, the yield curve (10-year over 2-year) which was steepening till September, flattened since Q4. The significant hardening in bond yields since mid-December, however, reversed briefly in end-February and early March on flight to safety. Bond yields shifted higher thereafter in response to hawkish signals from the US Fed. The US 10-year bond yield raced up above 2.0 per cent in early February before retreating on safe haven demand. With the tightening cycle commencing, the 10-year bond yield moved up from mid-March, hitting a 3-year high of 2.5 per cent in the last week of the month. Tracking global cues, Japanese bond yields jumped to their highest level in six years in February, while German 10-year bond yield moved decisively into positive territory for the first time since May 2019 before dipping back into negative zone in early March amidst heightened tensions. From the second week of March, however, bond yields across AEs started increasing again, as the ECB pivoted towards normalisation, while the UK effected its third consecutive hike. Bond yields in major EMEs remained highly volatile and traded with a hardening bias as financial conditions tightened (Chart V.8b). 10-year bond yields in major EMEs show strong co-movement with the US 10-year treasury yield, though the strength of the co-movement varies across countries (Box V.2). Chinese bond yields, however, have generally softened on rising monetary accommodation. Bond yields have hardened for most EMEs from mid-February, with a notable spike in Russia, followed by some softening in second half of March. 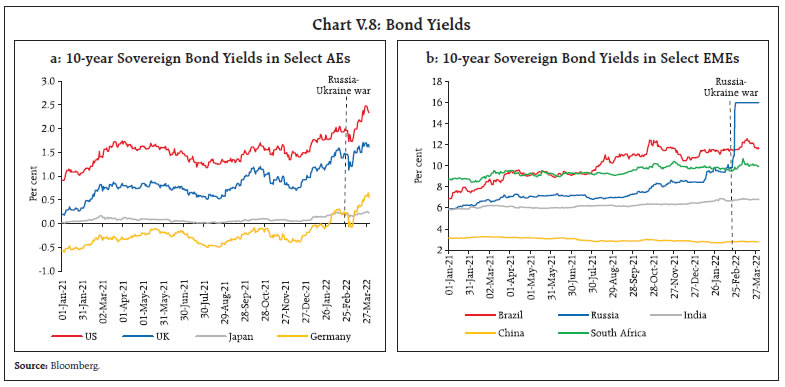
Box V.2: Interest Rate Spillovers from the US to Emerging Market Economies The US long-term yields impact other countries through various channels, with consequent portfolio rebalancing and capital outflows putting pressure on emerging market exchange rates and bond prices (Chart V.2.1). Correlation of movements in 10-year government bond yields of the US and eight EMEs5 viz., Brazil, Russia, India, China, South Africa, Indonesia, Mexico and Philippines and one AE6, i.e., Hong Kong is positive and significant (Table V.2.1). The forecast error variance decomposition (FEVD) based on a vector autoregression (VAR)7 examines sensitivity of long-term bond yields in EMEs to changes in US bond yields (Belke et. al, 2017). Measures of spillover intensities from the US to other countries and vice versa are estimated by using a spillover index (Diebold and Yilmaz, 2009). The Total Spillover Index (TSI)8 in our estimate measures the proportion of overall change in yields in the peer group that is due to shocks to other countries’ yields9.
| Table V.2.1: Correlation between 10-Year Bond Yields | | | US | India | Brazil | South Africa | China | Russia | Hong Kong | Philippines | Mexico | Indonesia | | US | 1.0 | | | | | | | | | | | India | 0.2* | 1.0 | | | | | | | | | | Brazil | 0.2* | 0.1* | 1.0 | | | | | | | | | South Africa | 0.2* | 0.1 | 0.4* | 1.0 | | | | | | | | China | 0.1 | 0.3* | 0.0 | 0.1 | 1.0 | | | | | | | Russia | 0.0 | 0.0 | 0.1 | 0.2* | 0.0 | 1.0 | | | | | | Hong Kong | 0.8* | 0.3* | 0.2* | 0.3* | 0.2* | 0.1 | 1.0 | | | | | Philippines | 0.2* | 0.2* | 0.2* | 0.3* | 0.1 | 0.1 | 0.2* | 1.0 | | | | Mexico | 0.4* | 0.2* | 0.3* | 0.5* | 0.1* | 0.2* | 0.4* | 0.4* | 1.0 | | | Indonesia | 0.2* | 0.1 | 0.4* | 0.4* | -0.1 | 0.1 | 0.1 | 0.4* | 0.4* | 1.0 | *: Statistically significant at 1 per cent level.
Note: Based on data for the period May 2003 to February 2022.
Source: RBI staff estimates. | The estimated generalised impulse responses for the VAR10 suggest that one standard deviation positive shock to the US bond yield leads to significant positive reactions in bond yields of most EMEs under consideration up to two months ahead (Chart V.2.2). The long-term co-movement in bond yields among countries, with the US generating strong spillovers have ramifications for financial and real variables in most EMEs. Yet, own shocks have the highest contribution to yield movements even for EMEs. | Table V.2.2: Spillover during May 2003 to February 2022 | | | US | India | Brazil | South Africa | China | Russia | Hong Kong | Philippines | Mexico | Indonesia | From Others | | US | 45.8 | 3.0 | 2.9 | 2.4 | 1.7 | 1.0 | 27.9 | 2.2 | 10.2 | 2.9 | 54.2 | | India | 6.0 | 67.4 | 2.3 | 3.5 | 6.7 | 0.2 | 7.5 | 2.1 | 1.6 | 2.7 | 32.6 | | Brazil | 6.0 | 0.8 | 58.5 | 10.0 | 2.4 | 2.4 | 3.6 | 1.0 | 8.7 | 6.7 | 41.5 | | South Africa | 2.9 | 0.1 | 8.7 | 52.4 | 0.4 | 1.9 | 3.4 | 6.4 | 10.7 | 13.0 | 47.6 | | China | 5.1 | 5.9 | 1.0 | 1.3 | 73.0 | 1.5 | 5.2 | 1.4 | 1.8 | 3.7 | 27.0 | | Russia | 0.6 | 1.0 | 2.1 | 4.8 | 0.0 | 75.3 | 3.0 | 3.7 | 4.3 | 5.3 | 24.7 | | Hong Kong | 30.6 | 3.2 | 2.1 | 2.8 | 1.9 | 1.9 | 45.6 | 1.7 | 7.3 | 2.7 | 54.4 | | Philippines | 5.2 | 2.1 | 0.8 | 6.9 | 0.9 | 2.8 | 3.5 | 57.5 | 9.3 | 10.9 | 42.5 | | Mexico | 14.1 | 0.5 | 6.2 | 9.1 | 1.0 | 2.9 | 7.8 | 8.1 | 44.1 | 6.1 | 55.9 | | Indonesia | 5.6 | 0.6 | 3.9 | 12.6 | 3.8 | 1.3 | 3.5 | 7.7 | 7.3 | 53.8 | 46.2 | | Contribution to others | 76.2 | 17.2 | 30.1 | 53.4 | 18.9 | 15.9 | 65.3 | 34.3 | 61.2 | 54.0 | 426.5 | | Contribution including own | 122.0 | 84.7 | 88.6 | 105.8 | 91.9 | 91.2 | 110.9 | 91.8 | 105.3 | 107.9 | | | Directional Spillover Index | 62.5% | 20.3% | 34.0% | 50.5% | 20.6% | 17.4% | 58.9% | 37.4% | 58.1% | 50.0% | | | Total Spillover Index | | | | | | | | | | | 42.6% | Note: The ijth entry in the Table V.2.2 is the estimated contribution to the forecast error variance of country i coming from innovations to country j. Hence the off-diagonal column sums (labelled Contributions to Others) or row sums (labelled Contributions from Others), when totalled across countries, give the numerator of the Total Spillover Index. Similarly, the column sums or row sums (including diagonals), when totalled across countries, give the denominator of the Total Spillover Index. Directional spillover from country i to others is given by the ratio of ith country’s contribution to others over total contribution of ith country including own.
Source: RBI staff estimates. |
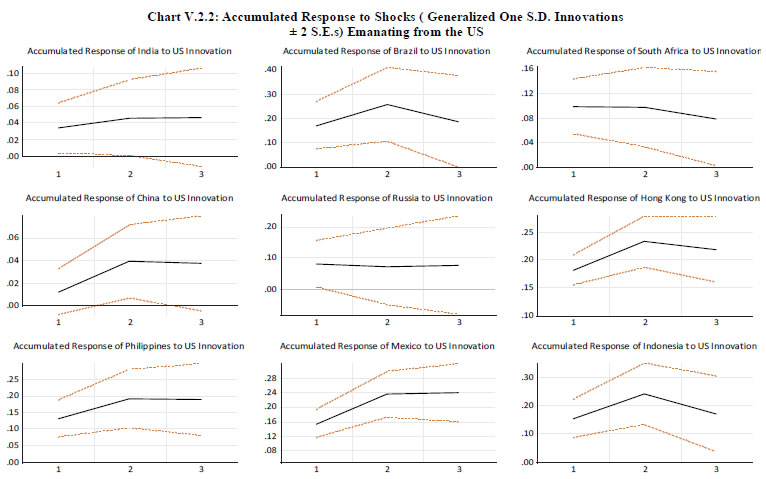 References: Belke, A., Dubova, I., and Volz, U. (2017) “Long-term Interest Rate Spillovers from Major Developed Economies to Emerging Asia”, ADBI Working Paper No. 705, March Diebold, F. X., & Yilmaz, K. (2009). Measuring Financial Asset Return and Volatility Spillovers, with Application to Global Equity Markets. The Economic Journal, 119(534), 158-171. | In the currency markets, the US dollar rallied strongly in Q4:2021 on Fed policy pivot (Chart V.9a). In Q1, after a brief spell of correction in early January, the US dollar recovered strongly but hit a patch of volatility. From the latter half of February, however, it rose steadily on safe haven demand due to the ongoing geopolitical upheaval, in addition to the anticipated US policy rate lift-off in March. It remained elevated in March with fluctuations in market sentiments imparting volatility. EME currencies moved in reverse tandem and broadly depreciated, barring a few commodity exporters. The index, however, moved up from mid-March. The MSCI Emerging Market Currency Index increased by 0.7 per cent in Q4:2021 and changed negligibly in Q1:2022. There has been retrenchment in capital flows since Q4:2021 culminating into net outflows in March (Chart V.9b). V.5 Conclusion Monetary authorities have begun exiting from the extraordinary accommodation prompted by the once-in-a-century COVID-19 crisis. The Russia-Ukraine war and its ramifications for global growth, inflation and financial conditions have overwhelmed the global outlook. With increasing risks to growth and financial stability, policy authorities need to steer a knife-edge course to avoid a crash landing. _______________________________________________________________________________________________
ABBREVIATIONS | AEs | Advanced Economies | | AEs | Advance Estimates | | AIC | Akaike Information Criterion | | AIDC | Agriculture Infrastructure and Development Cess | | APP | Asset Purchase Programme | | ARDL | Autoregressive Distributed Lag | | ASEAN | Association of Southeast Asian Nations | | ASISO | Automated Sweep-in and Sweep-out | | ATM | At the money | | bbl | Barrel | | BCB | Banco Central do Brazil | | BE | Budget Estimates | | BIES | Business Inflation Expectations Survey | | BIS | Bank for International Settlements | | BoE | Bank of England | | BoJ | Bank of Japan | | BoR | Bank of Russia | | bps | Basis Points | | BRICS | Brazil, Russia, India, China and South Africa | | BSE | Bombay Stock Exchange | | CACP | Commission for Agricultural Costs and Prices | | CCIL | Clearing Corporation of India Limited | | CD | Certificate of Deposit | | CDS | Credit Default Swap | | CI | Confidence Interval | | CiC | Currency in Circulation | | CII | Confederation of Indian Industry | | CLI | Composite Leading Indicator | | CMIE | Centre for Monitoring Indian Economy | | COVID-19 | Coronavirus Disease 2019 | | CP | Commercial Paper | | CPI | Consumer Price Index | | CPI-AL | Consumer Price Index for Agricultural Labourers | | CPI-IW | Consumer Price Index for Industrial Workers | | CPI-RL | Consumer Price Index for Rural Labourers | | CRR | Cash Reserve Ratio | | CU | Capacity Utilisation | | DCA | Department of Consumer Affairs | | DGCA | Directorate General of Civil Aviation | | DGCI&S | Directorate General of Commercial Intelligence and Statistics | | DII | Domestic Institutional Investor | | DSI | Directional Spillover Index | | DW | Durbin-Watson | | EBIT | Earnings Before Interest and Taxes | | ECB | European Central Bank | | ECI | Eight Core Industries | | ECLGS | Emergency Credit Line Guarantee Scheme | | ECT | Error Correction Term | | ECTA | Economic Cooperation and Trade Agreement | | EMEs | Emerging Market Economies | | EPFO | Employees’ Provident Fund Organisation | | ERRR | Effective Reverse Repo Rate | | FAO | Food and Agriculture Organization | | FBIL | Financial Benchmarks India Pvt. Ltd | | FDI | Foreign Direct Investment | | FE | Final Estimates | | Fed | Federal Reserve | | FEVD | Forecast Error Variance Decomposition | | FICCI | Federation of Indian Chambers of Commerce and Industry | | FIMMDA | Fixed Income Money Market and Derivatives Association of India | | FIs | Financial Institutions | | FIT | Flexible Inflation Targeting | | FOMC | Federal Open Market Committee | | FPI | Foreign Portfolio Investment | | FRE | First Revised Estimate | | FRRR | Fixed Rate Reverse Repo | | FTA | Free Trade Agreement | | F-TRAC | FIMMDA Trade Reporting and Confirmation System | | FY | Financial Year | | GDP | Gross Domestic Product | | GFCE | Government Final Consumption Expenditure | | GFCF | Gross Fixed Capital Formation | | GNDI | Gross National Disposable Income | | GoI | Government of India | | G-SAP | Government Securities Acquisition Programme | | GSCPI | Global Supply Chain Pressure Index | | G-Secs | Government Securities | | GST | Goods and Services Tax | | GVA | Gross Value Added | | H1 | First Half of the Financial Year (April-September) | | H2 | Second Half of the Financial Year (October-March) | | ICICI | Industrial Credit and Investment Corporation of India | | ICR | Interest Coverage Ratio | | IESH | Inflation Expectations Survey of Households | | IIF | Institute of International Finance | | IIP | Index of Industrial Production | | IMF | International Monetary Fund | | IND-AS | Indian Accounting Standard | | INR | Indian Rupee | | IOCL | Indian Oil Corporation Limited | | IPO | Initial Public Offering | | IRDAIA | Insurance Regulatory and Development Authority of India | | IRFCL | International Reserves and Foreign Currency Liquidity | | IT | Information Technology | | LAF | Liquidity Adjustment Facility | | LFPR | Labour Force Participation Rate | | LM | Lagrange Multiplier | | LPG | Liquefied Petroleum Gas | | LPR | Loan Prime Rate | | LTROs | Long Term Repo Operations | | MCLR | Marginal Cost of Funds Based Lending Rate | | MFs | Mutual Funds | | MGNREGA | Mahatma Gandhi National Rural Employment Guarantee Act | | MMRP | Modified Mixed Reference Period | | MOAFW | Ministry of Agriculture and Farmers’ Welfare | | MoH&FW | Ministry of Health and Family Welfare | | m-o-m | Month-on-Month | | MOSPI | Ministry of Statistics and Programme Implementation | | MPC | Monetary Policy Committee | | MPR | Monetary Policy Report | | MSCI | Morgan Stanley Capital International | | MSEs | Micro and Small Enterprises | | MSF | Marginal Standing Facility | | MSMEs | Micro, Small and Medium Enterprises | | NAFED | National Agricultural Cooperative Marketing Federation of India Ltd | | NBFCs | Non-Banking Financial Companies | | NCAER | National Council of Applied Economic Research | | NDS | Negotiated Dealing System | | NDTL | Net Demand and Time Liabilities | | NEER | Nominal Effective Exchange Rate | | NGNF | Non-Government Non-Financial | | NPA | Non-Performing Asset | | NSC | National Savings Certificate | | NSDL | National Securities Depository Limited | | NSO | National Statistical Office | | NSSO | National Sample Survey Office | | OECD | Organisation for Economic Co-operation and Development | | Ofgem | Office of Gas and Electricity Markets | | OFS | Offer for Sale | | OLS | Ordinary Least Squares | | OMC | Oil Marketing Companies | | OMO | Open Market Operations | | OPEC | Organization of the Petroleum Exporting Countries | | OTC | Over-the-Counter | | PADO | Public Administration, Defence and Other services | | PBOC | People’s Bank of China | | PCE | Personal Consumption Expenditure | | PEPP | Pandemic Emergency Purchase Programme | | PFCE | Private Final Consumption Expenditure | | PFCED | Private Final Consumption Expenditure Deflactor | | PLI | Production Linked Incentive | | PMGKAY | Pradhan Mantri Garib Kalyan Anna Yojana | | PMI | Purchasing Managers’ Index | | POL | Petroleum, Oil and Lubricants | | POSOCO | Power System Operation Corporation Limited | | PPAC | Petroleum Planning and Analysis Cell | | PSB | Public Sector Bank | | PSF | Price Stabilisation Fund | | PSU | Public Sector Undertaking | | PvB | Private Sector Banks | | Q1 | First Quarter | | Q2 | Second Quarter | |
| Q3 | Third Quarter | | Q4 | Fourth Quarter | | q-o-q | Quarter-on-Quarter | | RBD | Refined Bleached Deodorised | | RBI | Reserve Bank of India | | RE | Revised Estimates | | REER | Real Effective Exchange Rate | | RHS | Right Hand Side | | RL | Rural Labourers | | SAAR | Seasonally Adjusted Annualised Rate | | SCB | Scheduled Commercial Bank | | SDF | Standing Deposit Facility | | SDL | State Development Loan | | SEBI | Securities and Exchange Board of India | | SEZ | Special Economic Zones | | SFB | Small Finance Banks | | SIAM | Society of Indian Automobile Manufacturers | | SLR | Statutory Liquidity Ratio | | SLTRO | Special Long-Term Repo Operations | | SME | Small and Medium Size Enterprise | |
| SPF | Survey of Professional Forecasters | | STU | Stocks-to-Use | | SWIFT | Society for Worldwide Interbank Financial Telecommunications | | T-Bill | Treasury Bill | | TLTRO | Targeted Long Term Repo Operation | | TSI | Total Spillover Index | |
|
| UAE | United Arab Emirates | | UDAN | Ude Desh ka Aam Naagrik | | UK | United Kingdom | | UNCTAD | United Nations Conference on Trade and Development | | US | United States | | US$ | US Dollar | | USDA | United States Department of Agriculture | | UT | Union Territory | | VAR | Vector Autoregression | | VAT | Value Added Tax | | VRR | Variable Rate Repo | | VRRR | Variable Rate Reverse Repo | | WAC | Weighted Average Coupon | | WACR | Weighted Average Call Money Rate | | WADR | Weighted Average Discount Rate | | WADTDR | Weighted Average Domestic Term Deposit Rate | | WALR | Weighted Average Lending Rate | | WAM | Weighted Average Maturity | | WAR | Weighted Average Rate | | WEO | World Economic Outlook | | WMA | Ways and Means Advances | | WPI | Wholesale Price Index | | WTO | World Trade Organization | | y-o-y | Year-on-Year | | YTD | Year to Date | |