The global economy has been shedding momentum in a downturn that commenced from the first quarter of 2018 in an environment vitiated by escalation in trade tensions, elevated financial vulnerabilities, geo-political risks and associated policy uncertainties. The implementation of global regulatory reforms after the global financial crisis (GFC) has led to an increase in banks’ capital and liquidity buffers. Their efforts to reduce bad loans and strengthen balance sheets have, however, been hindered in the environment of low growth and low interest rates. Globally, policy makers have been fortifying the regulatory framework and implementing internationally accepted norms for banks. These policies may not show immediate results, but they should pay back in the medium to long run by enhancing the soundness and resilience of the global banking system. 1. Introduction II.1 The global economy has been shedding momentum in a downturn that commenced from the first quarter of 2018 in an environment vitiated by escalation in trade tensions, elevated financial vulnerabilities, geo-political risks and associated policy uncertainties. Across the world and across advanced and emerging market economies (EMEs) alike, monetary policy has turned accommodative in order to counter the slowdown and prevent it from deepening. Available fiscal space is being used to support demand, but with the stark recognition that policy space is either limited or exhausted. II.2 Bank lending to the non-financial sector has moderated since the latter half of 2018 across advanced economies (AEs) and EMEs as heightened financial fragilities, including elevated and rising debt levels, have purveyed risk aversion alongside the weakening of demand. Although banks and financial institutions remained well capitalised, their profitability remains muted. II.3 Against this backdrop, Section 2 reviews the macro-financial setting in which global banking system is dealing with these testing challenges. The performance of the global banking system is analysed in Section 3 followed by a focus on the performance of the world’s 100 largest banks in Section 4. The path travelled on the global policy reforms agenda is discussed in Section 5. Section 6 concludes the chapter. 2. The Macro-Financial Environment II.4 Although the growth slowdown is synchronised across more than 90 per cent of the global economy, it is turning out to be more pronounced in AEs1 (Chart II.1a). Structural weaknesses in systemic economies, natural disasters, and country-specific factors have exacerbated the growing slack. In EMEs, heightened volatility in capital flows, exchange rates and asset prices have marred macro-economic prospects as global spillovers have interacted with country-specific factors in some of them, including unsustainable macro-balances, high levels of government debt and inflation pressures stemming from currency depreciations despite weakening of commodity prices (Chart II.1b, c and d). 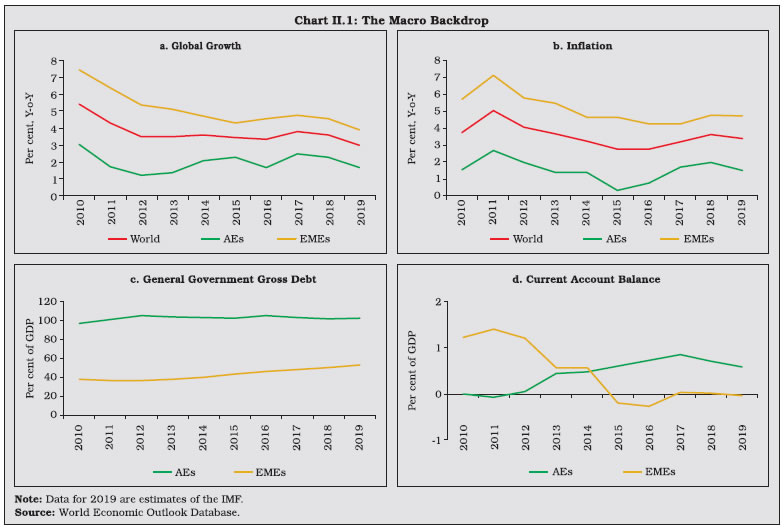 II.5 Taking into account these factors, the International Monetary Fund (IMF) downgraded its forecast of global growth for 2019 to 3 per cent in October 2019, the slowest pace since the global financial crisis (GFC)2. The World Trade Organisation (WTO) also lowered its projection of world merchandise trade volume for 2019 to 1.2 per cent from 2.6 per cent projected earlier3. II.6 Though bank credit growth moderated through H2:2018 and Q1:2019, some recovery was witnessed in Q2:2019. However, the pace has varied on country-specific factors, such as financial conditions and the health of bank balance sheets. In some AEs, notably the US, pro-cyclical fiscal expansion, accommodative monetary policy and supportive financial conditions have shored up credit expansion. By contrast, credit growth in the Euro area was anaemic, reflecting deceleration in demand and fragilities in the banking sector. The large exposure of Euro area banks to sovereign bonds remained a major risk, although considerable cross-country heterogeneity was evident within it (Chart II.2). 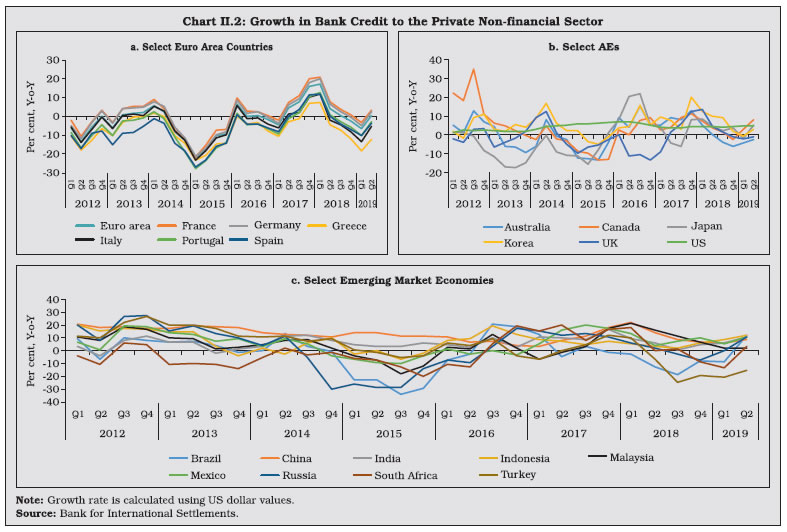 II.7 Among EMEs, wide variations are evident, with one end of the spectrum experiencing credit contraction as in Brazil on account of deleveraging of subsidised credit, high intermediation margins and weak demand. In some other EMEs such as Russia and India, elevated loan delinquencies operated as a drag on credit growth, whereas in China, policy-induced rebalancing, regulatory tightening and deleveraging efforts are acting as inhibiting factors. 3. Performance of the Global Banking Sector II.8 Progress was made albeit at varying speeds across jurisdictions in the application of Basel III norms. In this context, a core set of indicators measuring profitability, asset quality, capital adequacy and leverage are reviewed in this sub-section. 3.1 Return on Assets II.9 In an overall environment of low profitability, US banks performed considerably better than those in the Euro area and Japan. In the Euro area, bank profitability was impacted by weak growth and high NPLs, although in peripheral economies such as Portugal and Spain, there was a modest recovery due to lower loan loss provisioning. For the region as a whole, though, structural weaknesses such as low cost-efficiency, limited revenue diversification and high stocks of legacy assets in some jurisdictions remain as headwinds to a fuller revival. Australian and Canadian banks maintained better profitability than their peers in other AEs. II.10 Among EMEs, the profitability of Indian banks remained muted, though recent quarters indicate improvement. The profitability of Chinese banks also came under pressure in 2018 from asset quality issues, ongoing deleveraging, decelerating loan growth and weak balance sheets of small and medium-sized banks. in 2019 so far, Chinese banks showed resilience as their profits bounced back. This was backed by reduction in provisioning and was led by large banks. Profitability of Russian banks improved despite high loan delinquencies, as non-performing loans (NPLs) were well provisioned for, and both net interest income, and fee and commission income also increased. Indonesian banks turned out to be among the most profitable among EMEs on the strength of high interest margins and robust credit growth. Banks in Mexico, South Africa and Brazil posted robust RoAs (Table II.1). 3.2 Capital Adequacy II.11 Capital positions have improved consistently across major AE banks on the back of implementation of Basel III norms, including additional capital buffers for systemically important entities. In countries such as Greece and Italy, however, the improvement in capital position was halted by elevated levels of non-performing loans. II.12 Banks in major EMEs managed to build up capital buffers, with Indonesian banks maintaining the highest CRARs. Chinese banks strengthened their capital positions, particularly the small and medium sized ones. Although stressed assets remained elevated, the capital position of Russian banks improved during 2018 but were lower than in other major EMEs. CRARs of banks in India improved on the back of capital infusion in public sector banks by the Government and capital raising efforts by private sector banks (Table II.2). 3.3 Asset Quality II.13 NPLs eased in most of the peripheral economies of the Euro-zone as the process of deleveraging continued, mainly through institutional and government intervention. Impaired loan ratios of Greek banks remained the highest in Europe despite asset sales and write-offs. The search for yields in a low-interest rate and low growth environment is pushing banks across the Euro area to increase their holdings of government securities, although it could also be inducing some degree of adverse selection in loan books. NPA ratio in core Euro area economies, such as France and Germany, remained at a much lower level with declining trend. 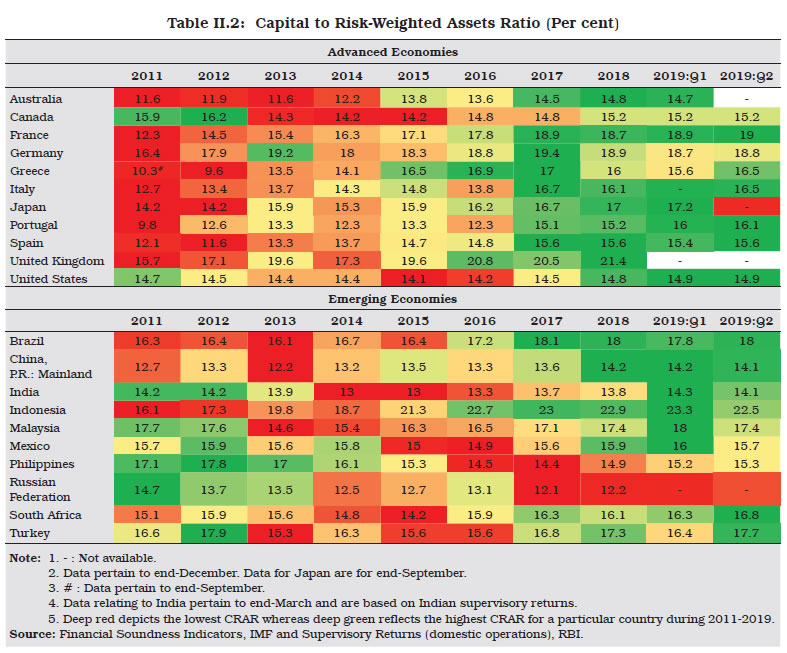 II.14 The asset quality of EME banks showed a mixed picture, improving in Brazil and India but deteriorating in Russia, South Africa and Turkey. In particular, NPL ratios of Russian banks worsened further due to fragile economic conditions and sanctions. Banks in South Africa and Turkey also experienced deterioration in asset quality as financial conditions weakened. Various sector specific issues continued to weigh on the asset quality of banks in India. However, progress in resolution of impaired assets and various measures to clean up balance sheets albeit slow, is imparting a stabilising influence (Table II.3). 3.4 Leverage Ratio II.15 Leverage ratio, defined as supervisory Tier 1 capital divided by total exposure, aims to counteract pro-cyclicality embedded in risk-based capital requirements. Basel III norms require a minimum leverage ratio of 3 per cent. Since 2010 a general improvement in the leverage ratio has occurred across both AEs and EMEs due to Basel III regulatory requirements. uptick in the leverage ratio of banks in countries such as Mexico and the Philippines reflected the implementation of the minimum leverage ratio (Table II.4). 3.5 Financial Market Indicators II.16 Stock indices relating to US banks declined by around 18.3 per cent during 2018 followed by robust recovery of 29.4 per cent in 2019 (up to December 9). The volatility in US bank stock prices partly reflects ebbs and flows attributed to trade tensions and temporary truces and uncertainty about the global economic outlook4. In the Eurozone, negative interest rates, subdued economic growth outlook, various structural issues and political uncertainty weighed on bank stock indices, which lost about 30 per cent of their levels since the end of 2017. Returns on bank stocks in EMEs were held down by poor performance. Sell-offs by portfolio investors also pulled down prices (Chart II.3a). 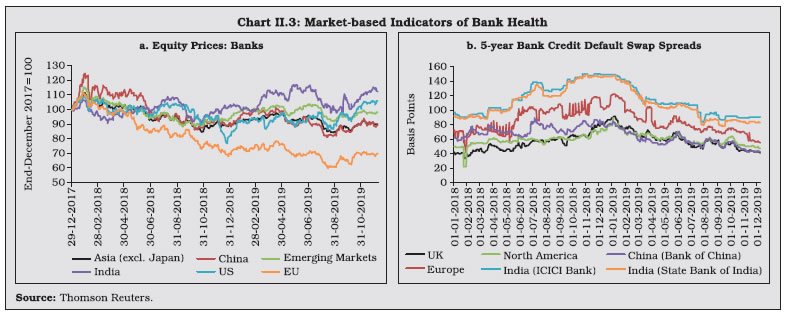 II.17 Credit default swap (CDS) spreads indicate the perceived solvency of banks and their ability to refinance. Banks with lower and more stable CDS spreads pay lower risk premia which in turn enables cheaper and easier financing terms for their customers. CDS spread of banks has ebbed after increasing in H2:2018. The lowest CDS spreads were reported by banks located in the UK and North America. In recent months, CDS spreads of Bank of China closely tracked those of UK and North American banks. Euro zone bank spreads remained higher than those in the US and the UK due to lower sovereign credit rating and poorer loan quality. The sensitivity of CDS spreads to political uncertainty in Euro area has remained high due to the sovereign-financial sector nexus in many of the peripheral economies (Chart II.3b). 4. World’s Largest Banks5 II.18 The number of banks in the top 100 category, ranked by Tier-I capital, remained the same across 2017 and 2018 in the AEs and EMEs (Chart II.4a). An increase in the share of assets held by banks in EMEs in 2018 was driven by China, which had 18 banks in the top 100 list. The US increased its share in the top 100 banks at the cost of Sweden (Chart II.4b). However, the total assets of the top 100 banks witnessed a marginal decline in 2018 across AEs and EMEs from a year ago. One bank each in Germany, UK, Japan and Brazil recorded declines in assets of more than 10 per cent. II.19 The median RoA of the top 100 banks declined in 2018 due to a fall in both net interest income and net non-interest income. Provisioning requirements declined, however, on a marginal improvement in asset quality (Chart II.5a and b). II.20 The capital positions of the top 100 banks remained strong, with 48 banks recording CRARs of more than 16 per cent in 2018. At the other end of the spectrum, banks with CRARs less than 12 per cent declined. Another area of improvement was the leverage ratio, with only three banks - one each in France, Germany and Japan - going below 4 per cent but remaining above 3 per cent as prescribed under Basel III regulations (Chart II.6a and b). 5. Global Banking Policy Developments II.21 The implementation of global regulatory reforms after the GFC has led to an increase in banks’ capital and liquidity buffers. Their efforts to reduce bad loans and strengthen balance sheets have, however, been hindered in the environment of low growth and low interest rates. II.22 Post-GFC global financial sector reforms initiatives consist of four key elements: (i) making financial institutions more resilient; (ii) ending the too-big-to-fail (TBTF) phenomenon; (iii) making derivatives markets safer; and (iv) promoting resilient non-bank financial intermediation. The reforms are at various stages of implementation. The Financial Stability Board (FSB) evaluates their effectiveness, and simultaneously develops new policies to address emerging risks to financial stability. Work is also underway to strengthen governance standards to reduce misconduct risks and to assess and address the decline in correspondent banking.
5.1 Building Resilient Financial Institutions II.23 Most FSB members have adopted the core elements of the Basel III risk-based capital rules and the leverage ratio. Significant progress has been made in the implementation of the Liquidity Coverage Ratio (LCR) and the Net Stable Funding Ratio (NSFR)6. However, the latest progress report of the Basel Committee on Banking Supervision (BCBS)7 points out three areas where adoption of Basel standards is lagging across jurisdictions, viz., i) securitisation framework; ii) capital requirements for equity investments in funds; and iii) margin requirements for non-centrally cleared derivatives (NCCDs)8. 5.2 Too-Big-To-Fail II.24 Implementation of the policy framework for too-big-to-fail banks has advanced the most for global systemically important banks (G-SIBs). However, substantial work remains to be done for achieving effective resolution regimes and operationalising plans for systemically important banks and non-bank financial institutions. Almost all G-SIB home and key host jurisdictions have in place comprehensive bank resolution regimes that align with the FSB’s Key Attributes of Effective Resolution Regimes for Financial Institutions. However, implementation of resolution powers and of resolution planning requirements is still incomplete in several jurisdictions. External total loss-absorbing capacity (TLAC) requirements have now been finalised in all the AE G-SIB home jurisdictions (six more since 2018). However, implementation of internal TLAC is less advanced and only a few jurisdictions have introduced the BCBS requirements on TLAC cross-holdings or disclosures. 5.3 Making Derivatives Markets Safer II.25 Significant progress has been made in the over-the-counter (OTC) derivatives market reforms. Comprehensive trade reporting requirements have been implemented in 23 jurisdictions (one more since 2018), although internationally, trade reporting remains less than truly effective. Implementation of frameworks for central clearing (18 jurisdictions), platform trading (13 jurisdictions) and margin requirements for non-centrally cleared derivatives (16 jurisdictions) are still underway. India has implemented trade reporting and interim capital requirements, while it has shown positive changes in margin requirements and platform trading in respect of OTC derivatives. Currently, India is fully compliant with the G-20 commitment on trade reporting requirements. All OTC derivative trades—both inter-bank and client trades relating to interest rate, forex and credit (Rupee Interest Rate Swap (IRS)/ Forward Rate Agreement (FRA), Forex forwards, Forex options, CDS etc.)—are reported to the Reserve Bank’s approved trade repository, i.e., the Clearing Corporation of India Ltd. (CCIL). India has also mandated the use of Legal Entity Identifier (LEI) for all non-individual OTC derivative trades in interest rate, forex and credit markets. 5.4 Promoting Resilient Non-bank Financial Intermediation II.26 Non-bank financial intermediation provides a valuable alternative to bank financing in greasing the wheels of real economic activity. However, maturity/liquidity transformations inherent in such intermediation inevitably involve leveraging, and liquidity mismatches which can become a source of systemic risk. Interconnectedness vis a vis the banking system is an additional source of risk. Globally, the total financial assets of the monitoring universe of non-bank financial intermediation (MUNFI) grew by 7.0 per cent to US$184.3 trillion in 20179. The assets of other financial intermediaries (OFIs) grew by 7.6 per cent to $116.6 trillion. Structured finance vehicles (SFVs) expanded their balance sheets for the first time since the GFC. II.27 The implementation of FSB policy reforms for non-bank financial intermediaries are at an early stage10. Out of 24 member jurisdictions, nine have not implemented measures for valuation, liquidity management and stable net asset value (NAV) for Money Market Funds (MMFs); similarly, 9 out of 24 jurisdictions have also not implemented measures for securitisation framework. India, on the other hand, has both the implementation measures in place. 5.5 Climate-related Financial Disclosures II.28 The FSB published the second status report on adoption of the recommendations of the Task Force for Climate-related Financial Disclosures on June 5, 2019. The report observed that disclosure of climate-related financial information has increased since 2016, but is still insufficient for investors, especially on the financial impact of climate-related issues on companies. II.29 In this regard, green finance offers new opportunities for diversification of financial assets and enhances the ability of the financial system to mobilise private capital for a more sustainable low-carbon economy (Box II.1). Box II.1: Opportunities and Challenges of Green Finance The impact of climate change on the financial system manifests through various risks, inter alia, loss or damage to tangible assets arising from frequent natural disasters and financial stability implications emanating from volatility in food prices due to erratic weather trends, elevated credit spreads and greater precautionary saving. Enormous amounts of investments are required to combat climate change and bring about a transformation towards sustainable and low carbon development. As public funding alone cannot finance the necessary transformation required to address climate change, green finance is required to be harnessed for financing environment-friendly sustainable development. The green finance ecosystem seeks to raise financial flows from banking, micro-credit and insurance sectors as well as from public, private and not-for-profit sectors. Central banks can use several policy tools for climate change mitigation including disclosure requirements relating to all climate-related financial risks, green macro-prudential regulation such as higher risk-weights for carbon-intensive sectors; differentiated capital and reserve requirements for banks with higher green lending; and green credit policy instruments in the form of subsidized loan rates for priority sectors (UN Environment, 2017). European Central Bank has formally identified climate-related risk as one of the key risks facing the banking sector. It computes the impact of climate-related changes on banks’ capital positions, and, ultimately, on the supply of funds to the economy. People’s Bank of China considers environmental factors in its monetary policy framework and financial stability assessments. The Central Bank of Brazil requires banks to factor in environmental risks while computing capital requirements. Similarly, upon ascertaining the energy saving potential of the financed project, the Central Bank of Lebanon gives exemption to commercial banks in the form of lower required reserves for financing such projects. Green bonds, carbon market instruments, and FinTech-based green funds are now at the forefront of climate change financing. The market for green bonds has issuers from more than 50 countries, including multilateral institutions like the World Bank. During 2007-2018, cumulative issuances of green bonds worldwide has been US$ 521 billion, with India ranking second among EMEs in these issuances (Climate Bonds Initiative, 2019). Green loans are another vibrant instrument, with issuances amounting to US$ 60 billion in 2018, with an average maturity of over 15 years. Over 75 per cent of outstanding green loans were directed to renewable energy and power generation companies (Institute of International Finance, 2019). Supranational institutions have been increasingly contributing to these efforts, with the International Monetary Fund (IMF) already incorporating the same into its multilateral and bilateral surveillance. In September 2019, the Bank for International Settlements (BIS) launched an open-ended US dollar denominated fund for central bank investments in green bonds aimed at management of their forex reserves and to support the deepening of the green-bond market. Notwithstanding its advantages, literature provides no irrefutable evidence that sustainable funds out-or-underperform conventional funds. There is also little evidence that costs of issuance of green bonds are lower than those of conventional bonds (IMF, 2019). Studies suggest that developing universally accepted standard and definition will improve the pricing of green bonds and foster the development of green bond markets (World Bank, 2018). In the Indian context, preliminary estimates conducted for Paris Agreement suggest that at least US$ 2.5 trillion (at 2014-15 prices) will be required for meeting its climate change actions between 2015 and 2030 (Government of India, 2015). India’s ambition of generating 175 gigawatts of renewable energy by 2022 also entails massive funding. As early as 2007, the Reserve Bank emphasised the need for non-financial reporting and urged financial institutions to adhere to sustainable development practices. Banks in India have been sensitized to the various international initiatives including the Equator principles11. In 2015, the Reserve Bank included lending to social infrastructure and small renewable energy projects within priority sector lending targets, thereby giving a further fillip to green financing. India figures prominently vis-à-vis its EME peers in green bonds issuances (Chart 1). As a proportion to the total bond market too, Indian issuances of green bonds compare favourably with its peers (Chart 2). With the green bond issuances gaining momentum—totalling about US$ 7.7 billion during 2012-2018—SEBI set out disclosure requirements for the issuance and listing of green debt securities in India in May 2017. Notwithstanding this progress, the development of green finance faces many challenges, such as “greenwashing” or false claims of environmental compliance, plurality of green loan definitions, and maturity mismatches between long-term green investment and relatively short-term interests of investors. Policy action is needed to establish an enabling framework that promotes the green finance eco-system in India by fostering awareness through coordinated efforts. Deepening of corporate bond market, standardisation of green investment terminology, consistent corporate reporting, and removing information asymmetry between investors and recipients can make a significant contribution in addressing some of the shortcomings of the green finance market. References Climate Bonds Initiative (2019), ‘Green Bonds: The State of the Market 2018’. Government of India (2015), ‘India’s Intended Nationally Determined Contribution is Balanced and Comprehensive: Environment Minister,’ October 2, 2015, Press Information Bureau Release, Ministry of Environment, Forest and Climate Change, available at https://pib.gov.in/newsite/PrintRelease.aspx?relid=128403. Institute of International Finance (2019), ‘Sustainable Finance in Focus - Green Loans—Kickoff Time!’ May 1. International Monetary Fund (2019), ‘Global Financial Stability Report- Lower for Longer’, October. UN Environment (2017), ‘On the Role of Central Banks in Enhancing Green Finance’, Inquiry Working Paper, 17/01, February. World Bank (2018), ‘The Price of Greenness: Some Evidence from Green Bond Markets’, September 27. | 5.6 Misconduct Risks II.30 In November 2018, the FSB introduced a toolkit of measures which supervisors and firms can use to strengthen the governance frameworks of financial institutions by increasing the accountability of senior management for misconduct within their firms. The recommendations identify a core set of data for the effective supervision of compensation practices. The toolkit complements other elements of the FSB’s Misconduct Action Plan, including compensation recommendations that align risk and reward better, as part of broader measures to restore public trust in the financial system. 5.7 Correspondent Banking and Remittances II.31 Recent years have witnessed a decline in correspondent banking12 due to de-risking, a development impinging on the access to the international financial system. As the reduction in correspondent banking relationships has a significant impact on the ability of the remittance service providers (RSPs) to access banking services, this in turn may drive some payment flows underground. In 2018, the number of correspondent banking relationships and active corridors13 declined further by 3.5 per cent and 2.0 per cent, respectively14, after having declined by about 20 per cent and 10 per cent, respectively, during 2012-2018. For EMEs in which remittance flows are a key source of funds for households, this could have potentially adverse consequences on growth, financial inclusion and international trade. In March 2018, the FSB recommended a set of measures to address problems faced by RSPs in obtaining access to banking services and identified a variety of intertwined drivers underlying the termination of banking services to RSPs, including low profitability, the perceived high risk of the remittance sector from the point of view of anti-money laundering / combatting the financing of terrorism (AML/CFT), supervision of RSPs and compliance with international standards. 6. Summing up II.32 Hand in hand with the growth slowdown that began in 2018, credit growth, being procyclical, has slowed down across major economies, which, in turn, has adversely affected bank profitability. Despite distinct improvement in asset quality, structural weaknesses remain in the banking systems in various economies across the world, although capital position has been strengthened. Banks are facing increasing competition from non-traditional players, such as FinTech and BigTech firms, which are taking advantage of digital innovation. They too pose a challenge to banking regulators in achieving a balance between promoting innovation and applying a uniform supervisory and regulatory framework. Globally, policy makers have been fortifying the regulatory framework and implementing internationally accepted norms for banks. These policies may not show immediate results, but they should pay back in the medium to long run by enhancing the soundness and resilience of the global banking system.
|