The consolidated balance sheet of urban co-operative banks (UCBs) moderated in 2017-18 as the impact of the demonetisation-induced expansion in deposits in the preceding year waned. Asset quality improved, although overall profitability moderated. Among rural co-operatives, state co-operative banks (StCBs) improved their NPA ratios and profitability, but in other segments – district central co-operative banks (DCCBs), state co-operative agriculture and rural development banks (SCARDBs) and primary co-operative agriculture and rural development banks (PCARDBs) – losses mounted alongside a rise in loan delinquency. 1. Introduction V.1 Co-operative institutions play a significant role in credit delivery to unbanked segments of the population and financial inclusion within the multi-agency approach adopted in India in this context. They consisted of 1,551 urban co-operative banks (UCBs) at end-March 2018 and 96,612 rural co-operative banks at end-March 2017, with the latter accounting for 65.8 per cent of the total asset size of all co-operatives taken together1,2 (Chart V.1). 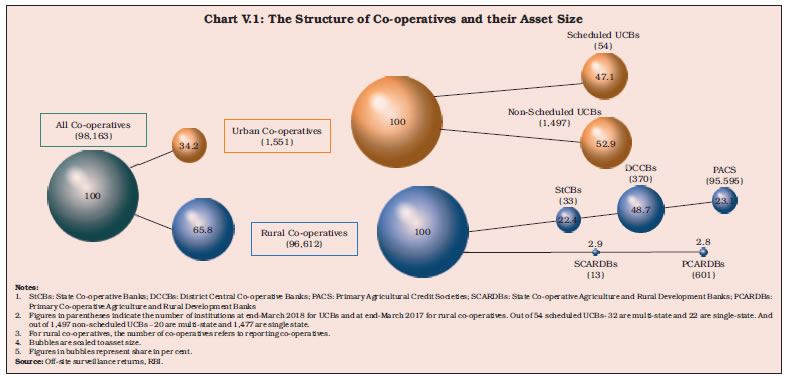 V.2 While UCBs strive to deliver institutional credit at affordable costs in urban and semi-urban areas, rural co-operatives provide financial services in villages and small towns by leveraging on their geographical and demographic outreach. The growth of co-operative institutions has not, however, been commensurate with the overall growth of the banking sector – at the end of March 2017, they accounted for only 11 per cent of the total assets of scheduled commercial banks (SCBs) in comparison to 19 per cent share in 2004-05. While remedial measures initiated by the Reserve Bank have resulted in consolidation in the UCB sector, weaknesses in the rural co-operative segment persist, reflecting operational and governance-related impediments. V.3 Against this backdrop, this chapter analyses the performance of UCBs and rural co-operatives in the year gone by, caveated with the lags in availability of information for the latter, as indicated earlier. The rest of the chapter is organised into four sections. Section 2 analyses balance sheet developments and the financial performance of UCBs. Section 3 assesses the overall performance of short-term and long-term rural co-operatives. The last section sets out overall perspectives on the co-operative institutions with a view to informing policy formulation. 2. Urban Co-operative Banks V.4 The Reserve Bank pursued an active licensing policy for UCBs during 1993-2004, which led to a sharp increase in their numbers. Subsequently, as signs of incipient financial fragilities in the sector became evident, the Reserve Bank enunciated appropriate regulatory and supervisory policies in its Vision Document (2005) involving inter alia merger/amalgamation of weak but viable UCBs and closure of unviable ones. As a result, the number of UCBs declined (Chart V.2). Maharashtra, which has the highest number of UCBs, accounted for the largest number of mergers, followed by Gujarat (Chart V.3). V.5 In spite of the number of UCBs coming down after consolidation, their asset size increased manifold, underscoring the policy focus on strengthening their financial position (Chart V.4). V.6 UCBs are classified into Tier I and Tier II categories, based on the depositor base3. Tier II category of UCBs have a larger deposit base (Table V.1). V.7 The consolidation drive has resulted in an increase in the share of Tier II UCBs in terms of both numbers and asset size (Chart V.5). 2.1 Balance sheet V.8 The consolidated balance sheet of UCBs has grown strongly during the decade after the consolidation drive as robust players with stronger balance sheets propelled balance sheet growth. Since 2013-14, however, there has been a slowdown in growth (Chart V.6). V.9 Asset concentration among UCBs has increased over the years. The distribution of UCBs was bi-modal, with peaks in the asset size between ₹0.25 to ₹0.5 billion bracket and in the ₹1 to ₹2.5 billion bracket in 2014-15. Since 2016-17, however, the distribution has become uni-modal i.e., in the ₹1 to ₹2.5 billion buckets. Moreover, the distribution has shifted to the right, with the share of UCBs with an asset size of more than ₹10 billion increasing to 6.2 per cent in 2017-18 from 4.6 per cent in 2014-15 (Chart V.7). The Herfindahl-Hirschman Index (HHI) score of UCBs’ assets increased from 0.37 in 2015-16 to 0.41 in 2017-18, reflecting the growing concentration. | Table V.1: Tier-wise Distribution of Urban Co-operative Banks | | (At end-March 2018) | | (Amount in ₹ billion) | | Tier Type | Number of Banks | Deposits | Advances | Assets | | Number | % to Total | Amount | % to Total | Amount | % to Total | Amount | % to Total | | Tier I UCBs | 1,071 | 69.1 | 593 | 13.0 | 336 | 12.0 | 738 | 13.1 | | Tier II UCBs | 480 | 31.0 | 3,972 | 87.0 | 2,469 | 88.0 | 4,894 | 86.9 | | All UCBs | 1,551 | 100.0 | 4,565 | 100.0 | 2,805 | 100.0 | 5,632 | 100.0 | Note: Data are provisional.
Source: Off-site surveillance returns, RBI. |
V.10 During 2017-18, the moderation in UCBs’ consolidated balance sheet was due to slowdown in growth of deposits—which account for 81 per cent of total liabilities—from the demonetisation-driven high base of the previous year. Deceleration in capital and reserves added to the subdued expansion in their combined balance sheet, although deceleration in deposits was partly offset by a higher reliance on borrowings (Table V.2). V.11 Consolidation has also catalysed shifts in the distribution of UCBs in terms of deposits over the decade ending 2017-18. The share of UCBs with a deposit base in the range of up to ₹0.25 billion has come down while it has increased in the range of ₹1 to ₹2.5 billion and above (Chart V.8). | Table V.2: Liabilities and Assets of Urban Co-operative Banks | | (At end-March) | | (Amount in ₹ billion) | | Assets/Liabilities | Scheduled UCBs | Non-scheduled UCBs | All UCBs | Rate of Growth (%) All UCBs | | 2017 | 2018 | 2017 | 2018 | 2017 | 2018 | 2016-17 | 2017-18 | | 1 | 2 | 3 | 4 | 5 | 6 | 7 | 8 | 9 | | Liabilities | | | | | | | | | | 1. Capital | 39 | 41 | 82 | 89 | 121 | 130 | 10.0 | 7.1 | | | (1.5) | (1.6) | (2.9) | (3.0) | (2.2) | (2.3) | | | | 2. Reserves | 158 | 167 | 177 | 186 | 335 | 353 | 13.2 | 5.5 | | | (6.2) | (6.3) | (6.2) | (6.2) | (6.2) | (6.3) | | | | 3. Deposits | 2,072 | 2,120 | 2,362 | 2,445 | 4,435 | 4,565 | 13.1 | 2.9 | | | (81.5) | (80.1) | (82.7) | (81.9) | (82.1) | (81.1) | | | | 4. Borrowings | 31 | 45 | 3 | 4 | 34 | 49 | 31.6 | 41.6 | | | (1.2) | (1.7) | (0.1) | (0.1) | (0.6) | (0.9) | | | | 5. Other Liabilities | 243 | 273 | 232 | 262 | 474 | 535 | 8.6 | 12.8 | | | (9.5) | (10.3) | (8.1) | (8.8) | (8.8) | (9.5) | | | | Assets | | | | | | | | | | 1. Cash in Hand | 15 | 15 | 30 | 40 | 45 | 55 | 6.1 | 21.7 | | | (0.6) | (0.6) | (1.0) | (1.3) | (0.8) | (1.0) | | | | 2. Balances with RBI | 99 | 103 | 15 | 21 | 115 | 125 | 12.9 | 8.9 | | | (3.9) | (3.9) | (0.5) | (0.7) | (2.1) | (2.2) | | | | 3. Balances with Banks | 177 | 161 | 431 | 468 | 607 | 629 | 8.5 | 3.6 | | | (6.9) | (6.1) | (15.1) | (15.7) | (11.2) | (11.2) | | | | 4. Money at Call and Short Notice | 39 | 31 | 11 | 14 | 50 | 45 | 55.1 | -11.0 | | | (1.5) | (1.2) | (0.4) | (0.5) | (0.9) | (0.8) | | | | 5. Investments | 662 | 689 | 759 | 809 | 1,421 | 1,498 | 17.5 | 5.4 | | | (26.0) | (26.0) | (26.6) | (27.1) | (26.3) | (26.6) | | | | 6. Loans and Advances | 1,292 | 1,369 | 1,320 | 1,436 | 2,612 | 2,805 | 6.6 | 7.4 | | | (50.8) | (51.7) | (46.2) | (48.1) | (48.4) | (49.8) | | | | 7. Other Assets | 259 | 279 | 290 | 196 | 549 | 476 | 39.5 | -13.3 | | | (10.2) | (10.6) | (10.2) | (6.6) | (10.2) | (8.5) | | | | Total Liabilities/ Assets | 2,543 | 2,647 | 2,856 | 2,985 | 5,399 | 5,632 | 12.8 | 4.3 | | | (100) | (100) | (100) | (100) | (100) | (100) | | | Notes:
1. Data for 2018 are provisional.
2. Figures in parentheses are proportion to total liabilities / assets (in per cent).
3. Components may not add up to their respective total due to rounding-off.
4. Y-o-Y variation could be slightly different because absolute numbers have been rounded-off to ₹1 billion in the table.
Source: Off-site surveillance returns, RBI. | 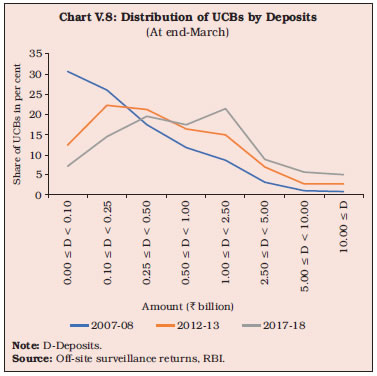 V.12 UCBs with deposits in the range of ₹1 billion to ₹2.5 billion turned out to be the modal class during 2017-18 (Table V.3). V.13 On the assets side, there was a deceleration in investments and in money at call and short notice, which was partly offset by an increase in loans and advances. V.14 A moderation in investment in central government securities, which account for around 67 per cent of total investment, drove the deceleration in total investments (Table V.4). V.15 The credit-deposit (CD) ratio of UCBs, which ranged from 60 to 67 per cent during 2009-10 to 2015-16, declined to 58.9 per cent during 2016-17 due to the demonetisation-induced bulge in deposit growth. With normalisation in deposit growth and credit growth occurring through 2017-18, the CD ratio picked up again to pre-demonetisation levels (Chart V.9a). | Table V.3: Distribution of UCBs by Deposits and Advances | | (At end-March 2018) | | Deposits (₹ billion) | Number of UCBs | Amount of Deposits | Advances (₹ billion) | Number of UCBs | Amount of Advances | | Number | % Share | Amount | % Share | Number | % Share | Amount | % Share | | 1 | 2 | 3 | 4 | 5 | 6 | 7 | 8 | 9 | 10 | | 0.00 - 0.10 | 111 | 7.2 | 7 | 0.1 | 0.00 - 0.10 | 258 | 16.6 | 14 | 0.5 | | 0.10 - 0.25 | 226 | 14.6 | 38 | 0.8 | 0.10 - 0.25 | 345 | 22.2 | 57 | 2.0 | | 0.25 - 0.50 | 304 | 19.6 | 110 | 2.4 | 0.25 - 0.50 | 289 | 18.6 | 100 | 3.6 | | 0.50 - 1.00 | 272 | 17.5 | 191 | 4.2 | 0.50 - 1.00 | 238 | 15.3 | 167 | 6.0 | | 1.00 - 2.50 | 332 | 21.4 | 516 | 11.3 | 1.00 - 2.50 | 224 | 14.4 | 340 | 12.1 | | 2.50 - 5.00 | 138 | 8.9 | 482 | 10.6 | 2.50 - 5.00 | 99 | 6.4 | 343 | 12.2 | | 5.00 - 10.00 | 88 | 5.7 | 590 | 12.9 | 5.00 - 10.00 | 55 | 3.5 | 373 | 13.3 | | 10.00 and above | 80 | 5.2 | 2,630 | 57.6 | 10.00 and above | 43 | 2.8 | 1,410 | 50.3 | | Total | 1,551 | 100.0 | 4,565 | 100.0 | Total | 1,551 | 100.0 | 2,805 | 100.0 | Notes: 1. Data are provisional.
2. Components may not add up to the total due to rounding-off.
Source: Off-site surveillance returns, RBI. | V.16 UCBs’ investment to deposit ratio is typically higher than that of SCBs. Since 2015-16, however, this ratio has fallen below that of SCBs as their deposits with StCBs and DCCBs ceased to be reckoned under SLR investments (Chart V.9b). V.17 Keeping in view the fast changes in the banking space and to spur growth, recent initiatives by the Reserve Bank to facilitate conversion of eligible UCBs into small finance banks (SFBs) assume importance (Box V.1). | Table V.4: Investments by Urban Co-operative Banks | | (Amount in ₹ billion) | | Item | At end-March | Variation (%) | | 2016 | 2017 | 2018 | 2016-2017 | 2017-2018 | | 1 | 2 | 3 | 4 | 5 | 6 | | Total Investments (a + B) | 1,209 | 1,421 | 1,498 | 17.5 | 5.4 | | | (100.0) | (100.0) | (100.0) | | | | A. SLR Investments (i to iii) | 1,096 | 1,254 | 1,361 | 14.4 | 8.6 | | | (90.7) | (88.2) | (90.9) | | | | (i) Central Govt. Securities | 878 | 955 | 999 | 8.7 | 4.7 | | | (72.6) | (67.2) | (66.7) | | | | (ii) State Govt. Securities | 215 | 294 | 361 | 36.8 | 22.9 | | | (17.8) | (20.7) | (24.1) | | | | (iii) Other approved Securities | 3 | 6 | 1 | 62.1 | -79.8 | | | (0.3) | (0.4) | (0.1) | | | | B. Non-SLR Investments | 113 | 167 | 137 | 48.2 | -18.3 | | | (9.3) | (11.8) | (9.1) | | | Notes: 1. Data for 2018 are provisional.
2. Figures in parentheses are share in respective type of investments.
3. Components may not add up to the total due to rounding off.
4. Y-o-Y variation could be slightly different because absolute numbers have been rounded off to ₹1 billion.
Source: Off-site surveillance returns, RBI. | 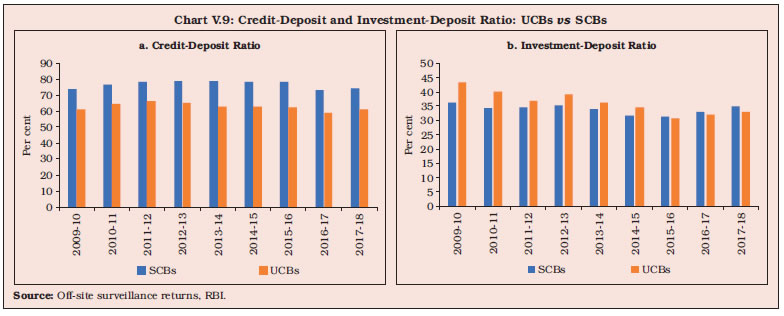
Box V.1: Voluntary Transition of UCBs into SFBs: The Path Ahead On September 27, 2018 the Reserve Bank announced a scheme for voluntary transition of eligible UCBs into small finance banks (SFBs) in line with the recommendations of the high-powered committee (Chairman: Shri R Gandhi). This would enable them to roll out most of the products which are currently permissible to commercial banks and help them in getting a pan-India presence. UCBs with a minimum net worth of ₹0.5 billion and a CRAR of 9 per cent and above are eligible for the voluntary transition. Upon commencement of business, the converted entity must have a minimum net worth of ₹1 billion, and the promoters should hold at least 26 per cent of the paid-up equity capital. They also need to maintain a CRAR of 15 per cent on a continuous basis. Additionally, they are required to comply with all SFB guidelines such as ensuring that 75 per cent of adjusted net bank credit (ANBC) goes towards priority sector lending (PSL) and 50 per cent of the loan portfolio constitutes loans up to ₹2.5 million. At end-March 2018, scheduled UCBs (SUCBs) were comparable with SFBs in terms of net worth and gross loans and advances (Chart 1). In terms of the regulatory regime, both SFBs and UCBs comply with the same CRR and SLR norms as SCBs; however, while UCBs are subjected to Basel I norms, SFBs and UCBs transiting into SFBs need to be Basel III compliant, maintaining a liquidity coverage ratio and a net stable funding ratio in line with SCBs. Amongst the 54 SUCBs, 45 already have a net worth of ₹1 billion or more. Besides, 50 SUCBs and 1,450 non-scheduled UCBs (NSUCBs) (out of a total of 1497 NSUCBs) have a CRAR of more than 9 per cent.
| Table 1: Range of loans granted by UCBs | | Range of Loan | SUCBs | NSUCBs | | Amount as a per cent of total | Amount as per cent of total | | Up to ₹5 lakhs | 10.75 | 47.46 | | ₹5-10 lakhs | 6.21 | 12.05 | | ₹10-15 lakhs | 3.76 | 5.60 | | ₹15-20 lakhs | 3.04 | 3.84 | | ₹20-25 lakhs | 2.46 | 3.36 | | ₹25-50 lakhs | 6.90 | 7.90 | | ₹50 lakhs -1 crore | 7.28 | 6.55 | | ₹1-5 crores | 23.43 | 10.70 | | Above ₹5 crores | 36.17 | 2.54 | Note: Data compiled as at end-March 2015.
Source: Report of High Powered Committee on UCBs (Chairman: Shri. R. Gandhi). | At end-March 2018, PSL lending by all UCBs was 46.6 per cent of their gross advances (Chart 2). Given that the set of categories qualifying for PSL lending for UCBs has been enlarged with effect from May 10, 2018, achievement of the target of 75 per cent may not be an arduous task for them. However, SUCBs intending to transit themselves into SFBs may have to modify their current business models to satisfy the criterion of extending 50 per cent of total advances as small loans – at end-March 2015, approximately 67 per cent of loans by SUCBS were of the size of more than 50 lakhs. In contrast, the lending structure of NSUCBs is focussed on small value loans and they may not face a challenge in this regard (Table 1). Reference Reserve Bank of India (2015): ‘Report of the High-Powered Committee on Urban Co-operative Banks’, June. Available on https://rbidocs.rbi.org.in/rdocs/PublicationReport/Pdfs/HPC3934E91FA21241B8B0ABC4C4DBF28A40.PDF, accessed on October 19, 2018. | 2.2 Soundness V.18 The financial robustness of UCBs is assessed through CAMELS4 (capital adequacy; asset quality; management; earnings; liquidity; and systems and control) ratings. At end-March 2018, UCBs with ratings A and B, which indicate robust financial performance, accounted for 78 per cent of the total (Table V.5). | Table V.5: Rating-wise Distribution of UCBs | | (At end-March 2018) | | (Amount in ₹ billion) | | Ratings | Number | Deposits | Advances | | Banks | % share in Total | Amount | % share in Total | Amount | % share in Total | | 1 | 2 | 3 | 4 | 5 | 6 | 7 | | A | 328 | 21.2 | 1,415 | 31.0 | 893 | 31.8 | | B | 878 | 56.6 | 2,520 | 55.2 | 1,562 | 55.7 | | C | 278 | 17.9 | 518 | 11.4 | 303 | 10.8 | | D | 67 | 4.3 | 111 | 2.4 | 47 | 1.7 | | Total | 1,551 | 100.0 | 4,565 | 100.0 | 2,805 | 100.0 | Notes: 1. Data are provisional.
2. Components may not add up to the total due to rounding off.
3. Ratings are based on the inspection conducted during the financial years 2016-17 and 2017-18.
4. Percentage variation could be slightly different because absolute numbers have been rounded off to ₹ billion.
Source: Off-site surveillance returns, RBI. | V.19 The share of UCBs with rating B has increased steadily since 2014-15 and the share of UCBs with the lowest rating of D has declined over the years. However, there was a marginal increase in the share of UCBs with rating D in 2017-18 (Chart V.10). 2.3 Capital Adequacy V.20 UCBs are required to maintain minimum capital to risk-weighted assets ratio (CRAR) at par with the SCBs at 9 per cent. During 2017- 18, 97 per cent of non-scheduled urban cooperative banks (NSUCBs) had CRAR of 9 per cent and above while 93 per cent of scheduled urban co-operative banks (SUCBs) had achieved the minimum ratio (Table V.6). V.21 While the capital position of SUCBs improved in 2017-18, that of NSUCBs remained broadly stable (Chart V.11). Latest supervisory data indicate that the comfortable CRAR position of SUCBs continued in first half of 2018-19 as well. However, at end-September 2018, there were four SUCBs with negative CRAR. 2.4 Asset Quality V.22 Historically, UCBs have had higher level of NPAs than SCBs. Since 2015-16, however, the position has reversed, with NPAs of SCBs increasing sharply after the asset quality review (Chart V.12). Notwithstanding these developments, UCBs’ NPA ratio has deteriorated during 2014-15 to 2016-17, although a marginal improvement set in during 2017-18. V.23 During 2017-18, the provisioning coverage ratio of UCBs was also higher than SCBs (Table V.7). The deceleration in provisions matched the slowdown in NPAs (Chart V.13). | Table V.6: CRAR-wise Distribution of UCBs | | (At end-March 2018) | | CRAR (in Per cent) | Scheduled UCBs | Non-scheduled UCBs | All UCBs | | 1 | 2 | 3 | 4 | | CRAR < 3 | 3 | 25 | 28 | | 3 <= CRAR < 6 | 0 | 8 | 8 | | 6 <= CRAR < 9 | 1 | 14 | 15 | | 9 <= CRAR < 12 | 4 | 148 | 152 | | 12 <= CRAR | 46 | 1,302 | 1,348 | | Total | 54 | 1,497 | 1,551 | Note: Data are provisional.
Source: Off-site surveillance returns, RBI. |
2.5 Financial Performance and Profitability V.24 UCBs’ net profits moderated in 2017-18 on account of slowdown in interest income and decline in non-interest income from a high base. Although loans and advances expanded during the year, subdued growth in interest income may be reflective of the easing of interest rates during the period. Total expenditure remained muted due to reduction in interest expenditure, which was pronounced for SUCBs and resulted in an increase in net interest income for both SUCBs and NSUCBs (Table V.8).
| Table V.7: Non-performing Assets of UCBs | | Item | All UCBs | | End-March 2017 | End-March 2018 | | 1 | 2 | 3 | | 1. Gross NPAs (₹ billion) | 187 | 199 | | 2. Gross NPA Ratio (%) | 7.2 | 7.1 | | 3. Net NPAs (₹ billion) | 68 | 72 | | 4. Net NPA Ratio (%) | 2.7 | 2.7 | | 5. Provisioning (₹ billion) | 119 | 127 | | 6. Provisioning Coverage Ratio (%) | 63.7 | 63.7 | Note: Data for 2018 are provisional.
Source: Off-site surveillance returns, RBI. |
V.25 The return on assets (RoA) and return on equity (RoE) of UCBs decelerated in 2017-18 (Table V.9). | Table V.8: Financial Performance of Scheduled and Non-scheduled Urban Co-operative Banks | | (Amount in ₹ billion) | | Item | Scheduled UCBs | Non-scheduled UCBs | All UCBs | All UCBs Variation (%) | | 2016-17 | 2017-18 | 2016-17 | 2017-18 | 2016-17 | 2017-18 | 2016-17 | 2017-18 | | 1 | 2 | 3 | 4 | 5 | 6 | 7 | 8 | 9 | | A. Total Income [i+ii] | 231 | 232 | 294 | 302 | 526 | 534 | 9.8 | 1.5 | | | (100.0) | (100.0) | (100.0) | (100.0) | (100.0) | (100.0) | | | | i. Interest Income | 202 | 202 | 273 | 283 | 475 | 485 | 6.9 | 2.1 | | | (87.3) | (87.1) | (92.8) | (93.8) | (90.4) | (90.9) | | | | ii. Non-interest Income | 29 | 30 | 21 | 19 | 51 | 49 | 48.6 | -4.1 | | | (12.7) | (12.9) | (7.2) | (6.2) | (9.6) | (9.1) | | | | B. Total Expenditure [i+ii] | 194 | 194 | 253 | 256 | 447 | 450 | 8.6 | 0.7 | | | (100.0) | (100.0) | (100.0) | (100.0) | (100.0) | (100.0) | | | | i. Interest Expenditure | 143 | 136 | 190 | 188 | 333 | 324 | 7.8 | -2.6 | | | (73.8) | (70.1) | (75.0) | (73.5) | (74.5) | (72.0) | | | | ii. Non-interest Expenditure | 51 | 58 | 63 | 68 | 114 | 126 | 9.9 | 10.4 | | | (26.2) | (29.9) | (25.0) | (26.5) | (25.5) | (28.0) | | | | of which : Staff Expenses | 24 | 25 | 34 | 36 | 58 | 61 | 9.9 | 4.7 | | C. Profits | | | | | | | | | | i. Amount of Operating Profits | 37 | 38 | 42 | 46 | 78 | 83 | 17.0 | 6.3 | | ii. Provision, Contingencies | 14 | 16 | 11 | 12 | 25 | 27 | 49.5 | 8.6 | | iii. Provision for taxes | 7 | 8 | 7 | 8 | 14 | 15 | 3.7 | 10.0 | | iv. Amount of Net Profit before Taxes | 23 | 22 | 31 | 34 | 53 | 56 | 6.0 | 5.2 | | v. Amount of Net Profit after Taxes | 16 | 14 | 24 | 26 | 39 | 41 | 6.8 | 3.5 | Notes: 1. Data for 2017-18 are provisional.
2. Components may not add up to the total due to rounding off.
3. Percentage variation could be slightly different because absolute numbers have been rounded off to ₹ billion.
4. Figures in parentheses are share in total income/expenditure.
Source: Off-site surveillance returns, RBI. |
| Table V.9: Select Financial Indicators of UCBs | | (Per cent) | | Indicators | Scheduled UCBs | Non-scheduled UCBs | All UCBs | | 2016-17 | 2017-18 | 2016-17 | 2017-18 | 2016-17 | 2017-18 | | 1 | 2 | 3 | 4 | 5 | 6 | 7 | | Return on Assets | 0.65 | 0.55 | 0.88 | 0.90 | 0.77 | 0.74 | | Return on Equity | 8.34 | 7.03 | 9.70 | 9.88 | 9.11 | 8.65 | | Net Interest Margin | 2.43 | 2.54 | 3.11 | 3.25 | 2.79 | 2.92 | Note: Data for 2017-18 are provisional.
Source: Off-site surveillance returns, RBI. | V.26 At the disaggregated level, RoA and RoE for NSUCBs improved further and were higher than those of SUCBs as at end-March 2018 (Chart V.14). Latest data based on Reserve Bank’s supervisory returns indicate that RoA of SUCBs, which had moderated in 2017-18, has revived in the first half of 2018-19 to 0.72 per cent. 2.6 Priority Sector Advances V.27 UCBs are required to meet a priority sector lending target of 40 per cent of adjusted net bank credit (ANBC) or credit equivalent amount of off-balance sheet exposures, whichever is higher. Within this overall target, a sub-target of 10 per cent of advances to weaker sections is mandated. UCBs are not mandatorily required to lend to agriculture under priority sector lending, given their urban focus. Consequently, their share in agricultural lending is small. The Reserve Bank takes into consideration the achievement of priority sector targets by UCBs for granting regulatory clearances as well as classification of UCBs as Financially Sound and Well Managed (FSWM) with effect from April 1, 2018. 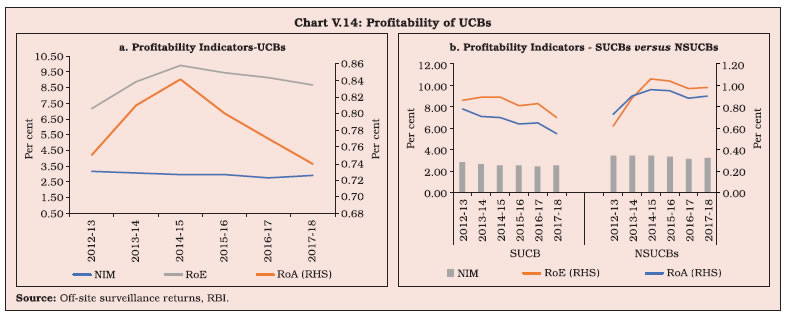 V.28 During 2017-18, the share of priority sector advances in total advances by UCBs increased after recording a dip in 2016-17. Within the priority sector advances, the share of micro and small enterprises was the highest, followed by housing loans (Table V.10). UCBs have usually exceeded their priority sector targets. In 2017-18, the share of priority sector lending constituted 46.6 per cent of UCBs’ total advances. V.29 Advances to weaker sections, which constituted more than a quarter of UCBs’ priority sector lending till 2015-16, moderated in the next two years. Credit to weaker sections by UCBs, recorded an up-tick in 2017-18 after a drop in the year ago, and remained around the target of 10 per cent of their ANBC (Chart V.15). | Table V.10: Composition of Credit to Priority Sectors by UCBs | | (Amount in ₹ billion) | | Item | 2016-17 | 2017-18 | | Amount | Share in Total Advances (%) | Amount | Share in Total Advances (%) | | 1. Agriculture [(i)+(ii)] | 76 | 3.0 | 94 | 3.4 | | (i) Agriculture (Direct Finance) | 32 | 1.2 | 41 | 1.5 | | (ii) Agriculture (Indirect Finance) | 44 | 1.7 | 53 | 1.9 | | 2. Micro and Small Enterprises [(i) + (ii)] | 732 | 28.0 | 812 | 29.0 | | (i) Direct Credit to Micro and Small Enterprises | 576 | 22.1 | 641 | 22.9 | | (ii) Indirect Credit to Micro and Small Enterprises | 156 | 6.0 | 171 | 6.1 | | 3. Micro Credit | 108 | 4.1 | 111 | 4.0 | | 4. State Sponsored Organisations for SCs / STs | 2 | 0.1 | 2 | 0.1 | | 5. Education Loans | 22 | 0.8 | 24 | 0.9 | | 6. Housing Loans | 253 | 9.7 | 265 | 9.4 | | 7. Total (1 to 6) | 1192 | 45.6 | 1,308 | 46.6 | | of which, Advances to Weaker Section | 271 | 10.4 | 312 | 11.1 | Notes: 1. Data for 2018 are provisional.
2. Components may not add up to the total due to rounding off.
Source: Off-site surveillance returns, RBI. | 3. Rural Co-operatives V.30 Rural co-operatives, which were established to address the ‘last mile’ problem associated with delivery of affordable credit to farmers, can be broadly classified into short-term and long-term institutions, each with distinct mandates. The focus of short-term co-operatives, viz., state co-operative banks (StCBs), district central co-operative banks (DCCBs) and primary agricultural credit societies (PACS) has been primarily on providing crop loans and working capital loans to farmers and rural artisans. With refinance support from the NABARD, they have diversified into medium-term loans for investments in agriculture and the rural sector, more generally. Long-term co-operatives such as state co-operative agriculture and rural development banks (SCARDBs) and primary co-operative agriculture and rural development banks (PCARDBs) dispense medium and long-term loans for a range of activities, including land development, farm mechanisation, minor irrigation, rural industries and lately, housing. Short-term credit co-operatives account for 94.3 per cent of the total assets of rural co-operatives, while the share of long term co-operatives has diminished over the years (Chart V.16). 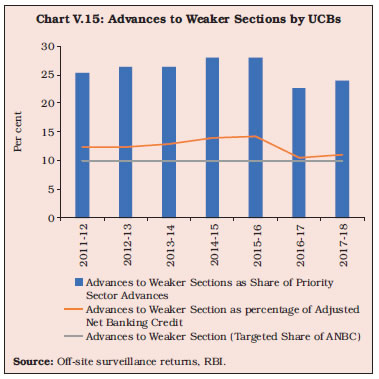 V.31 Rural co-operatives’ credit to agriculture had decelerated sharply in 2015-16 under drought conditions. A normal monsoon in 2016-17 spurred a revival which more than offset the contraction in lending by these institutions to other activities (Chart V.17).
V.32 Among rural co-operatives, StCBs play a dominant role, with 33 StCBs accounting for 23 per cent of assets, in contrast to PACS numbering 95,595 and holding the same share in total assets (Table V.11). | Table V.11: A Profile of Rural Co-operatives | | (At end-March 2017) | | (Amount in ₹ billion) | | Item | Short-term | Long-term | | StCBs | DCCBs | PACS | SCARDBs | PCARDBs | | 1 | 2 | 3 | 4 | 5 | 6 | | A. Number of Co-operatives | 33 | 370 | 95,595 | 13 | 601 | | B. Balance Sheet Indicators | | | | | | | i. Owned Funds (Capital + Reserves) | 154 | 384 | 330 | 43 | 27 | | ii. Deposits | 1,220 | 3,309 | 1,159 | 24 | 13 | | iii. Borrowings | 809 | 914 | 1,248 | 155 | 155 | | iv. Loans and Advances | 1,270 | 2,527 | 2,009 | 212 | 151 | | v. Total Liabilities/Assets | 2,329 | 5,055 | 2,400* | 304 | 291 | | C. Financial Performance | | | | | | | i. Institutions in Profits | | | | | | | a. No. | 31 | 315 | 46,586 | 8 | 236 | | b. Amount of Profit | 10 | 17 | 64.7 | 0.7 | 1.2 | | ii. Institutions in Loss | | | | | | | a. No. | 2 | 55 | 38,036 | 5 | 362 | | b. Amount of Loss | 0.2 | 8 | 32.1 | 2.52 | 6.5 | | iii. Overall Profits (+)/Loss (-) | 9.8 | 9 | 33.6 | -1.83 | -5.7 | | D. Non-performing Assets | | | | | | | i. Amount | 52 | 265 | 533 | 52 | 49 | | ii. As percentage of Loans Outstanding | 4.1 | 10.5 | 26.6 | 23.6 | 33 | | E. Recovery of Loans to Demand Ratio** (Per cent) | 93.5 | 78.9 | 73.4 | 50.8 | 44.3 | Notes: StCBs: State Co-operative Banks; DCCBs: District Central Co-operative Banks; PACS: Primary Agricultural Credit Societies;
SCARDBs: State Co-operative Agriculture and Rural Development Banks; PCARDBs: Primary Co-operative Agriculture and Rural Development Banks.
*: Working Capital.
**: This ratio captures the share of outstanding non-performing loan amounts that have been recovered.
Source: NABARD and NAFSCOB5. | V.33 The overall financial performance of short-term rural co-operatives has improved over the years because of various measures taken by the Reserve Bank and the NABARD. On the other hand, long-term co-operatives have struggled with persisting erosion of asset quality and profitability. 3.1 Short-term Rural Credit Co-operatives V.34 The short-term rural co-operative space, consists of a three-tier structure, with StCBs as the apex institution in each state, DCCBs operating at the district level and PACS at the base (village) level. In nine states and four union territories, however, short-term credit cooperatives operate through a two-tier structure consisting of StCBs at the apex level and PACS at the field level. StCBs mobilise deposits and provide liquidity support to DCCBs and PACS. As on March 31, 2017 the resource composition of short-term co-operatives revealed a reliance of StCBs and DCCBs on deposits among sources of funding (Chart V.18). The mandate of the PACS, on the other hand, is raising deposits and providing crop loans and working capital to member farmers. When the demand for loans exceeds the supply of deposits by members, these institutions resort to borrowing which constituted 42 per cent of total borrowings by all short-term rural co-operatives taken together at end-March 2017. In 2016-17, the overall financial performance of StCBs improved in terms of asset quality and profitability, whereas there was a deterioration in the performance of DCCBs. 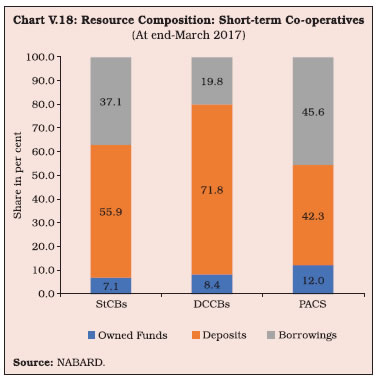 3.1.1 State Co-operative Banks V.35 StCBs are the apex institutions in the short-term rural credit structure with the primary mandate of meeting the financial requirements of DCCBs and PACS associated with them. In addition to mobilisation of deposits, they obtain liquidity and refinance support from institutions such as the NABARD for providing liquidity and technical assistance to the lower tier institutions like PACS as mentioned earlier. Balance Sheet Operations V.36 The consolidated balance sheet of StCBs has generally been propelled by asset side expansion in the form of loans and advances, while shortfalls in deposits relative to credit demand are covered by borrowings on the liabilities side, as alluded to earlier. In 2016-17, their balance sheets underwent sizeable expansion in the form of investments backed by robust accretions to deposits, reversing the dampened balance sheet growth in the preceding year (Chart V.19). V.37 The sharp acceleration in StCBs’ deposits in 2016-17—a seven-year high—was largely due to demonetisation as amongst the rural co-operative banks, only StCBs, were allowed to accept demonetised notes. The balance sheet expansion in 2016-17 was partly offset by contraction in capital6. Higher borrowings of StCBs was due to an additional line of credit provided by the NABARD under its Short-term Seasonal Agricultural Operation (ST-SAO) scheme and additional ₹20,000 crore allocated by Government of India to the NABARD under the ST-SAO scheme for on-lending to StCBs. V.38 Faced with the overhang of liquidity in 2016-17, StCBs preferred to deploy these funds in investments in low/nil yielding cash and bank balances in view of limited appetite for loans (Table V.12). V.39 Updated information on StCBs available from Section 42(2) returns suggests that a revival of credit growth took hold in 2017-18. Moreover, investments in SLR instruments increased significantly in comparison to previous years (Table V.13). | Table V.12: Liabilities and Assets of State Co-operative Banks | | (Amount in ₹ billion) | | Item | At end-March | Percentage Variation | | 2016 | 2017 | 2015-16 | 2016-17 | | 1 | 2 | 3 | 4 | 5 | | Liabilities | | | | | | 1. Capital | 56 | 52 | 5.0 | -7.1 | | | (2.7) | (2.2) | | | | 2. Reserves | 94 | 103 | 7.1 | 9.6 | | | (4.6) | (4.4) | | | | 3. Deposits | 1,093 | 1,220 | 6.3 | 11.6 | | | (52.9) | (52.4) | | | | 4. Borrowings | 688 | 809 | 0.1 | 17.6 | | | (33.3) | (34.7) | | | | 5. Other Liabilities | 136 | 145 | 3.5 | 6.6 | | | (6.6) | (6.2) | | | | Assets | | | | | | 1. Cash and Bank Balances | 64 | 97 | -3.8 | 51.6 | | | (3.1) | (4.2) | | | | 2. Investments | 690 | 846 | -1.2 | 22.6 | | | (33.4) | (36.3) | | | | 3. Loans and Advances | 1,229 | 1,270 | 7.3 | 3.4 | | | (59.4) | (54.6) | | | | 4. Other Assets | 85 | 116 | 8.5 | 36.2 | | | (4.1) | (5.0) | | | | Total Liabilities/Assets | 2,067 | 2,329 | 4.0 | 12.7 | | | (100.0) | (100.0) | | | Notes: 1. Figures in parentheses are proportion to total liabilities/assets (in per cent).
2. Y-o-Y variations could be slightly different because absolute numbers have been rounded off to ₹1 billion.
3. Components may not add up to the total due to rounding off.
Source: NABARD. |
| Table V.13: Trends in Select Balance Sheet Indicators of Scheduled State Co-operative Banks | | (Amount in ₹ billion) | | Item | 2013-14 | 2014-15 | 2015-16 | 2016-17 | 2017-18 | | 1 | 2 | 3 | 4 | 5 | 6 | | Deposits | 777 | 772 | 796 | 903 | 988 | | | (8.7) | (-0.6) | (3.0) | (13.5) | (9.4) | | Credit | 939 | 1,038 | 1,074 | 1,109 | 1,180 | | | (10.0) | (10.6) | (3.4) | (3.3) | (6.4) | | SLR Investments | 240 | 233 | 242 | 262 | 334 | | | (7.0) | (-3.1) | (4.0) | (8.3) | (27.4) | | Credit plus SLR Investments | 1,179 | 1,271 | 1,316 | 1,372 | 1,514 | | | (9.4) | (7.8) | (3.5) | (4.2) | (10.4) | Note: Figures in brackets are growth rates in per cent over previous year.
Source: Form B under Section 42 of RBI Act. | Profitability V.40 Net profits of StCBs registered a marked turn-around in 2016-17 due to contraction in expenditure as moderation in interest rates brought down interest expenditure. Also, reduction in NPAs and subdued credit growth necessitated lower provisions. On the other hand, operating profit of StCBs declined further in 2016-17 on top of the contraction in 2015-16, on account of the significant increase in operating expenses (Table V.14). This is indicative of lower operational efficiency of these institutions. Asset Quality V.41 The asset quality of StCBs has improved consistently over the years – even relative to UCBs and SCBs – due to measures taken by the Reserve Bank and the NABARD, including the linking of the availment of refinance to their performance parameters like the NPA ratio and CRAR (Chart V.20). V.42 This sustained improvement in asset quality of StCBs was marked by lower accretions to NPAs in 2016-17. Both sub-standard assets and doubtful assets declined, while the recovery-to-demand ratio improved (Table V.15). | Table V.14: Financial Performance of State Co-operative Banks | | (Amount in ₹ billion) | | Item | As during | Variation (%) | | 2015-16 | 2016-17 | 2015-16 | 2016-17 | | 1 | 2 | 3 | 4 | 5 | | A. Income (i+ii) | 153 | 152 | 2.6 | -0.7 | | | (100.0) | (100.0) | | | | i. Interest Income | 145 | 149 | 1.6 | 2.6 | | | (95.9) | (97.8) | | | | ii. Other Income | 8 | 3 | 27 | -3.4 | | | (5.0) | (1.9) | | | | B. Expenditure (i+ii+iii) | 147 | 143 | 6.3 | -2.7 | | | (100.0) | (100.0) | | | | i. Interest Expended | 119 | 115 | 3 | -3.5 | | | (80.8) | (70.8) | | | | ii. Provisions and Contingencies | 12 | 9 | 61.8 | -33.3 | | | (8.0) | (7.9) | | | | iii. Operating Expenses | 16 | 19 | 4.8 | 15.8 | | | (11.2) | (21.2) | | | | Of which : Wage Bill | 11 | 11 | 11.6 | 0 | | | (7.3) | (13.6) | | | | C. Profitability | | | | | | Operating Profits | 18 | 15 | -1.8 | -16.7 | | Net Profits | 6 | 10 | -44.5 | 66.7 | Notes: 1. Figures in parentheses are proportion to total income/expenditure (in per cent).
2. Y-o-Y variations could be slightly different because absolute numbers have been rounded off to ₹1 billion in the table.
3. Components may not add up to the total due to rounding off.
Source: NABARD. | V.43 Despite significant variation in the NPA ratio across regions, there has been improvement spatially and temporally, except in the central region (Chart V.21a). The northern region had the lowest NPA ratio and highest recovery-to-demand ratio, whereas the north eastern region had high levels of NPAs and a low recovery ratio (Chart V.21b).
| Table V.15: Soundness Indicators of State Co-operative Banks | | (Amount in ₹ billion) | | Item | At end-March | Variation (%) | | 2016 | 2017 | 2015-16 | 2016-17 | | 1 | 2 | 3 | 4 | 5 | | A. Total NPAs (i+ii+iii) | 56 | 52 | -2.8 | -7.1 | | i. Sub-standard | 19 | 16 | -9.1 | -15.8 | | | (33.9) | (30.8) | | | | ii. Doubtful | 25 | 24 | 0.9 | -4 | | | (44.9) | (46.2) | | | | iii. Loss | 12 | 12 | 0.6 | 0 | | | (21.2) | (23.1) | | | | B. NPAs to Loans Ratio (%) | 4.5 | 4.1 | - | - | | C. Recovery to Demand Ratio (%) | 91.7 | 93.5 | - | - | Notes: 1. Figures in parentheses are shares in total NPA (%).
2. Absolute numbers have been rounded off, leading to slight variations in per cent.
3. Components may not add-up to the total due to rounding off.
Source: NABARD. | 3.1.2 District Central Co-operative Banks V.44 DCCBs – the second tier of the short-term rural co-operative structure – use their deposits and borrowings from StCBs and the NABARD to provide loans to their members and for onward lending to PACS. In comparison with StCBs, the expansion in the combined balance sheet of DCCBs was moderate in 2016-17 (Chart V.22a). V.45 The credit-deposit ratio of StCBs has always been higher than that of DCCB, as the latter have a larger deposit base. The gap between the two reduced in 2016-17 on account of the surge in deposits with StCBs (Chart V.22b). Balance Sheet Operations V.46 The consolidated balance sheet of DCCBs decelerated in 2016-17. On the assets side, loans and advances, which along with investments account for more than 80 per cent of total assets, slowed down due to subdued credit demand. On the liabilities side, there was a moderation in the growth of capital, deposits and other liabilities. Deposits constitute more than 70 per cent of the resources of DCCBs and consequently, the deceleration in their growth impacted investments as well as loans and advances (Table V.16). Profitability V.47 The profitability of DCCBs in terms of both operating profits and net profits, declined in 2016-17. Although both income and expenditure slackened, the sharper slowdown in the former adversely affected bottom lines (Table V.17). 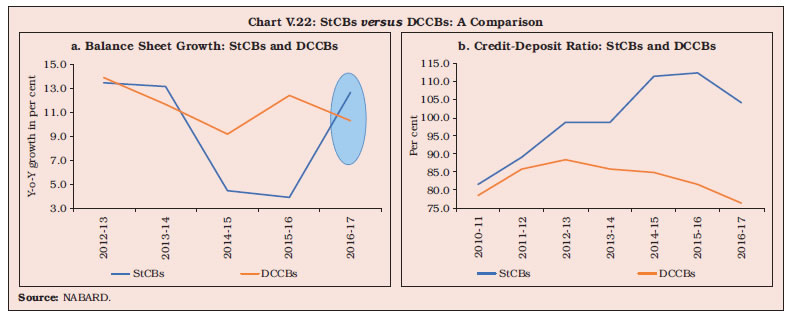
| Table V.16: Liabilities and Assets of District Central Co-operative Banks | | (Amount in ₹ billion) | | Item | At end-March | Variation (%) | | 2016 | 2017 | 2015-16 | 2016-17 | | 1 | 2 | 3 | 4 | 5 | | Liabilities | | | | | | 1. Capital | 165 | 187 | 25.6 | 13.3 | | | (3.6) | (3.7) | | | | 2. Reserves | 175 | 198 | 7.9 | 13.1 | | | (3.8) | (3.9) | | | | 3. Deposits | 2,982 | 3,309 | 15.2 | 11.0 | | | (65.1) | (65.5) | | | | 4. Borrowings | 836 | 914 | 4.5 | 9.3 | | | (18.2) | (18.1) | | | | 5. Other Liabilities | 424 | 447 | 7.3 | 5.4 | | | (9.3) | (8.8) | | | | Assets | | | | | | 1. Cash and Bank Balances | 233 | 329 | 5.7 | 41.2 | | | (5.1) | (6.5) | | | | 2. Investments | 1,615 | 1,691 | 16.7 | 4.7 | | | (35.3) | (33.5) | | | | 3. Loans and Advances | 2,427 | 2,527 | 10.6 | 4.1 | | | (53.0) | (50.0) | | | | 4. Other Assets | 307 | 508 | 10.5 | 65.5 | | | (6.7) | (10.0) | | | | Total Liabilities/Assets | 4,582 | 5,055 | 12.4 | 10.3 | | | (100.0) | (100.0) | | | Notes: 1. Figures in parentheses are proportion to total liabilities/assets (in per cent).
2. Y-o-Y variations could be slightly different because absolute numbers have been rounded off to ₹1 billion in the table.
3. Components may not add up to the total due to rounding off.
Source: NABARD. |
| Table V.17: Financial Performance of District Central Co-operative Banks | | (Amount in ₹ billion) | | Item | As during | Variation (%) | | 2015-16 | 2016-17 | 2015-16 | 2016-17 | | 1 | 2 | 3 | 4 | 5 | | A. Income (i+ii) | 367 | 385 | 8.4 | 4.9 | | | (100.0) | (100.0) | | | | i. Interest Income | 347 | 378 | 7.7 | 8.9 | | | (94.8) | (98.1) | | | | ii. Other Income | 19 | 7 | 23.2 | -63.2 | | | (5.2) | (1.9) | | | | B. Expenditure (i+ii+iii) | 355 | 376 | 7.3 | 5.9 | | | (100.0) | (100.0) | | | | i. Interest Expended | 250 | 268 | 8.8 | 7.2 | | | (70.4) | (71.4) | | | | ii. Provisions and Contingencies | 29 | 30 | -4 | 3.4 | | | (8.1) | (7.9) | | | | iii. Operating Expenses | 76 | 78 | 6.9 | 2.6 | | | (21.5) | (20.7) | | | | Of which : Wage Bill | 48 | 50 | 10.7 | 4.2 | | | (13.5) | (13.2) | | | | C. Profits | | | | | | i. Operating Profits | 40 | 33 | 8.4 | -17.5 | | ii. Net Profits | 11 | 9 | 62.5 | -18.2 | Notes: 1. Figures in parentheses are proportion to total liabilities/assets (in per cent).
2. Y-o-Y variations could be slightly different because absolute numbers have been rounded off to ₹ 1 billion in the table.
3. Components may not add up to the total due to rounding off.
Source: NABARD. | Asset Quality V.48 The asset quality of DCCBs deteriorated during 2016-17 as reflected in higher NPA ratios with increase in both sub-standard and loss categories. The deterioration could partly be attributable to several debt waiver schemes for farmers announced by state governments (Table V.18). V.49 DCCBs usually have higher NPAs and lower recovery-to-demand ratios than StCBs (Chart V.23). They also have a higher share of operating expenses in total expenses. During 2016-17, however, the share of operating expenses in total expenses of StCBs was marginally lower than DCCBs due to a significant increase in their operating expenses (Chart V.24). V.50 Similar to StCBs, there is considerable variation in the financial health of DCCBs across regions. In the northern and southern region, NPA ratios were lower and recovery-to-demand ratios were higher in 2016-17 whereas the central and western regions recorded high level of NPAs and low recovery ratios (Chart V.25). | Table V.18: Soundness Indicators of District Central Co-operative Banks | | (Amount in ₹ billion) | | Item | At end-March | Variation (%) | | 2016 | 2017 | 2015-16 | 2016-17 | | 1 | 2 | 3 | 4 | 5 | | A. Total NPAs (i+ii+iii) | 227 | 264 | 9 | 16.3 | | i. Sub-standard | 95 | 120 | 1.6 | 26.3 | | | (41.7) | (45.4) | | | | ii. Doubtful | 109 | 120 | 19.6 | 10.1 | | | (48.1) | (45.4) | | | | iii. Loss | 23 | 24 | -2.2 | 4.3 | | | (10.2) | (9.1) | | | | B. NPAs to Loans Ratio (%) | 9.3 | 10.5 | - | - | | C. Recovery to Demand Ratio (%) | 79.6 | 78.9 | - | - | Notes: 1. Figures in parentheses are proportion to total NPAs (in per cent).
2. Y-o-y variations could be slightly different because absolute numbers have been rounded off to ₹1 billion in the table.
3. Components may not add up to the total due to rounding off.
Source: NABARD. |
V.51 The asset quality of DCCBs has generally deteriorated across regions in recent years. Their NPA ratios continued to increase in 2016-17, albeit marginally, except in the eastern region (Chart V.26).
3.1.3 Primary Agricultural Credit Societies V.52 PACS are at the bottom of the three-tier rural co-operative structure, but they provide vital access to finance in the form of short-term and crop loans to their members in villages, viz., farmers and artisans. Over time, PACS have expanded their area of operations by providing capital for investment in agriculture/ allied activities. Besides, they also arrange other services like marketing of produce, storage and input supply. Balance Sheet Operations V.53 The loan portfolio of PACS continued to grow, albeit at a lower rate in 2016-17 than in the previous year mainly reflecting muted demand conditions prevailing in the economy (Chart V.27). V.54 In the past, PACS were highly dependent on borrowings from DCCBs and StCBs. Since 2011-12, however, the share of borrowings in their total resources has decreased gradually, while that of deposits has inched up, indicative of an expanding depositor base (Chart V.28). V.55 In 2016-17, both borrowings and deposits of PACS registered a slowdown. The total resources of PACS were, however, shored up by significant increase in owned funds due to a spurt in total reserves (Table V.19).
V.56 The share of agricultural loans in total loans of PACS has fluctuated in the range of 55 to 60 per cent since 2011 (Chart V.29). V.57 Since PACS extend loans to their members only, the borrower-to-member ratio is a useful indicator of financing conditions. This ratio has remained below 50 per cent, indicating that less than half of the members are able to access credit from these institutions. The borrower to member ratio increased to 39.6 per cent in 2016-17 from 36.3 per cent in 2015-16, with the improvement spanning all categories except rural artisans (Chart V.30). | Table V.19: Primary Agricultural Credit Societies | | (Amount in ₹ billion) | | Item | At end-March | Variation (%) | | 2016 | 2017 | 2015-16 | 2016-17 | | 1 | 2 | 3 | 4 | 5 | | A. Liabilities | | | | | | 1. Total Resources (2+3+4) | 2,382 | 2,737 | 15.5 | 15 | | 2. Owned Funds (a+b) | 244 | 330 | 12.8 | 34.9 | | a. Paid-up Capital | 123 | 141 | 11 | 15 | | Of which, | | | | | | Government Contribution | 8 | 8 | -4.3 | 3.9 | | b. Total Reserves | 122 | 189 | 14.7 | 55.1 | | 3. Deposits | 1,011 | 1,159 | 19.4 | 14.7 | | 4. Borrowings | 1,127 | 1,248 | 12.7 | 10.8 | | 5. Working Capital | 2,013 | 2,400 | -10 | 19.2 | | B. Assets | | | | | | 1. Total Loans Outstanding (a+b) | 1,585 | 1,705 | 7.7 | 7.6 | | a. Short-Term | 1,171 | 1,222 | 13 | 4.4 | | b. Medium-Term | 414 | 483 | -5.1 | 16.5 | Note: Y-o-Y variations could be slightly different because absolute numbers have been rounded off to ₹ billion.
Source: NAFSCOB. | V.58 Marginal and small farmers constitute 70 per cent of PACS members. During 2016-17, the share of marginal farmers and rural artisans increased whereas the share of small farmers declined. There was a marginal decline in the share of scheduled castes and scheduled tribes (Chart V.31).
V.59 The proportion of loss-making PACS has remained around 40 per cent over the last five years. On the other hand, there has been a steady increase in the share of profit-making PACS. At end-March 2017, loss-making PACS stood at 39.8 per cent of the total PACS (marginally higher from 39.7 per cent in March-2016) while those in profit accounted for 48.7 per cent (Chart V.32). V.60 The regional distribution of loss-making PACS shows that their numbers exceeded those of profit-making PACS in the eastern and north-eastern regions. In contrast, profit-making PACS outpaced loss-making ones in other regions (Chart V.33).
However, net profits in absolute terms were positive only in the southern region (Chart V.34). 3.2 Long-term Co-operatives V.61 Long-term credit co-operatives play an important role in enhancing agricultural productivity and rural development by providing long term finance for capital formation and rural development projects. Long-term rural co-operatives consist of state co-operative agriculture and rural development banks (SCARDBs) operating at the state level and primary co-operative agriculture and rural development banks (PCARDBs) operating at the district/block level. Unlike short-term credit co-operatives which have a uniform three-tier structure throughout the country, the structure of long term co-operative institutions varies across states. In Bihar, Uttar Pradesh, Jammu and Kashmir, Gujarat, Assam and Tripura, there are no PCARDBs, and SCARDBs operate directly through their branches at the district level. In most other states, SCARDBs operate through PCARDBs. A mixed structure exists in Himachal Pradesh and West Bengal, where SCARDBs operate through PCARDBs and also through their branches. In contrast, in north-eastern states, there is no separate structure of long-term co-operatives, except in Assam and Tripura. 3.2.1 State Co-operative Agriculture and Rural Development Banks V.62 SCARDBs purvey credit from the NABARD to PCARDBs or to farmers directly through their branches. These institutions are however, weak in terms of asset quality, profitability and capital adequacy as they continue to be afflicted by issues of a low resource base, restricted range of products and limited outreach. Balance Sheet Operations V.63 During 2016-17, the consolidated balance sheet of SCARDBs expanded after experiencing contraction in the previous year. On the liabilities side, deposits and capital remained broadly unchanged, while reserves declined with the deterioration in their overall financial health. On the assets side, all components experienced growth with significant increase in investments and loans and advances on a low base (Table V.20). Profitability V.64 SCARDBs reported net losses in 2016-17, as compared to net profits in the previous year, on account of a sharp increase in expenditure and a marginal fall in income. The increase in expenditure was due to higher interest expenses, provision and contingencies, the latter necessitated by a marked rise in delinquency. They were, however, able to contain operating expenses at the previous year’s level, thus posting operating profits (Table V.21). | Table V.20: Liabilities and Assets of State Co-operative Agriculture and Rural Development Banks | | (Amount in ₹ billion) | | Item | At end-March | Variation (%) | | 2016 | 2017 | 2015-16 | 2016-17 | | 1 | 2 | 3 | 4 | 5 | | Liabilities | | | | | | 1. Capital | 9 | 9 | -6.8 | 0.0 | | | (3.3) | (3.0) | | | | 2. Reserves | 41 | 34 | -37 | -7.1 | | | (14.9) | (11.2) | | | | 3. Deposits | 24 | 24 | 29.8 | 0.0 | | | (8.7) | (7.9) | | | | 4. Borrowings | 146 | 155 | -9.5 | 6.2 | | | (53) | (51) | | | | 5. Other Liabilities | 55 | 82 | -29.5 | 49.1 | | | (20.2) | (27.0) | | | | Assets | | | | | | 1. Cash and Bank Balances | 4 | 5 | 4 | 25 | | | (1.6) | (1.5) | | | | 2. Investments | 30 | 32 | -1.3 | 6.7 | | | (10.8) | (10.5) | | | | 3. Loans and Advances | 204 | 212 | -3.7 | 3.9 | | | (74.2) | (69.8) | | | | 4. Other Assets | 37 | 55 | -57.3 | 48.6 | | | (13.4) | (18.0) | | | | Total Liabilities/Assets | 275 | 304 | -17.3 | 10.5 | | | (100.0) | (100.0) | | | Notes: 1. Figures in parentheses are proportion to total liabilities/assets (in per cent).
2. Y-o-Y variations could be slightly different because absolute numbers. have been rounded off to ₹1 billion in the table.
3. Components may not add up to the total due to rounding off.
Source: NABARD. |
| Table V.21: Financial Performance of State Co-operative Agriculture and Rural Development Banks | | (Amount in ₹ billion) | | Item | As during | Percentage Variation | | 2015-16 | 2016-17 | 2015-16 | 2016-17 | | 1 | 2 | 3 | 4 | 5 | | A. Income (i+ii) | 22.0 | 21.9 | -12.1 | -0.1 | | | (100.0) | (100.0) | | | | i. Interest Income | 22.0 | 20.7 | -11.4 | -5.9 | | | (97.2) | (94.2) | | | | ii. Other Income | 0.6 | 1.3 | -30.8 | 113.3 | | | (2.8) | (5.8) | | | | B. Expenditure (i+ii+iii) | 22.0 | 24.0 | -23.9 | 9.1 | | | (100.0) | (100.0) | | | | i. Interest Expended | 14.0 | 15.0 | -21.6 | 7.1 | | | (63.9) | (62.5) | | | | ii. Provisions and Contingencies | 4.0 | 5.0 | -37.7 | 25.0 | | | (17.3) | (20.8) | | | | iii. Operating Expenses | 4.0 | 4.0 | -15.5 | 0.0 | | | (18.8) | (16.7) | | | | C. Profits | | | | | | i. Operating Profits | 4.0 | 6.0 | 71.1 | 50.0 | | ii. Net Profits | 0.03 | -2.0 | 100.8 | - | Notes: 1. Figures in parentheses are proportion to total income/ expenditure (in per cent).
2. Y-o-Y variations could be slightly different because absolute numbers have been rounded off to ₹1 billion in the table.
3. Components may not add up to the total due to rounding off.
Source: NABARD. | Asset Quality V.65 The asset quality of SCARDBs deteriorated in 2016-17, after improving consistently since 2012-13 (Chart V.35). V.66 Doubtful assets, which constituted the largest bucket under NPAs, doubled. The ageing of NPAs suggests that the malaise may be deep-rooted (Table V.22). Regional Performance V.67 The financial performance of SCARDBs in the central region deteriorated during 2016-17 as NPA ratios increased while the recovery ratio declined. SCARDBs in the southern region remain the strongest due to high recovery and low NPA ratios (Chart V.36).
| Table V.22: Asset Quality of State Co-operative Agriculture and Rural Development Banks | | (Amount in ₹ billion) | | Item | At end-March | Percentage Variation | | 2016 | 2017 | 2015-16 | 2016-17 | | 1 | 2 | 3 | 4 | 5 | | A. Total NPAs (i+ii+iii) | 34 | 50 | -47.3 | 47.1 | | i) Sub-standard | 19 | 20 | -22.2 | 5.3 | | | (56.4) | (40.0) | | | | ii) Doubtful | 15 | 30 | -62.5 | 100 | | | (43.4) | (60.0) | | | | iii) Loss | 0.1 | 0.01 | -86.7 | -90 | | | (0.2) | (0.02) | | | | B. NPAs to loans ratio (%) | 16.6 | 23.6 | - | - | | C. Recovery to Demand Ratio (%) | 63.6 | 50.8 | - | - | Notes: 1. Figures in parentheses are proportions to total NPAs.
2. Y-o-Y variations could be slightly different because absolute numbers have been rounded off to ₹1 billion.
3. Components may not add up to the total due to rounding off.
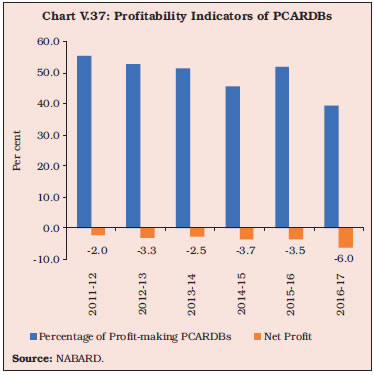
Source: NABARD. | 3.2.2 Primary Co-operative Agriculture and Rural Development Banks V.68 PCARDBs represent the lowest tier of the long-term co-operative credit structure. The mandate of the PCARDBs is to provide loans to farmers, artisans, craftsmen and other qualified persons. PCARDBs, like SCARDBs, have a small deposit base and mostly depend on borrowings for on-lending. Balance Sheet Operations V.69 After a contraction in 2015-16, the consolidated balance sheet of PCARDBs expanded in 2016-17. On the assets side, an acceleration was evident across all major heads, and most notably in investments and loans and advances. The business model of PCARDBs is primarily based on borrowings, which constitute more than 50 per cent of total liabilities. In 2016- 17, there was a sharp increase in borrowings, while other components on the liabilities side like capital and reserves decreased in reflection of the weak financial health of these institutions (Table V.23). Profitability V.70 PCARDBs registered losses in 2016-17 as growth in expenditure outpaced expansion in income. Interest income continued to contract, partly offset by increase in other income. Expenditure, however, expanded due to higher interest expenses and provisions. Operating profit, which was marginally positive in 2015-16, turned negative in 2016-17 (Table V.24). V.71 PCARDBs registered higher losses and the proportion of profit-making PCARDBs in the total also declined relative to the preceding year (Chart V.37). 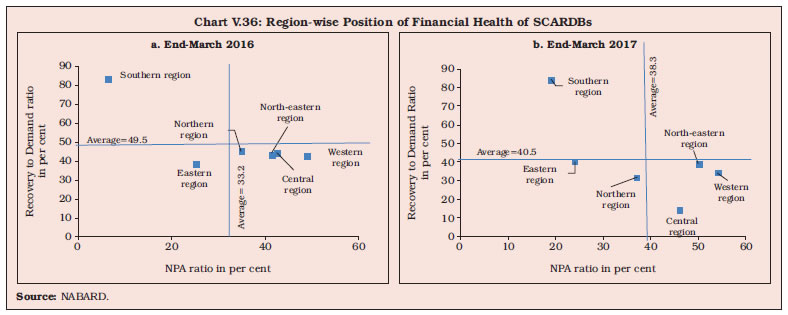
| Table V.23: Liabilities and Assets of Primary Co-operative Agriculture and Rural Development Banks | | (Amount in ₹ billion) | | Item | At end-March | Variation (%) | | 2016 | 2017 | 2015-16 | 2016-17 | | 1 | 2 | 3 | 4 | 5 | | Liabilities | | | | | | 1. Capital | 11 | 10 | -17.8 | -8.5 | | | (4.5) | (3.5) | | | | 2. Reserves | 25 | 17 | -38.4 | -32.5 | | | (10.3) | (5.8) | | | | 3. Deposits | 14 | 13 | 33.2 | -7.1 | | | (5.6) | (4.5) | | | | 4. Borrowings | 143 | 155 | -12.8 | 8.4 | | | (59.3) | (53.3) | | | | 5. Other Liabilities | 49 | 96 | -38.7 | 96 | | | (20.2) | (33.0) | | | | Assets | | | | | | 1. Cash and Bank Balances | 4 | 4 | -9.4 | 8.3 | | | (1.5) | (1.3) | | | | 2. Investments | 15 | 22 | -25.9 | 48.7 | | | (6.2) | (7.7) | | | | 3. Loans and Advances | 127 | 151 | -14.4 | 18.9 | | | (52.7) | (51.9) | | | | 4. Other Assets | 95 | 114 | -29.2 | 20 | | | (39.6) | (39.2) | | | | Total Liabilities/Assets | 241 | 291 | -21.6 | 20.7 | | | (100.0) | (100.0) | | | Notes: 1. Figures in parentheses are proportion to total liabilities/assets (in per cent).
2. Y-o-Y variations could be slightly different because absolute numbers have been off to ₹1 billion in the table.
3. Components may not add up to the total due to rounding off.
Source: NABARD. |
| Table V.24: Financial Performance of Primary Co-operative Agriculture and Rural Development Banks | | (Amount in ₹ billion) | | Item | As during | Variation (%) | | 2015-16 | 2016-17 | 2015-16 | 2016-17 | | 1 | 2 | 3 | 4 | 5 | | A. Income (i+ii) | 21 | 22 | -13.4 | 4.8 | | | (100.0) | (100.0) | | | | i. Interest Income | 18 | 16 | -9.3 | -11.1 | | | (83.7) | (72.7) | | | | ii. Other Income | 3 | 6 | -29.9 | 100.0 | | | (16.3) | (27.3) | | | | B. Expenditure (i+ii+iii) | 25 | 28 | -12.4 | 12.0 | | | (100.0) | (100.0) | | | | i. Interest Expended | 15 | 17 | -11.4 | 13.3 | | | (60.9) | (60.7) | | | | ii. Provisions and Contingencies | 5 | 6 | -23.9 | 20.0 | | | (18.5) | (21.4) | | | | iii. Operating Expenses | 5.1 | 5 | -2.5 | -2.0 | | | (20.6) | (17.9) | | | | C. Profits | | | | | | i. Operating Profits | 1 | -1 | -52.4 | - | | ii. Net Profits | -3.5 | -6.0 | -5.7 | - | Notes: 1. Figures in parentheses are proportion to total income/ expenditure (in per cent).
2. Y-o-Y variations could be slightly different because absolute numbers have been rounded off to ₹1 billion in the table.
3. Components may not add up to the total due to rounding off.
Source: NABARD. | Asset Quality V.72 Total NPAs of PCARDBs, which had declined in 2015-16, rose again in 2016-17 across all categories viz., sub-standard, doubtful and loss assets. There was, however, some improvement in the NPA ratios of PCARDBs during the year due to sharper increase in loans and advances. (Table V.25). Financial Health of PCARDBs vis-a-vis SCARDBs V.73 The NPA ratio of SCARDBs, which had shown improvement since 2013-14 due to better recovery, deteriorated in 2016-17 as the recovery ratio moderated. In contrast, the NPA ratio of PCARDBs improved in 2016-17, albeit remaining higher than that of SCARDBs (Chart V.38). | Table V.25: Asset Quality of Primary Co-operative Agriculture and Rural Development Banks | | (Amount in ₹ billion) | | Item | At end-March | Variation (%) | | 2016 | 2017 | 2015-16 | 2016-17 | | 1 | 2 | 3 | 4 | 5 | | A. Total NPAs (i+ii+iii) | 47 | 49 | -12.4 | 4.3 | | i) Sub-standard | 25 | 26 | -9.3 | 4 | | | (52.8) | (53.1) | | | | ii) Doubtful | 22 | 23 | -15.7 | 4.5 | | | (46.6) | (46.9) | | | | iii) Loss | 0.29 | 0.3 | -9.4 | 3.4 | | | (0.6) | (0.6) | | | | B. NPAs to Loans Ratio (%) | 37 | 33 | - | - | | C. Recovery to Demand Ratio (%) | 43.6 | 44.3 | - | - | Notes: 1. Figures in parentheses are proportion to total NPAs (in per cent).
2. Y-o-Y variations could be slightly different because absolute numbers have been rounded off to ₹ 1 billion in the table.
3. Components may not add up to the total due to rounding off.
Source: NABARD. | A Comparative Assessment of Short-term and Long-term Rural Credit Co-operatives V.74 While NPA ratios and losses of SCARDBs have increased and return on assets (RoA) turned negative in 2016-17, the NPA ratio of StCBs declined and profitability improved (Chart V.39). V.75 The ratio of assets, credit and capital of SCARDBs to assets/credit/capital of StCBs has declined over the years. In 2016-17, however, the capital of SCARDBs as proportion to that of StCBs improved significantly (Table V.26).
| Table V.26: Comparison of Assets, Credit and Capital Size of SCARDBs and StCBs | | Year | Amount of Assets of SCARDBs per ₹100 of Assets of StCBs | Amount of Credit of SCARDBs per ₹100 of Credit of StCBs | Amount of Capital of SCARDBs per ₹100 of Capital of StCBs | | 2013-14 | 18.3 | 20.1 | 29.0 | | 2014-15 | 16.7 | 18.5 | 18.2 | | 2015-16 | 13.3 | 16.6 | 16.1 | | 2016-17 | 13.0 | 16.7 | 27.9 | | Source: NABARD. | 4. Overall Assessment V.76 During 2017-18, the balance sheet of UCBs moderated after the demonetisation-induced expansion of deposits in the preceding year. Although NPA ratios improved marginally, their overall profitability moderated while capital positions remained broadly unchanged. V.77 UCBs are increasingly facing competition from new players like payments banks, SFBs and NBFCs. In order to remain competitive, it is necessary for them to adopt robust information technology (IT) systems, inter alia, by leveraging on the Reserve Bank’s IT support. As regards governance, the separation of executive and supervisory roles is essential to improve the interests of depositors. On June 25, 2018 the Reserve Bank released draft guidelines on the constitution of boards of management (in addition to the existing board of directors) to bring in members with specialised knowledge and professional management skills. The Reserve Bank introduced a scheme for voluntary transition of UCBs into SFBs to strengthen regulation and increase opportunities for growth. V.78 Within rural co-operatives on the other hand, performance is varied in terms of asset quality and profitability. While StCBs improved NPA ratios and profitability, both parameters deteriorated in the case of DCCBs. Over the years, the NABARD has undertaken various reforms in the short term rural co-operative sector, inter alia, by regularly monitoring CRAR levels and continuously following up with the state governments concerned for capital infusion as needed. V.79 The financial performance of long-term rural co-operatives institutions has been less than satisfactory and has deteriorated further in 2016-17, with both SCARDBs and PCARDBs reporting net losses. With NPA ratios of SCARDBs increasing significantly in 2016-17, the financial health of long-term rural co-operatives remains fragile. Given their importance in capital formation in agriculture, it is necessary to undertake measures to expand their deposit base, capital and product range for improving their financial performance.
|