Growth is expected to moderate in 2017-18 and firm up in 2018-19 on the back of higher private consumption, according to the 30 forecasters surveyed by the Reserve Bank. Consumer Price inflation is expected to gradually rise to 5.5 per cent by Q1:2018-19. Today, the Reserve Bank released the results of the 50th round of the Survey of Professional Forecasters (SPF), which it has been conducting since September 2007. Thirty analysts participated in the January 20182 round of the survey. The results are summarised in terms of median forecasts (Annexes 1-8) and are available at the RBI website. Highlights: 1. Output • Real gross domestic product (GDP) and real gross value added (GVA) are likely to grow by 6.5 per cent and 6.1 per cent, respectively, in 2017-18 and rise further by 90 and 100 basis points (bps), respectively in 2018-19 on the back of support from private consumption (Table 1). • The saving rate is expected to improve in 2018-19 without, however, a commensurate upturn in the investment rate. | Table 1: Median Forecast of Growth in Real GDP, GVA and Components | | (in per cent) | | | 2017-18 | 2018-19 | | Real GDP Growth | 6.5
(-0.2) | 7.4
(-0.1) | | Real GVA Growth | 6.1
(-0.4) | 7.1
(-0.3) | | a. Agriculture and Allied Activities | 2.1
(-0.9) | 3.2
(+0.2) | | b. Industry | 4.6
(-0.1) | 6.5
(-0.3) | | c. Services | 7.6
(-0.5) | 8.3
(-0.1) | Private Final Consumption Expenditure (nominal)
(growth rate in per cent) | 9.5
(-1.5) | 11.8
(-0.7) | Gross Saving Rate
[per cent of gross national deposable income (GNDI)] | 30.9
(-0.1) | 31.5
(0.0) | Gross Fixed Capital Formation Rate
(per cent of GDP) | 26.4
(-0.1) | 26.7
(-1.2) | | Note: In all the tables, figures in parentheses indicate the extent of revision in median forecasts (percentage points) relative to the previous SPF round. | • Forecasters have assigned the maximum probability to GVA growth being in the range of 6.0-6.4 per cent in 2017-18, as against the range of 6.5-6.9 per cent in the previous survey round (Chart 1). • For 2018-19, forecasters have assigned the highest probability to GVA growth being in the range of 7.0-7.4 per cent in this round; correspondingly, the probability of GVA growth being 7.5 per cent or more has been brought down (Chart 2). 2. Inflation • Headline consumer price index (CPI) inflation is expected to increase till Q1:2018-19 and moderate thereafter. Inflation forecasts have been revised up in the current round by 50-60 basis points from the previous round (Table 2). • CPI inflation excluding food and beverages, pan, tobacco and intoxicants, and fuel and light is likely to remain at around 5.0 per cent till Q3:2018-19. | Table 2: Median Forecast of Inflation | | (in per cent) | | | Q4:17-18 | Q1:18-19 | Q2:18-19 | Q3:18-19 | | CPI- Headline | 5.0
(+0.6) | 5.5
(+0.6) | 5.0
(+0.5) | 4.4 | | CPI excluding food & beverages, pan, tobacco & intoxicants and fuel & light | 4.9
(+0.1) | 5.3
(+0.1) | 5.3
(+0.4) | 4.9 | | WPI – All Commodities | 3.2
(+0.2) | 4.0
(+0.3) | 4.2
(+0.3) | 3.3 | | WPI – Non-food Manufactured Products | 2.7
(0.0) | 2.8
(0.0) | 2.9
(-0.2) | 2.4 | • Forecasters have assigned the highest probability to CPI inflation being in the range of 5.0-5.4 per cent in March 2018, with the distribution shifting to the right as compared with the previous round of the survey (Chart 3). • For March 2019, forecasters assigned the highest probability to CPI inflation in the range of 4.5-4.9 per cent (Chart 4). 3. External Sector • Forecasts of exports and imports during 2017-18 have been revised upwards from the last survey round; however, both export and import growth are likely to moderate in 2018-19 (Table 3). • The current account deficit (CAD) is expected to remain stable at around 1.7 per cent of GDP in 2017-18 and increase to 1.9 per cent in 2018-19. • The Indian rupee is likely to remain range-bound against the US dollar during the next four quarters (Annex 3). | Table 3: Median Forecast of Select External Sector Variables | | | 2017-18 | 2018-19 | Merchandise Exports: in US $ terms
(annual growth in per cent) | 9.5
(+1.6) | 8.3
(+0.8) | Merchandise Imports: in US $ terms
(annual growth in per cent) | 16.4
(+3.4) | 9.2
(+1.6) | Current Account Deficit
(Ratio to GDP at current market prices, in per cent) | 1.7
(+0.1) | 1.9
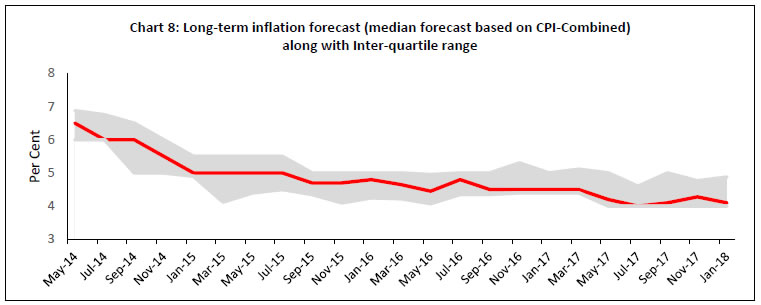
(+0.2) | 4. Medium-term and Long-term Forecasts • The medium-term (five-year average) real GVA growth forecast remained unchanged from the last survey round at 7.5 per cent (Chart 5), while the long-term (ten-year average) real GVA growth forecast moderated by 10 bps to 7.5 per cent (Chart 6).
• Average CPI headline inflation in the medium-term and the long-term are expected to be around 4.5 and 4.1 per cent, respectively, with the latter having been revised downwards by 20 bps, respectively, from the previous round of the survey (Charts 7 and 8). 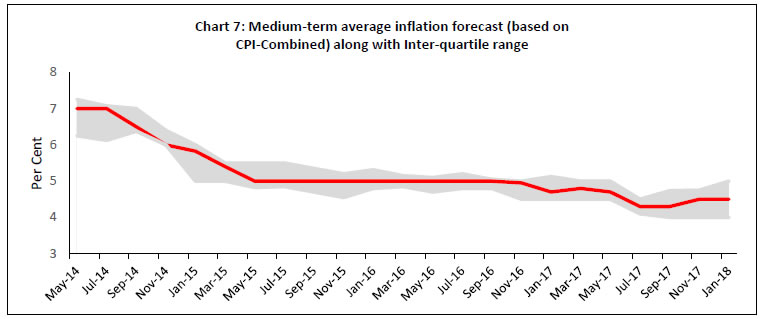
The Reserve Bank thanks the following institutions for their participation in this round of the Survey of Professional Forecasters (SPF): Aditi Nayar, ICRA Limited; Anubhuti Sahay, Standard chartered bank; Debopam Chaudhuri, Piramal Enterprises Limited; Dun & Bradstreet; Gaurav Kapur, IndusInd Bank Ltd.; ICICI Securities Primary Dealership; Indranil Pan, IDFC bank; Nikhil Gupta, Motilal Oswal Securities Ltd.; PHD Research Bureau; Sameer Narang, Bank of Baroda; Shailesh Kejariwal, B&K Securities India Pvt Ltd; Siddharth V Kothari, Sunidhi Securities & Finance Ltd; Sumedh Deorukhkar, BBVA Hong Kong; and Upasna Bhardwaj, Kotak Mahindra Bank. The Bank also acknowledges the contribution of 12 others SPF panellists, who prefer to remain anonymous. |
| Annex 1: Annual Forecasts for 2017-18 | | | Key Macroeconomic Indicators | Annual Forecasts for 2017-18 | | Mean | Median | Max | Min | 1st quartile | 3rd quartile | | 1 | GDP at constant (2011-12) prices: Annual Growth (per cent) | 6.5 | 6.5 | 6.8 | 6.4 | 6.5 | 6.6 | | 2 | GVA at basic prices at constant (2011-12) prices: Annual Growth rate (per cent) | 6.2 | 6.1 | 6.6 | 6.1 | 6.1 | 6.4 | | a | Agriculture & Allied Activities (growth rate in per cent) | 2.2 | 2.1 | 3.3 | 1.9 | 2.1 | 2.1 | | b | Industry (growth rate in per cent) | 4.9 | 4.6 | 6.0 | 4.4 | 4.6 | 5.2 | | c | Services (growth rate in per cent) | 7.8 | 7.7 | 8.4 | 7.3 | 7.7 | 8.0 | | 3 | Private Final Consumption Expenditure (PFCE) at current prices: Annual Growth (per cent) | 9.7 | 9.5 | 12.3 | 8.8 | 9.5 | 9.5 | | 4 | Gross Saving Rate (per cent of Gross National Disposable Income) - at current prices | 31.2 | 30.9 | 35.2 | 28.5 | 30.4 | 31.9 | | 5 | Gross Fixed Capital Formation (GFCF) Rate (per cent of GDP at current market prices) | 26.5 | 26.4 | 28.1 | 26.3 | 26.4 | 26.4 | | 6 | Fiscal Deficit of Central Govt. (per cent of GDP at current market prices) | 3.2 | 3.5 | 3.8 | -3.5 | 3.4 | 3.5 | | 7 | Combined Gross Fiscal Deficit (per cent to GDP) | 6.5 | 6.5 | 6.8 | 6.2 | 6.4 | 6.6 | | 8 | Bank Credit - Scheduled commercial banks: Annual Growth (per cent) | 8.8 | 9.2 | 12.0 | 3.8 | 7.7 | 10.0 | | 9 | Yield on 10-Year G-Sec of Central Govt. (end-period) | 7.3 | 7.3 | 7.5 | 7.0 | 7.1 | 7.4 | | 10 | Yield on 91-day T-Bill of Central Govt. (end-period) | 6.3 | 6.4 | 6.5 | 5.8 | 6.2 | 6.4 | | 11 | Merchandise Exports - BoP basis - In US $ bn. | 308.4 | 308.0 | 391.0 | 289.2 | 300.0 | 310.0 | | 12 | Merchandise Exports - BoP basis - Annual Growth (per cent) | 8.6 | 9.5 | 12.0 | 3.2 | 6.9 | 10.6 | | 13 | Merchandise Imports - BoP basis - In US $ bn. | 462.7 | 457.0 | 585.0 | 439.3 | 448.7 | 465.6 | | 14 | Merchandise Imports - BoP basis - Annual Growth (per cent) | 17.9 | 16.4 | 49.0 | 11.9 | 14.4 | 18.6 | | 15 | Current Account Balance - In US $ bn. | -45.3 | -45.0 | -35.0 | -56.9 | -49.8 | -41.1 | | 16 | Current Account Balance - Ratio to GDP at current market price (per cent) | -1.5 | -1.7 | 1.1 | -2.2 | -1.9 | -1.5 | | 17 | Overall BoP - In US $ bn. | 24.9 | 26.1 | 41.9 | -7.0 | 22.5 | 30.0 | | 18 | Inflation based on CPI-Combined - Headline | 3.8 | 3.7 | 5.5 | 3.4 | 3.6 | 3.8 | | 19 | Inflation based on CPI-Combined - excluding 'Food & Beverages', 'Pan, Tobacco & Intoxicants' and 'Fuel & Light' | 4.5 | 4.5 | 4.9 | 3.4 | 4.5 | 4.6 | | 20 | Inflation based on WPI - All Commodities | 3.0 | 3.0 | 3.5 | 2.7 | 2.9 | 3.3 | | 21 | Inflation based on WPI -Non-food Manufactured Products | 2.4 | 2.6 | 3.0 | -0.1 | 2.4 | 2.7 |
| Annex 2: Annual Forecasts for 2018-19 | | | Key Macroeconomic Indicators | Annual Forecasts for 2018-19 | | Mean | Median | Max | Min | 1st quartile | 3rd quartile | | 1 | GDP at constant (2011-12) prices: Annual Growth (per cent) | 7.3 | 7.4 | 7.7 | 6.8 | 7.2 | 7.5 | | 2 | GVA at basic prices at constant (2011-12) prices: Annual Growth rate (per cent) | 7.1 | 7.1 | 7.5 | 6.5 | 7.0 | 7.3 | | a | Agriculture & Allied Activities (growth rate in per cent) | 3.1 | 3.2 | 4.5 | 1.2 | 2.9 | 3.5 | | b | Industry (growth rate in per cent) | 6.7 | 6.5 | 10.8 | 4.1 | 6.1 | 7.1 | | c | Services (growth rate in per cent) | 8.3 | 8.3 | 9.2 | 7.1 | 8.1 | 8.8 | | 3 | Private Final Consumption Expenditure (PFCE) at current prices: Annual Growth (per cent) | 11.8 | 11.8 | 15.2 | 7.4 | 10.8 | 13.0 | | 4 | Gross Saving Rate (per cent of Gross National Disposable Income) - at current prices | 30.9 | 31.5 | 33.4 | 28.2 | 30.0 | 31.8 | | 5 | Gross Fixed Capital Formation (GFCF) Rate (per cent of GDP at current market prices) | 26.8 | 26.7 | 30.3 | 24.2 | 25.8 | 27.4 | | 6 | Fiscal Deficit of Central Govt. (per cent of GDP at current market prices) | 2.9 | 3.2 | 3.4 | -3.2 | 3.1 | 3.2 | | 7 | Combined Gross Fiscal Deficit (per cent to GDP) | 6.0 | 6.2 | 6.5 | 3.0 | 6.0 | 6.3 | | 8 | Bank Credit - Scheduled commercial banks: Annual Growth (per cent) | 10.9 | 11.0 | 14.5 | 8.0 | 9.9 | 11.6 | | 9 | Yield on 10-Year G-Sec of Central Govt. (end-period) | 7.3 | 7.2 | 8.0 | 6.6 | 7.0 | 7.6 | | 10 | Yield on 91-day T-Bill of Central Govt. (end-period) | 6.3 | 6.3 | 6.6 | 5.7 | 6.1 | 6.5 | | 11 | Merchandise Exports - BoP basis - In US $ bn. | 331.7 | 327.9 | 400.0 | 307.0 | 319.0 | 340.0 | | 12 | Merchandise Exports - BoP basis - Annual Growth (per cent) | 10.0 | 8.3 | 29.0 | 5.0 | 5.6 | 10.3 | | 13 | Merchandise Imports - BoP basis - In US $ bn. | 507.4 | 495.0 | 700.0 | 403.2 | 480.0 | 517.3 | | 14 | Merchandise Imports - BoP basis - Annual Growth (per cent) | 10.4 | 9.2 | 40.0 | 1.7 | 6.9 | 11.3 | | 15 | Current Account Balance - In US $ bn. | -57.8 | -54.9 | -47.0 | -80.0 | -61.8 | -51.0 | | 16 | Current Account Balance - Ratio to GDP at current market price (per cent) | -1.8 | -1.9 | 1.0 | -2.8 | -2.2 | -1.7 | | 17 | Overall BoP - In US $ bn. | 17.5 | 19.9 | 50.0 | -20.0 | 10.7 | 23.7 | | 18 | Inflation based on CPI-Combined - Headline | 4.8 | 4.7 | 5.5 | 4.2 | 4.5 | 5.2 | | 19 | Inflation based on CPI-Combined - excluding 'Food & Beverages', 'Pan, Tobacco & Intoxicants' and 'Fuel & Light' | 5.0 | 5.0 | 6.3 | 4.1 | 4.6 | 5.4 | | 20 | Inflation based on WPI - All Commodities | 3.9 | 3.8 | 5.5 | 3.0 | 3.3 | 4.6 | | 21 | Inflation based on WPI -Non-food Manufactured Products | 3.0 | 3.2 | 3.8 | 2.0 | 2.4 | 3.6 |
| Annex 3: Quarterly Forecasts from Q3:2017-18 to Q3:2018-19 | | | Key Macroeconomic Indicators | Quarterly Forecasts | | Q3: 2017-18 | Q4: 2017-18 | Q1: 2018-19 | | Mean | Median | Max | Min | Mean | Median | Max | Min | Mean | Median | Max | Min | | 1 | GDP at constant (2011-12) prices: Annual Growth (per cent) | 6.9 | 6.9 | 8.5 | 6.3 | 7.1 | 7.2 | 7.9 | 6.3 | 7.3 | 7.2 | 7.8 | 6.6 | | 2 | GVA at constant (2011-12) prices: Annual Growth (per cent) | 6.5 | 6.5 | 7.3 | 5.5 | 7.1 | 6.9 | 8.5 | 6.3 | 7.1 | 7.2 | 7.7 | 6.3 | | a | Agriculture & Allied Activities (growth rate in per cent) | 2.1 | 2.0 | 4.8 | 0.8 | 2.8 | 3.0 | 5.0 | 1.0 | 2.7 | 2.7 | 4.0 | 0.8 | | b | Industry (growth rate in per cent) | 6.3 | 6.0 | 7.8 | 5.0 | 6.4 | 6.2 | 10.6 | 3.5 | 7.0 | 6.7 | 10.0 | 4.6 | | c | Services (growth rate in per cent) | 8.0 | 8.2 | 9.3 | 6.7 | 8.5 | 8.4 | 10.0 | 7.3 | 8.1 | 8.1 | 9.0 | 7.0 | | 3 | PFCE at current prices: Y-on-Y Growth (per cent) | 10.4 | 9.8 | 14.1 | 8.5 | 11.0 | 10.5 | 15.7 | 8.1 | 11.5 | 10.8 | 14.5 | 9.5 | | 4 | GFCF Rate (per cent of GDP at current market prices) | 26.8 | 26.0 | 30.0 | 25.6 | 26.2 | 25.7 | 30.2 | 24.2 | 27.6 | 26.6 | 31.2 | 25.6 | | 5 | IIP (2011-12=100): Quarterly Average Growth (per cent) | 5.6 | 5.9 | 7.0 | 4.1 | 5.8 | 5.2 | 9.0 | 3.6 | 5.7 | 5.0 | 8.9 | 4.3 | | 6 | Merchandise Exports - BoP basis (in US$ bn.) | 77.0 | 77.4 | 78.3 | 75.0 | 82.1 | 82.6 | 87.0 | 77.4 | 79.8 | 78.9 | 85.0 | 76.2 | | 7 | Merchandise Imports - BoP basis (in US$ bn.) | 121.8 | 119.5 | 147.0 | 115.3 | 124.5 | 121.2 | 161.1 | 107.7 | 128.9 | 122.9 | 170.0 | 115.0 | | 8 | Rupee - US_Dollar Exchange rate (RBI reference rate) (end-period) | - | - | - | - | 64.1 | 64.0 | 65.5 | 62.5 | 64.6 | 64.5 | 67.4 | 61.5 | | 9 | Crude Oil (Indian basket) price (US $ per barrel) (end-period) | - | - | - | - | 64.8 | 65.0 | 69.0 | 53.0 | 63.5 | 63.9 | 68.0 | 52.5 | | 10 | Repo Rate (end-period) | - | - | - | - | 6.0 | 6.0 | 6.0 | 5.8 | 6.0 | 6.0 | 6.3 | 5.8 |
| Key Macroeconomic Indicators | Quarterly Forecasts | Q2: 2018-19 | Q3: 2018-19 | Mean | Median | Max | Min | Mean | Median | Max | Min | | 1 | GDP at constant (2011-12) prices: Annual Growth (per cent) | 7.3 | 7.3 | 7.9 | 6.8 | 7.2 | 7.2 | 7.7 | 6.8 | | 2 | GVA at constant (2011-12) prices: Annual Growth (per cent) | 7.2 | 7.2 | 8.0 | 6.6 | 7.1 | 7.2 | 7.6 | 6.5 | | a | Agriculture & Allied Activities (growth rate in per cent) | 3.4 | 3.2 | 4.6 | 2.5 | 2.5 | 3.2 | 5.6 | -7.7 | | b | Industry (growth rate in per cent) | 6.7 | 6.5 | 11.7 | 4.5 | 7.0 | 6.5 | 12.0 | 5.6 | | c | Services (growth rate in per cent) | 8.2 | 8.2 | 9.5 | 5.7 | 8.6 | 8.6 | 11.8 | 7.2 | | 3 | PFCE at current prices: Y-on-Y Growth (per cent) | 11.7 | 11.7 | 13.8 | 9.9 | 12.1 | 12.1 | 14.2 | 10.5 | | 4 | GFCF Rate (per cent of GDP at current market prices) | 27.3 | 26.4 | 31.0 | 24.6 | 27.6 | 26.5 | 33.0 | 24.5 | | 5 | IIP (2011-12=100): Quarterly Average Growth (per cent) | 5.8 | 5.5 | 9.2 | 3.7 | 5.5 | 5.1 | 7.0 | 3.7 | | 6 | Merchandise Exports - BoP basis (in US$ bn.) | 83.0 | 81.0 | 96.0 | 78.7 | 84.1 | 82.1 | 104.0 | 77.3 | | 7 | Merchandise Imports - BoP basis (in US$ bn.) | 131.6 | 122.0 | 178.0 | 115.5 | 138.5 | 133.4 | 190.0 | 120.5 | | 8 | Rupee - US_Dollar Exchange rate (RBI reference rate) (end-period) | 64.9 | 65.0 | 67.5 | 62.5 | 65.3 | 65.5 | 69.0 | 62.5 | | 9 | Crude Oil (Indian basket) price (US $ per barrel) (end-period) | 62.2 | 63.0 | 68.5 | 53.0 | 62.7 | 64.0 | 68.9 | 52.8 | | 10 | Repo Rate (end-period) | 6.0 | 6.0 | 6.3 | 5.5 | 6.0 | 6.0 | 6.3 | 5.6 |
| Annex 4: Forecasts of CPI-Combined Inflation | | (per cent) | | | CPI Combined Headline | Core CPI Combined (excluding ‘Food & Beverages’, 'Pan, Tobacco & Intoxicants' and ‘Fuel & Light’) | | Mean | Median | Max | Min | Mean | Median | Max | Min | | Q4:2017-18 | 5.0 | 5.0 | 6.0 | 3.6 | 5.0 | 4.9 | 5.9 | 4.4 | | Q1:2018-19 | 5.4 | 5.5 | 6.6 | 3.9 | 5.4 | 5.3 | 6.2 | 4.7 | | Q2:2018-19 | 5.0 | 5.0 | 5.8 | 3.9 | 5.3 | 5.3 | 6.6 | 4.3 | | Q3:2018-19 | 4.6 | 4.4 | 6.1 | 3.8 | 5.1 | 4.9 | 6.4 | 3.8 |
| Annex 5: Forecasts of WPI Inflation | | (per cent) | | | WPI Headline | WPI – Non-food Manufactured Products | | Mean | Median | Max | Min | Mean | Median | Max | Min | | Q4:2017-18 | 3.2 | 3.2 | 4.5 | 2.6 | 2.7 | 2.7 | 3.5 | 2.2 | | Q1:2018-19 | 4.2 | 4.0 | 5.5 | 3.1 | 2.8 | 2.8 | 3.9 | 2.3 | | Q2:2018-19 | 4.3 | 4.2 | 5.4 | 3.4 | 3.0 | 2.9 | 4.1 | 2.2 | | Q3:2018-19 | 3.7 | 3.3 | 5.5 | 2.5 | 2.9 | 2.4 | 4.5 | 1.8 |
| Annex 6: Mean probabilities attached to possible outcomes of Real GVA growth | | Growth Range | Forecasts for 2017-18 | Forecasts for 2018-19 | | 10.0 per cent or more | 0.00 | 0.00 | | 9.5 to 9.9 per cent | 0.00 | 0.00 | | 9.0 to 9.4 per cent | 0.00 | 0.00 | | 8.5 to 8.9 per cent | 0.00 | 0.00 | | 8.0 to 8.4 per cent | 0.00 | 0.03 | | 7.5 to 7.9 per cent | 0.01 | 0.24 | | 7.0 to 7.4 per cent | 0.07 | 0.56 | | 6.5 to 6.9 per cent | 0.43 | 0.15 | | 6.0 to 6.4 per cent | 0.44 | 0.02 | | 5.5 to 5.9 per cent | 0.04 | 0.00 | | 5.0 to 5.4 per cent | 0.00 | 0.00 | | 4.5 to 4.9 per cent | 0.00 | 0.00 | | 4.0 to 4.4 per cent | 0.00 | 0.00 | | 3.5 to 3.9 per cent | 0.00 | 0.00 | | 3.0 to 3.4 per cent | 0.00 | 0.00 | | 2.5 to 2.9 per cent | 0.00 | 0.00 | | 2.0 to 2.4 per cent | 0.00 | 0.00 | | Below 2.0 per cent | 0.00 | 0.00 |
| Annex 7: Mean probabilities attached to possible outcomes of CPI (Combined) inflation | | Inflation Range | Forecasts for March 2018 | Forecasts for March 2019 | | 8.0 per cent or above | 0.00 | 0.00 | | 7.5 to 7.9 per cent | 0.00 | 0.00 | | 7.0 to 7.4 per cent | 0.00 | 0.00 | | 6.5 to 6.9 per cent | 0.00 | 0.00 | | 6.0 to 6.4 per cent | 0.00 | 0.00 | | 5.5 to 5.9 per cent | 0.04 | 0.08 | | 5.0 to 5.4 per cent | 0.31 | 0.14 | | 4.5 to 4.9 per cent | 0.21 | 0.33 | | 4.0 to 4.4 per cent | 0.16 | 0.31 | | 3.5 to 3.9 per cent | 0.21 | 0.12 | | 3.0 to 3.4 per cent | 0.06 | 0.02 | | 2.5 to 2.9 per cent | 0.00 | 0.00 | | 2.0 to 2.4 per cent | 0.00 | 0.00 | | 1.5 to 1.9 per cent | 0.00 | 0.00 | | 1.0 to 1.4 per cent | 0.00 | 0.00 | | 0.5 to 0.9 per cent | 0.00 | 0.00 | | 0 to 0.4 per cent | 0.00 | 0.00 | | Below 0 per cent | 0.00 | 0.00 |
| Annex 8: Medium-and Long-term Forecasts of GVA Growth and Inflation | | | Annual average percentage change over the next five years | Annual average percentage change over the next ten years | | Mean | Median | Max | Min | Mean | Median | Max | Min | | Real GVA | 7.5 | 7.5 | 8.0 | 7.0 | 7.7 | 7.5 | 10.0 | 7.0 | | CPI Combined | 4.5 | 4.5 | 5.5 | 3.5 | 4.4 | 4.1 | 5.9 | 4.0 | | Note: CPI: Consumer Price Index; GDP: Gross Domestic Product; GNDI: Gross National Disposable Income; GVA: Gross Value Added; IIP: Index of Industrial Production; WPI: Wholesale Price Index. |
|