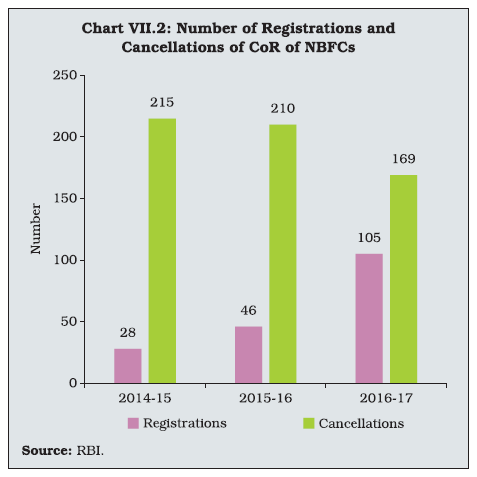
Non-banking financial institutions (NBFIs) are an important alternative channel of finance for the commercial sector in India’s bank dominated financial sector. Their role in promoting financial inclusion and catering to the needs of small businesses and specialised segments is an additional dimension of their relevance in the Indian context. Regulations relating to governing non-banking financial companies (NBFCs) are being increasingly harmonised with those of banks to forge the right balance for financial stability while encouraging them to focus on specialised areas. I. Introduction VII.1 Non-banking financial institutions (NBFIs) have been intermediating a growing share of the resource flows to the commercial sector. NBFIs regulated by the Reserve Bank are all-India financial institutions (AIFIs), non-banking financial companies (NBFCs) and primary dealers (PDs) (Chart VII.1). AIFIs, largely an outcome of development planning in India, were created as apex public entities for providing long-term financing / refinancing to specific sectors. NBFCs, on the other hand, are mostly private sector institutions that specialise in meeting the credit needs and a variety of financial services of niche areas which, inter alia, include financing of physical assets, commercial vehicles and infrastructure loans. PDs, which came into existence in 1995, play an important role in both the primary and secondary markets for government securities. In terms of balance sheet size, AIFIs constitute 23 per cent of NBFIs’ total assets, while NBFCs represent 76 per cent and standalone PDs constitute 1 per cent. 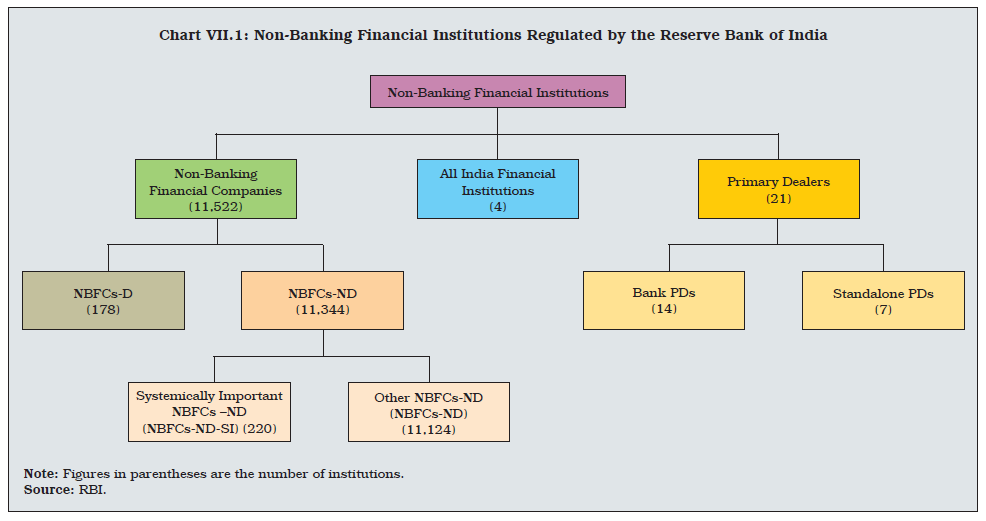 VII.2 Against this background, this chapter presents an analysis of the financial performance of each of these NBFIs in 2016-17. The chapter is organised into seven sections. Section 2 provides an aggregated view of the NBFC sector – both deposit-taking NBFCs (NBFCs-D) and non-deposit taking systemically important NBFCs (NBFCs-NDSI). Section 3 discusses the financial performance of payments banks – a newly created form of differentiated banks. The finances of AIFIs are analysed in Section 4, followed by an evaluation of the role of primary dealers in Section 5. Section 6 sets out the latest developments and Section 7 concludes with an overall assessment. II. Non-Banking Financial Companies VII.3 NBFCs are classified on the basis of their liability structures, the type of activities they undertake and their systemic importance. In terms of liability structure, NBFCs are classified into two categories – deposit-taking NBFCs or NBFCs-D, which accept and hold public deposits and non-deposit taking NBFCs or NBFCs-ND, which do not accept public deposits. Among NBFCs-ND, those with an asset size of ₹5 billion or more are classified as non-deposit taking systemically important NBFCs (NBFCs-ND-SI). For the purpose of issuing certificates of registration (CoRs), NBFCs were categorised as Type I and Type II companies in June 2016. The applications for Type I NBFCs, which do not have / intend to accept public funds and do not have / intend to have customer interface, are considered on a fast-track basis. NBFCs are also categorised on the basis of the activities undertaken by them with a view to meeting sector-specific requirements, entailing appropriate modulation of the regulatory regime. With addition of new categories over time, there were 12 types of NBFCs as of date under this categorisation (Table VII.1). VII.4 At end-March 2017, there were 11,522 NBFCs registered with the Reserve Bank, of which 178 were NBFCs-D and 220 were NBFCs-ND-SI. The number of NBFCs has been declining over time with cancellations of registrations exceeding new registrations on account of voluntary surrender or cancellation of CoR due to noncompliance of revised criteria of net owned fund (NOF) (Chart VII.2). | Table VII.1: Classification of NBFCs Based on Activity | | Type of NBFC | Activity | | 1. Asset Finance Company (AFC) | Financing of physical assets supporting productive / economic activities, including automobiles, tractors and generators. | | 2. Loan Company | Providing of finance whether by making loans or advances or otherwise for any activity other than its own but does not include an asset finance company. | | 3. Investment Company | Acquiring securities for purpose of selling. | | 4. NBFC- Infrastructure Finance Company (NBFC-IFC) | Providing infrastructure loans. | | 5. NBFC-Systemically Important Core Investment Company (CIC-ND-SI) | Acquiring shares and securities for investment mainly in equity market. | | 6. Infrastructure Debt Fund-NBFC (IDF-NBFC) | For facilitating flow of long-term debt into infrastructure projects. | | 7. NBFC-Micro Finance Institution (NBFC-MFI) | Extending credit to economically disadvantaged groups. | | 8. NBFC-Factor | Undertaking the business of acquiring receivables of an assignor or extending loans against the security interest of the receivables at a discount. | | 9. NBFC- Non-Operative Financial Holding Company (NOFHC) | For permitting promoters / promoter groups to set up a new bank. | | 10. Mortgage Guarantee Company (MGC) | Undertaking mortgage guarantee business. | | 11. NBFC-Account Aggregator (NBFC-AA) | Collecting and providing information about a customer’s financial assets in a consolidated, organised and retrievable manner to the customer or others as specified by the customer. | | 12. NBFC-Peer to Peer Lending Platform (NBFC-P2P) | Providing an online platform to bring lenders and borrowers together to help mobilise funds. | | Source: RBI. |
 Balance Sheet VII.5 Double-digit growth in credit extended by NBFCs has improved resilience and stability of the economy by filling up the financing gap opened up by the muted bank credit growth from 2014-15. NBFCs’ consolidated balance sheet1 turned around and expanded during 2016-17 from a marginal decline in the previous year. Borrowings by NBFCs from various sources, which accounted for 70 per cent of their total liabilities, increased by 12.1 per cent in 2016-17 mainly through market-based instruments such as commercial paper (CPs) and debentures even as borrowings from banks contracted. Growth in public deposits decelerated which is, however, attributable to the revised regulatory guidelines issued in November 2014 mandating that only rated NBFCs-D can accept and maintain public deposits. Unrated companies were required to get rated by March 31, 2016 to be able to renew existing deposits / accept fresh deposits or else return deposits to the public. Further, the limit on acceptance of deposits for rated asset finance companies (AFCs) was reduced from 4 times to 1.5 times of their NOF as part of harmonisation across the sector. Loans and advances, constituting three-fourth of total assets, picked up sharply as space opened up with the reduced pace of bank credit growth. Investments too reversed from contraction in the previous year and rose strongly during 2016-17 reflecting higher investments in equity shares in the wake of ebullient market (Table VII.2). Table VII.2: Consolidated Balance Sheet of NBFCs
(End-March) | | (Amount in ₹ billion) | | Items | 2014 | 2015 | 2016 | 2017 | Percentage variation | | 2015-16 | 2016-17 | | 1 | 2 | 3 | 4 | 5 | 6 | 7 | | 1. Share capital | 737 | 851 | 761 | 921 | -10.6 | 21.0 | | 2. Reserves and surplus | 2,723 | 3,117 | 3,033 | 3,538 | -2.7 | 16.7 | | 3. Public deposits | 131 | 205 | 271 | 306 | 32.2 | 12.9 | | 4. Bank borrowings | 2,910 | 3,106 | 3,376 | 3,141 | 8.7 | -7.0 | | 5. Debentures | 4,596 | 5,740 | 5,394 | 6,462 | -6.0 | 19.8 | | 6. Commercial paper | 462 | 630 | 852 | 1,267 | 35.2 | 48.7 | | 7. Other borrowings | 2,175 | 2,761 | 2,639 | 2,878 | -4.4 | 9.1 | | 8. Other liabilities | 766 | 875 | 904 | 1,158 | 3.3 | 28.1 | | Total liabilities/assets | 14,499 | 17,284 | 17,231 | 19,671 | -0.3 | 14.2 | | 1. Loans and advances | 10,782 | 11,864 | 13,169 | 14,846 | 11.0 | 12.7 | | 2. Investments | 2,159 | 2,603 | 2,253 | 2,673 | -13.4 | 18.6 | | 3. Other assets | 1,558 | 2,817 | 1,810 | 2,152 | -35.7 | 18.9 | | Source: RBI Supervisory Returns. | Sectoral Credit of NBFCs VII.6 NBFCs specialise in catering to sectorspecific financial needs covering retail; consumer and vehicle loans; micro, small and medium enterprises (MSMEs); large industry / infrastructure; and micro finance among others. A significant growth in credit to retail and services segments also underlines their increasing role in financial inclusion. Industry receives about 60 per cent of total credit by NBFCs, followed by retail, services and agriculture. VII.7 Within the sectoral deployment, retail credit increased at the highest pace on account of consumer durables and credit card receivables; this was followed by services and industry. On the other hand, credit to agriculture and allied activities contracted perhaps on account of transitory disruptions in cash-intensive value chains due to demonetisation (Table VII.3). Credit to the micro and small segments in both industry and services sectors displayed robust growth while vehicle loans declined during 2016-17 reflecting the transient impact of demonetisation (Appendix Table VII.1). Table VII.3: Credit to Select Sectors by NBFCs
(End-March) | | (Amount in ₹ billion) | | Items | 2016 | 2017 | Share in gross advances in 2017
(Per cent) | Percentage variation | | 1 | 2 | 3 | 4 | 5 | | I. Gross advances | 13,169 | 14,846 | - | 12.7 | | II. Non-food credit (1 to 5) | 13,167 | 14,846 | 100.0 | 12.8 | | 1. Agriculture and allied activities | 392 | 346 | 2.3 | -11.7 | | 2. Industry (2.1 to 2.4) | 8,063 | 8,940 | 60.2 | 10.9 | | 2.1 Micro and small | 326 | 508 | 3.4 | 55.8 | | 2.2 Medium | 154 | 172 | 1.2 | 11.7 | | 2.3 Large | 3,726 | 4,375 | 29.5 | 17.4 | | 2.4 Others | 3,857 | 3,885 | 26.2 | 0.7 | | 3. Services | 1,865 | 2,224 | 15.0 | 19.2 | | 4. Retail loans | 2,047 | 2,490 | 16.8 | 21.6 | | 4.1 Vehicle/auto loans | 1,150 | 1,035 | 7.0 | -10.0 | | 5. Other non-food credit | 801 | 847 | 5.7 | 5.7 | Note: Food credit was approximately ₹1 billion in 2015-16 and nil in 2016-17.
Source: RBI Supervisory Returns. |
Exposure to Sensitive Sectors VII.8 The Reserve Bank defines the capital market, real estate and commodities as sensitive sectors in view of the risks associated with fluctuations in prices of such assets. NBFCs’ exposure to real estate increased during 2016-17 reflecting search for higher yields (Chart VII.3). Financial Performance of NBFCs VII.9 NBFCs’ profitability declined during 2016-17 due to increased provisioning requirements (Table VII.4). Their cost to income ratio increased reflecting deterioration in operational efficiency. VII.10 Reflecting the slowdown in net profits, NBFCs’ return on equity (RoE) and return on assets (RoA) – the two major profitability indicators – were lower during 2016-17 than a year ago (Chart VII.4). Table VII.4: Financial Parameters of the NBFC Sector
(End-March) | | (Amount in ₹ billion) | | Items | 2014 | 2015 | 2016 | 2017 | | 1 | 2 | 3 | 4 | 5 | | A. Income | 1,713 | 2,009 | 2,142 | 2,310 | | B. Expenditure | 1,279 | 1,495 | 1,628 | 1,822 | | C. Net profit | 313 | 365 | 367 | 314 | | D. Total assets | 14,499 | 17,284 | 17,231 | 19,671 | | E. Financial ratios (as per cent of total assets) | | | | | | (i) Income | 11.8 | 11.6 | 12.4 | 11.7 | | (ii) Expenditure | 8.8 | 8.6 | 9.4 | 9.3 | | (iii) Net profit | 2.2 | 2.1 | 2.1 | 1.6 | | F. Cost to income ratio | 74.6 | 74.4 | 76.0 | 78.9 | | Source: RBI Supervisory Returns. | Asset Quality VII.11 During the year, NBFCs faced some deterioration in their asset quality mainly on account of the sluggishness in industrial activity. Both their gross non-performing assets (GNPAs) ratio and net non-performing assets (NNPAs) ratio increased during 2016-17. The recent spike in these ratios also reflects the revision in the recognition norms of NPAs being implemented in a phased manner beginning 2015-162 (Chart VII.5). VII.12 Deterioration of asset quality was also evident in the increased share of doubtful assets denoting the aging of NPAs in the sector (Table VII.5). | Table VII.5: Classification of NBFCs’ Assets | | (Per cent) | | Items | 2013-14 | 2014-15 | 2015-16 | 2016-17 | | 1 | 2 | 3 | 4 | 5 | | Standard assets | 95.7 | 95.8 | 95.5 | 95.0 | | Sub-standard assets | 2.6 | 2.8 | 2.6 | 2.6 | | Doubtful assets | 1.2 | 1.1 | 1.6 | 2.1 | | Loss assets | 0.5 | 0.3 | 0.3 | 0.3 | | Total | 100.0 | 100.0 | 100.0 | 100.0 | | Source: RBI Supervisory Returns. |
Capital Adequacy VII.13 With a moderate deterioration in asset quality and expansion in the credit portfolio, NBFC sector’s capital to risk-weighted assets ratio (CRAR) declined in 2016-17 (Chart VII.6). Nevertheless, it remained well above the stipulated norm of 15 per cent. Non-Deposit taking Systemically Important NBFCs VII.14 NBFCs-ND-SI constitute 86 per cent of the total assets of the NBFC sector. The number of these companies declined by more than half in 2015-16 in view of the revised regulatory framework for NBFCs, which raised threshold asset size for NBFCs-ND-SI to ₹5 billion or more from ₹1 billion. Accordingly, many of the NBFCs-ND-SI were reclassified as NBFC-ND in view of the changed definition. In terms of ownership, non-government NBFCs-ND-SI held 62.9 per cent of the total assets of NBFCs-ND-SI (Table VII.6). Balance Sheet VII.15 The consolidated balance sheet of NBFCs-ND-SI expanded strongly in 2016-17 due to growth in credit, which has improved the resilience and stability of the economy by filling up the financing gap opened up by the muted bank credit growth (Box VII.1). VII.16 The accretion to liabilities was mainly on account of share capital, debentures and CPs; on the other hand, borrowings from both banks and the government declined during the year. Although loans and advances of NBFCs-ND-SI increased during the year, investments grew at a faster pace reflecting a preference to park funds in high yield instruments such as debentures, corporate bonds, equity shares and mutual fund units (Table VII.7). VII.17 Category-wise, loan companies (LCs) contributed the most to the increase in the consolidated balance sheet of NBFCs-ND-SI during 2016-17, supported by a healthy growth in the retail segment, especially in consumer durables. The balance sheet of infrastructure finance companies (NBFCs-IFC), the other major category of NBFCs-ND-SI, was subdued by risk aversion due to asset quality concerns in the sector. The balance sheet of AFCs was almost unchanged, reflecting postponement of decisions to purchase assets after demonetisation. The subdued growth of the NBFCs-micro finance institution (NBFCs-MFI) balance sheet was partially due to the conversion of a few large NBFCs-MFI into small finance banks (Table VII.8). Balance sheet of investment companies expanded moderately; while loans and advances increased, their investments declined. Table VII.6: Ownership Pattern of NBFCs-ND-SI
(End-March) | | (Amount in ₹ billion) | | Ownership | 2014 | 2015 | 2016 | 2017 | | Number | Asset size | Number | Asset size | Number | Asset size | Number | Asset size | | 1 | 2 | 3 | 4 | 5 | 6 | 7 | 8 | 9 | | A. Government companies | 15 | 4,181 | 15 | 5,337 | 15 | 5,765 | 15 | 6,280 | | B. Non-government companies (1+2) | 478 | 8,561 | 456 | 9,895 | 205 | 9,068 | 205 | 10,637 | | 1. Public ltd. companies | 252 | 1,705 | 243 | 2,120 | 105 | 2,026 | 105 | 8,268 | | 2. Private ltd. companies | 226 | 6,856 | 213 | 7,775 | 100 | 7,041 | 100 | 2,369 | | Total (A+B) | 493 | 12,742 | 471 | 15,232 | 220 | 14,832 | 220 | 16,917 | | Source: RBI Supervisory Returns. |
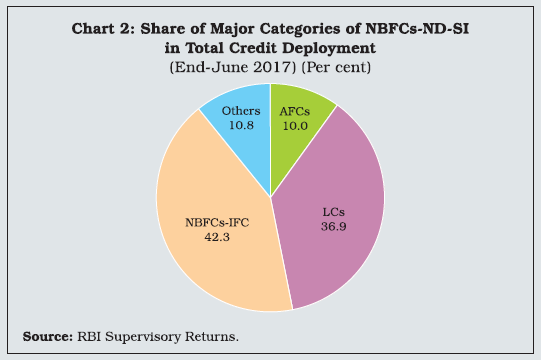
Box VII.1: Factors Influencing NBFCs’ Credit Growth Credit is considered as a vital ingredient in economic growth process. Levine, et al. (1998) found a strong positive link between financial development and economic growth. Empirical analysis also shows that a combination of stronger economic growth, loose monetary conditions and sound health of banking sector leads to higher credit growth while high inflation is detrimental to it (Guo and Stepanyan, 2011). In India, bank credit has decelerated sharply in recent years, while NBFCs’ credit continued in productive sectors such as infrastructure, retail loans and services sector. The share of NBFCs in total credit extended by banks and NBFCs together increased from 9.5 per cent in March 2008 to 15.5 per cent in March 2017. NBFCs credit intensity, i.e., credit as per cent of GDP, has also increased at a steady pace, reaching 8 per cent at end-March 2017. Against this backdrop, this box attempts an empirical examination of the factors influencing credit of NBFCs using descriptive anaysis and vector autoregression. Along with decline in bank credit growth in recent years due to asset quality concerns, the asset quality of NBFCs has also deteriorated mainly due to the changed asset classification norms (Chart 1). NBFCs’ credit to infrastructure sector, however, has shown a robust growth, especially credit by NBFCs-infrastructure finance companies (NBFCs-IFC). NBFCs-IFC have to deploy at least 75 per cent of their total assets in infrastructure loans and they constitute nearly two-fifth of credit extended by NBFCs-ND-SI. Similarly, NBFCs’ lending to retail and services segments have also increased significantly as reflected by the share of loan companies (LCs) and asset finance companies (AFCs), the main categories which lend to these sectors (Chart 2). In order to further examine the factors influencing the NBFCs’ credit, a vector autoregression (VAR) approach was adopted using quarterly data from June 2007 to June 2017 on GDP (non-agricultural, at factor cost), banks’ restructured assets, 91-days treasury bills rates and capacity utilisation (CU) of industrial sector. The GDP and credit series were deseasonalised and found to be first difference stationary, while CU was found to be stationary on the level. A dummy for financial crisis of 2008 was included as an exogenous variable. Lag of four quarters was found appropriate as per AIC lag length criterion. The impulse response mostly showed the expected direction of change in NBFCs’ credit in response to all the variables included in VAR. A one standard error increase in treasury bills rate initially leads to an increase in NBFCs’ credit, which declines subsequently. An increase in GDP and capacity utilisation generate positive shocks to NBFCs’ credit, which persist for seven quarters. A deterioration in asset quality of banks (increase in restructured assets) initially leads to an increase in NBFCs’ credit reflecting substitution impact whereby banks’ aversion to lend creates avenue for lending by NBFCs. Gradually, however, the banks’ asset quality concerns perhaps start affecting the overall economic environment, which leads to a decline in NBFCs’ credit. 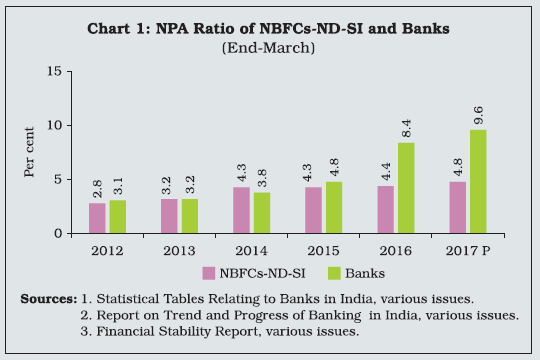
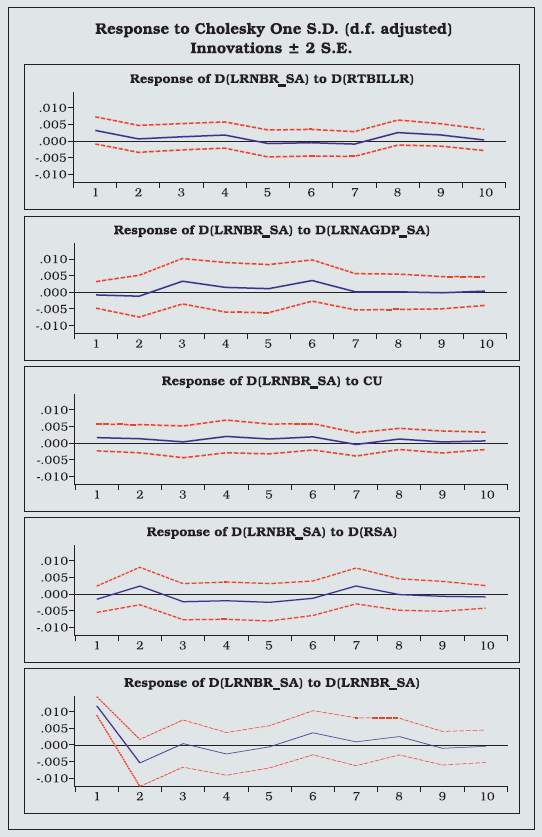 References: Guo K. and V. Stepanyan (2011), ‘Determinants of Bank Credit in Emerging Market Economies’, IMF Working Paper WP/11/51. Levine R. and S. Zervos (1998), ‘Stock Markets, Banks, and Economic Growth’, The American Economic Review, 88 (3): 537-558. |
Table VII.7: Consolidated Balance Sheet of NBFCs-ND-SI
(End-March) | | (Amount in ₹ billion) | | Items | 2014 | 2015 | 2016 | 2017 | Percentage variation | | 2015-16 | 2016-17 | | 1 | 2 | 3 | 4 | 5 | 6 | 7 | | 1. Share capital | 699 | 812 | 726 | 922 | -10.6 | 27.0 | | 2. Reserves and surplus | 2,469 | 2,818 | 2,699 | 3,124 | -4.2 | 15.7 | | 3. Borrowings | 8,916 | 10,853 | 10,661 | 11,917 | -1.8 | 11.8 | | 4. Current liabilities | 286 | 294 | 291 | 339 | -1.0 | 16.5 | | 5. Provisions | 371 | 455 | 455 | 615 | 0.0 | 35.2 | | Total liabilities/ assets | 12,742 | 15,232 | 14,832 | 16,917 | -2.6 | 14.1 | | 1. Loans and advances | 9,367 | 10,145 | 11,039 | 12,396 | 8.8 | 12.3 | | 2. Investments | 2,081 | 2,503 | 2,172 | 2,555 | -13.2 | 17.6 | | 3. Cash and bank balances | 382 | 535 | 485 | 698 | -9.3 | 43.9 | | 4. Other current assets | 730 | 1,850 | 952 | 1,020 | -48.5 | 7.1 | | 5. Other assets | 183 | 199 | 223 | 264 | 12.1 | 18.4 | | Source: RBI Supervisory Returns. | Resource Mobilisation VII.18 NBFCs-ND-SI increased resources raised through debentures and CPs while their borrowings from banks and government declined during the year (Table VII.9). Financial Performance VII.19 The net profits of NBFCs-ND-SI declined in 2016-17 due to increased expenditure and tax provisions (Table VII.10). Their cost-to-income ratio increased during the year. Soundness Indicators VII.20 Gross NPAs of NBFCs-ND-SI increased further during 2016-17, partly reflecting the progressive harmonisation of the NPA norms vis-à-vis banks. All categories of NBFCs-ND-SI, except AFCs, reported deterioration in asset quality with it being more pronounced in the case of NBFCs-MFI reflecting transient disruption in cash flows due to demonetisation (Chart VII.7A). Net NPAs broadly followed the pattern of gross NPAs (Chart VII.7B). Table VII.8: Major Components of Liabilities and Assets of NBFCs-ND-SI by Classification of NBFCs
(End-March) | | (Amount in ₹ billion) | | Category / Liability | 2016 | 2017 | Percentage variation of total liabilities | | Borrowings | Other liabilities | Total liabilities | Borrowings | Other liabilities | Total liabilities | | 1 | 2 | 3 | 4 | 5 | 6 | 7 | 8 | | Asset finance company | 1,189 | 380 | 1,569 | 1,167 | 410 | 1,576 | 0.4 | | IDF-NBFC | 49 | 17 | 67 | 98 | 22 | 120 | 79.1 | | NBFC-IFC | 4,593 | 973 | 5,566 | 4,668 | 1,157 | 5,825 | 4.7 | | Investment company | 1,025 | 1,029 | 2,054 | 1,039 | 1,154 | 2,193 | 6.8 | | NBFC-MFI | 413 | 156 | 569 | 400 | 204 | 604 | 6.2 | | Loan company | 3,402 | 1,605 | 5,007 | 4,545 | 2,053 | 6,598 | 31.8 | | Total | 10,671 | 4,160 | 14,832 | 11,917 | 5,000 | 16,917 | 14.1 | | Category / Asset | Loans & advances | Investments | Total assets | Loans & advances | Investments | Total assets | Percentage variation of total assets | | Asset finance company | 1,390 | 44 | 1,569 | 1,325 | 104 | 1,576 | 0.4 | | IDF-NBFC | 36 | 28 | 67 | 81 | 33 | 120 | 79.1 | | NBFC-IFC | 5,167 | 114 | 5,566 | 5,287 | 132 | 5,825 | 4.7 | | Investment company | 365 | 1,302 | 2,054 | 532 | 1,262 | 2,193 | 6.8 | | NBFC-MFI | 422 | 27 | 569 | 400 | 61 | 604 | 6.2 | | Loan company | 3,660 | 657 | 5,007 | 4,771 | 963 | 6,599 | 31.8 | | Total | 11,039 | 2,172 | 14,832 | 12,396 | 2,555 | 16,917 | 14.1 | | Source: RBI Supervisory Returns. | VII.21 The CRAR of NBFCs-ND-SI was well above the stipulated norm for the sector across all categories as of March 2017. The overall CRAR, however, showed a marginal decline from the previous year’s level with infrastructure debt fund – NBFCs (IDF-NBFCs), Investment Companies (ICs) and LCs having expanded their loan portfolios considerably during the year (Chart VII.8). Table VII.9: Sources of Borrowings of NBFCs-ND-SI
(End-March) | | (Amount in ₹ billion) | | Items | 2014 | 2015 | 2016 | 2017 | Percentage variation | | 2015-16 | 2016-17 | | 1 | 2 | 3 | 4 | 5 | 6 | 7 | | 1. Debentures | 4,212 | 5,287 | 4,855 | 5,795 | -8.2 | 19.4 | | 2. Bank borrowings | 2,377 | 2,541 | 2,716 | 2,527 | 6.9 | -7.0 | | 3. Borrowings from FIs | 145 | 144 | 159 | 263 | 10.4 | 65.4 | | 4. Inter-corporate borrowings | 253 | 279 | 356 | 404 | 27.6 | 13.5 | | 5. Commercial paper | 417 | 549 | 786 | 1,119 | 43.2 | 42.4 | | 6. Borrowings from government | 100 | 185 | 195 | 193 | 5.4 | -0.9 | | 7. Subordinated debts | 233 | 273 | 304 | 333 | 11.4 | 9.5 | | 8. Other borrowings | 1,178 | 1,593 | 1,299 | 1,283 | -18.5 | -1.2 | | 9. Total borrowings | 8,916 | 10,853 | 10,671 | 11,917 | -1.7 | 11.7 | | Source: RBI Supervisory Returns. |
| Table VII.10: Financial Performance of NBFCs-ND-SI | | (Amount in ₹ billion) | | Items | 2013-14 | 2014-15 | 2015-16 | 2016-17 | | 1 | 2 | 3 | 4 | 5 | | A. Income (i+ii) | 1,443 | 1,702 | 1,785 | 1,909 | | (i) Fund-based | 1,409 | 1,662 | 1,736 | 1,847 | | (ii) Fee-based | 34 | 40 | 49 | 61 | | B. Expenditure (i+ii+iii) | 1,071 | 1,257 | 1,343 | 1,498 | | (i) Financial | 775 | 900 | 913 | 958 | | Of which | | | | | | Interest payment | 327 | 374 | 387 | 441 | | (ii) Operating | 155 | 182 | 232 | 280 | | (iii) Others | 142 | 175 | 199 | 260 | | C. Tax provisions | 101 | 128 | 124 | 147 | | D. Operating profit | 371 | 446 | 441 | 410 | | E. Net profit | 270 | 318 | 318 | 263 | | F. Total assets | 12,742 | 15,232 | 14,832 | 16,917 | | G. Financial ratios (as per cent to total assets) | | | | | | (i) Income | 11.3 | 11.2 | 12.0 | 11.3 | | (ii) Fund income | 11.1 | 10.9 | 11.7 | 10.9 | | (iii) Fee income | 0.3 | 0.3 | 0.3 | 0.4 | | (iv) Expenditure | 8.4 | 8.3 | 9.1 | 8.9 | | (v) Financial expenditure | 6.1 | 5.9 | 6.2 | 5.7 | | (vi) Operating expenditure | 1.2 | 1.2 | 1.6 | 1.7 | | (vii) Tax provision | 0.8 | 0.8 | 0.8 | 0.9 | | (viii) Net profit | 2.1 | 2.1 | 2.1 | 1.6 | | H. Cost to income ratio | 74.3 | 77.8 | 75.3 | 78.5 | | Source: RBI Supervisory Returns. |
Banks’ Exposure to NBFCs-ND-SI VII.22 Borrowings from banks accounted for 21 per cent of NBFCs-ND-SI borrowings. Group-wise, new private banks emerged as the largest lender to NBFCs-ND-SI replacing nationalised banks. NBFCs-ND-SI borrow from banks primarily in the form of term loans and debentures. Traditional lenders, nationalised banks, largely lent in the form of term loans, while new private banks lent through debentures indicating their expectations of capital gains in the monetary easing phase (Table VII.11).
Table VII.11: Bank Exposure to NBFCs-ND-SI Sector
(End-March 2017) | | (₹ billion) | | Bank group | Term loans | Working capital loans | Debentures | Commercial paper | Others | Total | | 1 | 2 | 3 | 4 | 5 | 6 | 7 | | A. Nationalised banks | 936 | 10 | 415 | 157 | 147 | 1,665 | | B. The State Bank Group | 330 | 521 | 3 | 179 | 1 | 1,034 | | C. Old private banks | 281 | 31 | 2 | 0 | 0 | 313 | | D. New private banks | 447 | 103 | 954 | 204 | 106 | 1,814 | | E. Foreign banks | 67 | 3 | 6 | 92 | 3 | 170 | | All banks | 2,060 | 668 | 1,381 | 631 | 257 | 4,996 | | Source: RBI Supervisory Returns. |
Table VII.12: Ownership Pattern of NBFCs-D
(End-March) | | (Amount in ₹ billion) | | Type | 2014 | 2015 | 2016 | 2017 P | | Number | Asset size | Number | Asset size | Number | Asset size | Number | Asset size | | 1 | 2 | 3 | 4 | 5 | 6 | 7 | 8 | 9 | | A. Government companies | 5 | 251 | 5 | 271 | 5 | 285 | 2 | 273 | | B. Non-government companies (1+2) | 210 | 1,506 | 195 | 1,781 | 169 | 2,114 | 123 | 2,482 | | 1. Public ltd. companies | 5 | 1 | 4 | 0.2 | 3 | 0.2 | 2 | 0.2 | | 2. Private ltd. companies | 205 | 1,505 | 191 | 1,781 | 166 | 2,114 | 121 | 2,482 | | Total (A+B) | 215 | 1,757 | 200 | 2,052 | 174 | 2,399 | 125 | 2,755 | P: Provisional.
Source: RBI Supervisory Returns. | Deposit-taking NBFCs VII.23 NBFCs-D accounted for 14.0 per cent of total assets and 16.2 per cent of the total credit deployed by NBFCs at the end of March 2017. NBFCs-D are allowed to accept fixed deposits from the public for a tenure of 12 to 60 months. Deposits constituted 11.1 per cent of NBFCs-D funds as of end-March 2017; however, borrowings (debentures, bank borrowings and CPs) remained the largest source of funds with a share of 66.7 per cent in total funds. The assets of non-government-owned NBFCs increased in 2016-17 while those of government-owned NBFCs contracted (Table VII.12). Balance Sheet VII.24 The consolidated balance sheet of NBFCs-D expanded in 2016-17 on the back of robust credit growth as well as strong investments as NBFCs searched for yields (Table VII.13). Credit was mainly extended to transport operators, consumer durables, and medium and large industries sectors. Among liabilities, the expansion was mainly in debentures, public deposits and CPs. There was a gradual decline in bank borrowings as NBFCs-D diversified their sources of funds in favour of market-based instruments. Debentures emerged as the largest source of funding for NBFCs-D. Category-wise Key Indicators of NBFCs-D VII.25 There are three categories of NBFCs-D – AFCs, LCs and ICs, the last one being negligible in terms of balance sheet size. Category-wise, deposits of AFCs shrank during the year reflecting both a decline in the number of companies under this category as well as a reduction in the limit for acceptance of deposits for rated AFCs from 4 times to 1.5 times of NOF as part of harmonisation of limits across all NBFC-D. The growth in LCs’ deposits decelerated to 22.2 per cent in 2016-17 while borrowings increased at a faster pace to finance credit. In terms of assets, credit constituting 87.3 per cent of total assets showed strong growth, albeit some deceleration was seen over the previous year (Table VII.14). Table VII.13: Consolidated Balance Sheet of NBFCs-D
(End-March) | | (Amount in ₹ billion) | | Items | 2016 | 2017 | Percentage variation | | 1 | 2 | 3 | 4 | | 1. Share capital | 35 | 33 | -5.7 | | 2. Reserves and surplus | 343 | 380 | 10.8 | | 3. Public deposits | 271 | 306 | 12.9 | | 4. Debentures | 539 | 668 | 23.9 | | 5. Bank borrowings | 660 | 614 | -7.0 | | 6. Borrowings from FIs | 23 | 31 | 34.8 | | 7. Inter-corporate borrowings | 6 | 14 | 133.8 | | 8. Commercial paper | 66 | 148 | 124.4 | | 9. Borrowings from government | 30 | 0 | -100.0 | | 10. Subordinated debts | 88 | 119 | 35.2 | | 11. Other borrowings | 179 | 246 | 37.4 | | 12. Current liabilities | 79 | 95 | 20.3 | | 13. Provisions | 79 | 103 | 30.4 | | Total liabilities/assets | 2,399 | 2,755 | 14.8 | | 1. Loans and advances | 2,073 | 2,405 | 16.0 | | 2. Hire purchase and lease assets | 45 | 44 | -2.2 | | 3. Investments | 92 | 125 | 35.9 | | 4. Cash and bank balances | 100 | 88 | -12.0 | | 5. Other assets | 90 | 92 | 2.2 | P: Provisional.
Source: RBI Supervisory Returns. |
Table VII.14: Major Components of Liabilities and Assets of NBFCs-D by Classification of NBFCs
(End-March) | | (Amount in ₹ billion) | | Items | Asset finance companies | Loan companies | Total | | 2014 | 2015 | 2016 | 2017 P | 2014 | 2015 | 2016 | 2017 P | 2014 | 2015 | 2016 | 2017 P | | 1 | 2 | 3 | 4 | 5 | 6 | 7 | 8 | 9 | 10 | 11 | 12 | 13 | | No. of companies | 166 | 159 | 137 | 90 | 49 | 41 | 37 | 25 | 215 | 200 | 174 | 115 | | Deposits | 24 | 60 | 68 | 58 | 107 | 145 | 203 | 248 | 131 | 205 | 271 | 306 | | Borrowings | 759 | 841 | 932 | 1,059 | 464 | 536 | 660 | 780 | 1,223 | 1,378 | 1,592 | 1,838 | | Total liabilities / assets | 1,020 | 1,172 | 1,313 | 1,471 | 714 | 847 | 1,077 | 1,283 | 1,734 | 2,019 | 2,390 | 2,754 | | Total advances | 796 | 961 | 1,136 | 1,256 | 576 | 720 | 938 | 1,149 | 1,372 | 1,681 | 2,073 | 2,405 | | Investments | 52 | 59 | 49 | 56 | 18 | 25 | 36 | 69 | 70 | 85 | 86 | 125 | P: Provisional.
Note: Excluding investment companies.
Source: RBI Supervisory Returns. | NBFCs-D Deposits VII.26 The Reserve Bank has not issued any new CoR for NBFC-D since 1997. It has also mandated a minimum investment grade rating for NBFCs-D from March 2016 to ensure that only sound and well-managed entities can accept public deposits. Consequently, the number of NBFCs-D declined with many of them converting to non-deposit taking NBFCs. As a result, their deposit growth decelerated from 32.2 per cent in 2015-16 to 12.9 per cent in 2016-17 (Chart VII.9A). Accordingly, the ratio of NBFCs’ public deposits to aggregate deposits of scheduled commercial banks (SCBs) declined marginally in 2016-17, after witnessing increases in the previous three years (Chart VII.9B). Financial Performance VII.27 NBFCs-D income increased by 12.3 per cent in 2016-17 whereas their expenditure grew at a higher pace of 13.7 per cent on account of both operating expenses and interest payments. As a result, the growth in the net profits of NBFCs-D moderated during the year (Chart VII.10). VII.28 The cost to income ratio of NBFCs-D has been rising from 2013-14, reflecting a decline in operational efficiency. Their RoA has also declined in recent years in the wake of slowdown in revenue growth in a competitive lending rate environment, coupled with downward trend in interest rates (Table VII.15). Soundness Indicators VII.29 GNPAs of NBFCs-D have shown a rising trend since 2010-11, reflecting a combination of factors including the slowdown in economic activity and sector-specific developments such as deterioration of asset quality with respect to transport operators and construction sectors. The recent increase may partly be attributed to the progressive harmonisation of NPA norms vis-à-vis banks (Chart VII.11).
Table VII.15: Financial Ratios of NBFCs-D
(End-March) | | (Per cent to total assets)# | | Items | 2014 | 2015 | 2016 | 2017 P | | 1 | 2 | 3 | 4 | 5 | | 1. Income | 15.4 | 14.9 | 14.9 | 14.6 | | 2. Fund income | 15.3 | 14.8 | 14.7 | 14.4 | | 3. Fee income | 0.1 | 0.2 | 0.1 | 0.1 | | 4. Expenditure | 11.8 | 11.6 | 11.9 | 11.8 | | 5. Financial expenditure | 7.5 | 7.2 | 6.9 | 6.7 | | 6. Operating expenditure | 3.2 | 3.1 | 3.3 | 3.3 | | 7. Tax provision | 1.1 | 1.0 | 0.9 | 1.0 | | 8. Net profit | 2.5 | 2.3 | 2.0 | 1.8 | | 9. Return on assets | 2.5 | 2.3 | 2.1 | 1.9 | | 10. Cost to income ratio | 76.6 | 77.9 | 79.8 | 80.7 | P: Provisional.
#: For items 1 to 9.
Note: Numbers may not add up due to rounding-off.
Source: RBI Supervisory Returns. | VII.30 Accretion to NPAs was reported under commercial vehicle and tractor loans. Category-wise, the deterioration was more pronounced in respect of AFCs, which have the maximum exposure to vehicle and tractor loans (Chart VII.12). VII.31 The CRAR of NBFCs-D has been declining since 2013-14 with the expansion of their credit portfolios as well as deterioration in asset quality (Chart VII.13). Nevertheless, the CRAR of NBFCs-D was comfortably above the stipulated norm of 15 per cent. Residuary Non-Banking Companies VII.32 The principal business of Residuary Non-Banking Companies (RNBCs) is collecting deposits and deploying them as specified by the Reserve Bank. As of March 2015, only two RNBCs were registered with the Reserve Bank. In September 2015, the registration of Sahara India Financial Corporation Limited was cancelled. Both the RNBCs have stopped accepting deposits and are in the process of repaying old deposits. VII.33 Overall, the NBFC sector’s balance sheet expanded on strong credit growth as it filled the financing gap due to a slowdown in bank credit. Credit to commercial real estate, micro and small-scale enterprises, and consumer durables increased significantly during the year. Deposit mobilisation decelerated in response to regulatory initiatives. There was some deterioration in asset quality, which was mainly due to harmonisation of regulations vis-à-vis the banking system and the transitory impact of demonetisation. NBFCs’ capital position remained above the regulatory minimum in 2016-17 although there was a modest depletion relative to a year ago on account of enhanced provisions for asset impairment. III. Payments Banks VII.34 Payments banks (PBs) were set up in India on the recommendations of the Committee on Comprehensive Financial Services for Small Businesses and Low Income Households (Chairman: Shri Nachiket Mor, 2014) with the aim of expanding financial inclusion by providing (i) small savings accounts, and (ii) payments/ remittance services using the digital medium to to migrant labour, small businesses, low income households and other entities in the unorganised sector. PBs are allowed to accept demand deposits up to ₹ one lakh per customer; they are prohibited from issuing credit cards or accepting deposits from non-resident Indians or undertaking lending activities. These banks are covered by deposit insurance from the Deposit Insurance and Credit Guarantee Corporation (DICGC). | Table VII.16: Brief Profile of Payments Banks | | Stage | Airtel PB | India Post PB | Paytm PB | Fino PB | Aditya Birla Idea PB | NSDL PB | Jio PB | | 1 | 2 | 3 | 4 | 5 | 6 | 7 | 8 | | Date of issuing license | 11-04-2016 | 20-01-2017 | 03-01-2017 | 30-03-2017 | 03-04-2017 | 30-03-2017 | 27-01-2017 | | Date of start of operations | 23-11-2016 | 30-01-2017 | 23-05-2017 | 30-06-2017 | Yet to start operations | | Source: RBI. | VII.35 The Reserve Bank began issuing PB licenses in 2015-16. So far, seven licenses have been issued out of which two banks – Airtel Payments Bank and India Post Payments Bank – had commenced operations before March 31, 2017 and two others – Paytm and Fino – had started operations by the quarter ending-June 2017 (Table VII.16). Balance Sheet VII.36 At end-March 2017, the capital and reserves of the two PBs in operation were the major liabilities with their deposits being only 5.7 per cent. Balances with banks and money at call / short notice constituted two-third of their assets while investments constituted the remaining one-third. The asset composition reflects the nature of their operations as they are not permitted to undertake lending activities (Chart VII.14). Financial Performance VII.37 PBs’ profit after tax and earning before provisions and taxes (EBPT) were negative in 2016-17 mainly due to large expenses on creating new infrastructure in the initial stages of their operations (Table VII.17). VII.38 The impact of the starting-up expenditure was reflected in the negative readings of RoA and RoE, notwithstanding a positive net interest margin (Table VII.18). VII.39 A more realistic assessment of PBs’ financial and operational performance will be possible once more data are available and as these banks expand their operations. Table VII.17: Select Financial Parameters of Payments Banks
(End-March 2017) | | (₹ million) | | Items | Amount | | 1 | 2 | | 1. Interest income | 314 | | 2. Interest expenses | 7 | | 3. Net interest income (1-2) | 307 | | 4. Non-interest income | 1,086 | | 5. Operating expenses | 3,800 | | 6. Earnings before provisions and taxes (3+4-5) | -2,407 | | 7. Risk provisions | 4 | | 8. Tax provisions | 11 | | 9. Profit after tax (6-7-8) | -2,422 | | Source: RBI Supervisory Returns. |
Table VII.18: Select Financial Ratios of Payments Banks
(End-March 2017) | | (Per cent) | | Items | Return on assets | Return on equity | Investments to total assets | Net interest margin | Efficiency (cost income ratio) | Operating profit to working funds | Profit margin | | 1 | 2 | 3 | 4 | 5 | 6 | 7 | 8 | | Ratios | -25.2 | -36.4 | 29.2 | 2.8 | 272.7 | -25.1 | -172.9 | | Source: RBI Supervisory Returns. | IV. All India Financial Institutions VII.40 There are three broad categories of non-bank financial institutions: First, term-lending institutions such as the Export Import Bank of India (EXIM Bank) that engage in direct lending by way of term loans and investments. Second, institutions such as the National Bank for Agriculture and Rural Development (NABARD), the Small Industries Development Bank of India (SIDBI) and the National Housing Bank (NHB), which mainly extend refinance to banks and NBFIs. Third, investment institutions such as the Life Insurance Corporation of India (LIC), which deploy their funds largely in marketable securities. State/regional level institutions are another distinct group and comprise State Financial Corporations (SFCs), State Industrial and Development Corporations (SIDCs) and North-Eastern Development Finance Corporation Ltd. (NEDFi). VII.41 Four AIFIs viz., the EXIM Bank, the NABARD, the NHB and the SIDBI, are under the oversight of the Reserve Bank (Table VII.19). AIFIs’3 Operations VII.42 Financial assistance sanctioned by AIFIs during 2016-17 increased by 15.7 per cent whereas their disbursement growth was moderate at 7.7 per cent amidst sluggish demand conditions. Notably, disbursements by the SIDBI contracted during the year indicating moderation in industrial activity while those by the EXIM Bank declined due to deleveraging in view of bad assets and provisioning requirements. The increase in disbursements by the NABARD and the NHB reflects resilience in the agriculture and housing sectors (Table VII.20) (Appendix Table VII.2). Table VII.19: Ownership Pattern of AIFIs
(End-March 2017) | | (Per cent) | | Institution | Owner | Ownership share | | 1 | 2 | 3 | | EXIM Bank | Government of India | 100.0 | | NABARD | Government of India | 99.6 | | | Reserve Bank of India | 0.4 | | NHB | Reserve Bank of India | 100.0 | | SIDBI * | Public Sector Banks | 61.6 | | | Insurance Companies | 18.5 | | | Financial Institutions | 4.5 | | | Others | 15.4 | | *: State Bank of India (16.7 per cent), IDBI Bank Ltd. (16.3 per cent) and Government of India (15.4 per cent) are SIDBI’s three major shareholders. |
| Table VII.20: Financial Assistance Sanctioned and Disbursed by AIFIs | | (₹ billion) | | Category | 2015-16 | 2016-17 P | | S | D | S | D | | 1 | 2 | 3 | 4 | 5 | | SIDBI | 561 | 559 | 406 | 395 | | NABARD | 1,695 | 1,582 | 2,401 | 1,977 | | NHB | 357 | 219 | 379 | 234 | | EXIM Bank | 753 | 552 | 709 | 531 | | Total | 3,366 | 2,912 | 3,895 | 3,137 | P: Provisional; S: Sanction; D: Disbursement
Source: Respective financial institutions. | Balance sheet VII.43 AIFIs’ consolidated balance sheet expanded during 2016-17 on the back of loans and advances, which constituted the largest share of assets (Table VII.21). Investments contracted in contrast, with the NHB showing a significant decline due to redemption of treasury bills (T-bills) in June 2017. Notably, AIFIs’ cash and bank balances at the close of 2016-17 were 30 per cent lower than a year ago as they did not renew their fixed deposits with banks that matured towards the end of the year and instead used them for normal business activities. Growth in deposit mobilisation was moderate leading to a decline in their share in total liabilities over the year. On the other hand, resources raised through borrowings expanded sizeably during the year. VII.44 The resources mobilised by the AIFIs picked up during 2016-17 resulting in the utilisation of about 83 per cent of their ‘umbrella limit’ for raising resources from the money market as compared to 71 per cent a year ago. Mobilisation through CPs increased significantly, reflecting competitive interest rates on these instruments (Table VII.22). | Table VII.21: AIFIs’ Balance sheet | | (Amount in ₹ billion) | | Items | 2015-16 | 2016-17 | Percentage variation | | 1 | 2 | 3 | 4 | | Liabilities | | | | | 1. Capital | 136 | 155 | 14.0 | | | (2.4) | (2.6) | | | 2. Reserves | 435 | 490 | 12.6 | | | (7.8) | (8.1) | | | 3. Bonds and debentures | 1,386 | 1,472 | 6.2 | | | (24.7) | (24.4) | | | 4. Deposits | 2,387 | 2,467 | 3.4 | | | (42.5) | (40.9) | | | 5. Borrowings | 741 | 898 | 21.2 | | | (13.2) | (14.9) | | | 6. Other liabilities | 528 | 552 | 4.5 | | | (9.4) | (9.1) | | | Total liabilities/assets | 5,613 | 6,034 | 7.5 | | Assets | | | | | 1. Cash and bank balances | 273 | 193 | -29.3 | | | (4.9) | (3.2) | | | 2. Investments | 422 | 408 | -3.3 | | | (7.5) | (6.8) | | | 3. Loans and advances | 4,762 | 5,283 | 10.9 | | | (84.8) | (87.6) | | | 4. Other assets | 157 | 150 | -4.5 | | | (2.8) | (2.5) | | Note: Figures in parentheses are percentages to total liabilities / assets.
Source: Audited OSMOS returns. | Sources and Uses of Funds VII.45 During the year, internal sources of funds increased with scaling up of operations as well as higher capital and reserves. External sources, which include resources raised from the market and capital infusion from the government, increased marginally (Table VII.23). The deployment of resources during 2016-17 indicates a preference for investments followed by fresh deployment and repayment of past borrowings. The share of interest payments in the deployment of funds has declined in 2016-17. Maturity and Cost of Borrowings and Lending VII.46 The weighted average cost (WAC) of rupee resources raised by AIFIs declined in 2016-17 for all AIFIs with faster transmission of monetary policy accommodation. The weighted average maturity (WAM) of rupee resources increased for the NHB and the EXIM Bank while it declined for the SIDBI and the NABARD. The EXIM Bank had the highest WAC of rupee resources while the NHB had the longest WAM (Table VII.24). Table VII.22: Resources Raised by AIFIs from the Money Market
(End-March)# | | (Amount in ₹ billion) | | Instrument | 2015-16 | 2016-17 | | 1 | 2 | 3 | | A. Total | 475 | 613 | | (i) Term deposits | 12 | 24 | | (ii) Term money | 15 | 22 | | (iii) Inter-corporate deposits | 0 | 0 | | (iv) Certificate of deposits | 139 | 125 | | (v) Commercial paper | 308 | 442 | | Memo: | | | | B. Umbrella limit | 672 | 742 | | C. Utilisation of umbrella limit (A as percentage of B) | 70.7 | 82.6 | #: End-June for NHB.
Note: AIFIs are allowed to mobilise resources within the overall ‘umbrella limit’, which is linked to the net owned funds (NOF) of the financial institution concerned as per its latest audited balance sheet. The umbrella limit is applicable for five instruments – term deposits, term money borrowings, certificates of deposits (CDs), commercial papers (CPs) and inter-corporate deposits.
Source: Respective financial institutions. |
| Table VII.23: Pattern of AIFIs’ Sources and Deployment of Funds | | (Amount in ₹ billion) | | Items | 2015-16 | 2016-17 | | 1 | 2 | 3 | | A. Sources of funds | | | | (i) Internal | 7,584 | 11,331 | | | (60.7) | (67.2) | | (ii) External | 3,146 | 4,374 | | | (25.2) | (26.0) | | (iii) Others* | 1,754 | 1,148 | | | (14.0) | (6.8) | | Total | 12,484 | 16,853 | | | (100) | (100) | | B. Deployment of funds | | | | (i) Fresh deployment | 2,706 | 3,175 | | | (21.7) | (18.8) | | (ii) Repayment of past borrowings | 2,125 | 2,217 | | | (17.0) | (13.2) | | (iii) Other deployment | 7,653 | 11,460 | | | (61.3) | (68.0) | | Of which, Interest payments | 253 | 296 | | | (2.0) | (1.8) | | Total | 12,484 | 16,853 | | | (100) | (100) | *: Includes cash and balances with banks and the Reserve Bank of India.
Note: Figures in parentheses are percentages to total.
Source: Respective financial institutions. | VII.47 The long-term prime lending rate (PLR) of all AIFIs declined in 2016-17 reflecting a reduction in the cost of funds for the borrowers. The SIDBI and the NHB had the highest and the lowest PLRs, respectively (Chart VII.15). | Table VII.24: Weighted Average Cost and Maturity of Rupee Resources Raised by AIFIs | | Institution | Weighted average cost
(Per cent) | Weighted average maturity
(Years) | | 2015-16 | 2016-17 | 2015-16 | 2016-17 | | 1 | 2 | 3 | 4 | 5 | | 1. SIDBI | 7.55 | 6.54 | 1.13 | 0.51 | | 2. NABARD | 8.41 | 7.89 | 2.27 | 1.78 | | 3. NHB | 6.32 | 6.17 | 4.10 | 4.62 | | 4. EXIM Bank | 8.69 | 8.12 | 3.33 | 3.55 | | Source: Respective financial institutions. |
Financial Performance VII.48 AIFIs posted a modest growth in income during the year, partly reflecting the impact of declining interest rates, lower bank balances and subdued activity under bill discounting / rediscounting. Non-interest income showed strong growth (Table VII.25). | Table VII.25: Financial Performance of Select AIFIs | | (Amount in ₹ billion) | | Item | 2015-16 | 2016-17 | Variation | | Amount | Per cent | | 1 | 2 | 3 | 4 | 5 | | A. Income | 395 | 424 | 29 | 7.3 | | (a) Interest income | 386 | 409 | 23 | 6.0 | | | (97.6) | (96.5) | | | | (b) Non-interest income | 9 | 15 | 6 | 66.7 | | | (2.4) | (3.5) | | | | B. Expenditure | 301 | 326 | 25 | 8.3 | | (a) Interest expenditure | 279 | 298 | 19 | 6.8 | | | (92.6) | (91.3) | | | | (b) Operating expenses | 22 | 28 | 6 | 27.3 | | | (7.3) | (8.7) | | | | Of which, Wage bill | 15 | 21 | 6 | 40.0 | | C. Provisions for taxation | 22 | 26 | 4 | 18.2 | | D. Profit | | | | | | Operating profit | 70 | 73 | 3 | 4.3 | | Net profit | 48 | 47 | -1 | -2.1 | Note: Figures in parentheses are percentages to total income/expenditure.
Source: Audited OSMOS returns. |
| Table VII.26: AIFIs’ Financial Ratios | | (Per cent) | | Financial Ratios* | 2015-16 | 2016-17 | | 1 | 2 | 3 | | 1. Operating profit | 1.3 | 1.7 | | 2. Net profit | 0.9 | 0.8 | | 3. Income | 7.5 | 7.4 | | 4. Interest income | 7.3 | 7.1 | | 5. Other income | 0.1 | 0.3 | | 6. Expenditure | 5.7 | 5.7 | | 7. Interest expenditure | 5.3 | 5.2 | | 8. Other operating expenses | 0.4 | 0.5 | | 9. Wage bill | 0.3 | 0.4 | | 10. Provisions | 0.5 | 0.4 | *:- As percentage of total average assets.
Source: Respective financial institutions. | VII.49 Although the operating profit ratio improved, relatively higher growth in the wage bill moderated net profits (Table VII.26). VII.50 Net profit per employee declined across AIFIs in 2016-17 except for NABARD where it remained unchanged. The SIDBI registered the highest net profit per employee while the EXIM Bank reported the lowest (Table VII.27). Barring the NHB, the ratio of operating profits to average working funds of AIFIs declined, indicating loss of efficiency in the use of working capital. As a result, AIFIs reported lower RoA during 2016-17; it was the highest for SIDBI and the lowest for EXIM Bank (Chart VII.16). | Table VII.27: AIFIs’ Select Financial Parameters | | Institution | Interest income/ average working funds (Per cent) | Non-interest income/ average working funds (Per cent) | Operating profit/ average working funds (Per cent) | Net profit per employee
(₹ million) | | 2015-16 | 2016-17 | 2015-16 | 2016-17 | 2015-16 | 2016-17 | 2015-16 | 2016-17 | | 1 | 2 | 3 | 4 | 5 | 6 | 7 | 8 | 9 | | EXIM | 7.8 | 7.3 | 0.5 | 0.7 | 2.4 | 2.1 | 9.7 | 1.2 | | NABARD | 6.9 | 6.8 | 0.1 | 0.1 | 1.3 | 1.2 | 6.0 | 6.0 | | NHB | 7.8 | 7.4 | 0.1 | 0.4 | 2.4 | 2.6 | 7.5 | 7.2 | | SIDBI | 8.3 | 7.6 | 0.4 | 0.4 | 2.8 | 2.2 | 11.1 | 9.6 | | Source: Respective financial institutions. |
Soundness Indicators VII.51 The total amount of AIFIs’ net NPAs increased during 2016-17 on account of the EXIM Bank’s reduction in the provisioning coverage ratio (PCR) even as the other AIFIs’ net NPAs declined during the year (Table VII.28). VII.52 The share of AIFIs’ standard assets declined in 2016-17 again on account of the EXIM Bank (Table VII.29). | Table VII.28: AIFIs’ Net NPAs | | (Amount in ₹ billion) | | Institution | Net NPAs | Net NPAs / net loans
(Per cent) | | 2015-16 | 2016-17 | 2015-16 | 2016-17 | | 1 | 2 | 3 | 4 | 5 | | EXIM Bank | 8.5 | 48.0 | 0.9 | 4.7 | | NABARD | 0.2 | 0.0 | 0.01 | 0.00 | | NHB | 0.3 | 0.0 | 0.3 | 0.00 | | SIDBI | 4.8 | 3.0 | 0.7 | 0.4 | | All FIs | 14.1 | 51.0 | 0.3 | 1.0 | Note: Data relate to end-March for EXIM Bank, NABARD and SIDBI and end-June for NHB.
Source: Respective financial institutions. |
| Table VII.29: AIFIs’ Assets Classification | | (Per cent) | | Category | 2015-16 | 2016-17 | | 1 | 2 | 3 | | Standard | 98.9 | 98.0 | | Sub-standard | 0.4 | 0.8 | | Doubtful | 0.7 | 1.2 | | Loss | 0.0 | 0.0 | | Total | 100.0 | 100.0 | Note: Data relate to end-March for EXIM Bank, NABARD and SIDBI and end-June for NHB.
Source: Respective financial institutions. | VII.53 AIFIs reported a marginal improvement in CRAR at the aggregate level even as they exceeded the stipulated minimum of 9 per cent. Institution-wise, CRARs of EXIM Bank and NABARD improved over the year while they declined marginally for the others (Chart VII.17). V. Primary Dealers VII.54 As on March 31, 2017, there were 21 primary dealers (PDs) – 14 run by banks and 7 standalone PDs registered as NBFCs under Section 45 IA of the RBI Act, 1934. Operations and Performance of PDs VII.55 PDs have mandatory obligations to participate in underwriting and auctions of government dated securities. They are also mandated to achieve a minimum success ratio (bids accepted to the bidding commitment) of 40 per cent in primary auctions of T-bills and Cash Management Bills (CMBs), assessed on a half-yearly basis. VII.56 During 2016-17, the government auctioned dated securities of ₹5,820 billion, marginally lower than ₹5,850 billion during the previous year. PDs’ share of subscriptions in the primary issuance of dated securities declined during 2016-17. Partial devolvement took place on four instances for ₹53 billion during 2016-17 as against seven instances for ₹110 billion in 2015-16. The underwriting commission paid to PDs during 2016-17 was lower at ₹356.6 million as compared to ₹470.9 million in the previous year. Reflecting the lower devolvement during the year, the average rate of underwriting commission in 2016-17 declined on a year-on-year basis (Chart VII.18). 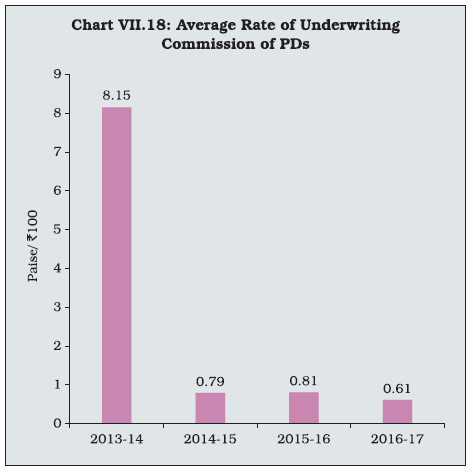 VII.57 With respect to auctions of T-bills and CMBs, all PDs achieved the stipulated minimum success ratio. PDs placed higher bids (in relation to their bidding commitments) in 2016-17; their share in subscription of T-Bills / CMBs issued during the year, however, declined marginally to 74 per cent from 75 per cent in the previous year (Table VII.30). VII.58 In the secondary market, all the 21 PDs individually achieved the required minimum annual total turnover (outright and repo transactions) ratio of 5 times in G-secs and 10 times in T-bills during 2016-17 and also the minimum annual outright turnover ratio of 3 times in G-secs and 6 times in T-bills. Performance of Standalone PDs VII.59 The secondary market volume of standalone primary dealers (SPDs) increased by 22.6 per cent in 2016-17 over 2015-16. Yet, their share in total market turnover declined over the year partly due to a reduction in government borrowings (Table VII.31). | Table VII.30: Performance of PDs in the Primary Market | | (Amount in ₹ billion) | | Items | 2013-14 | 2014-15 | 2015-16 | 2016-17 | | 1 | 2 | 3 | 4 | 5 | | Treasury bills and CMBs | | | | | | (a) Bidding commitment | 8,299 | 8,671 | 8,833 | 8,340 | | (b) Actual bids submitted | 17,994 | 19,512 | 25,020 | 32,365 | | (c) Bid to cover ratio | 2.6 | 2.7 | 3.5 | 3.9 | | (d) Bids accepted | 4,990 | 5,657 | 5,460 | 4,946 | | (e) Success ratio (d) / (a) (in Per cent) | 60.1 | 65.2 | 61.8 | 59.3 | | Central government dated securities | | | | | | (a) Notified amount | 5,570 | 5,920 | 5,850 | 5,820 | | (b) Actual bids submitted | 8,861 | 10,830 | 12,151 | 12,573 | | (c) Bid to cover ratio | 1.6 | 1.8 | 2.1 | 2.2 | | (d) Bids of PDs accepted | 2,576 | 3,012 | 3,148 | 2,763 | | (e) Share of PDs (d) / (a) (Per cent) | 46.3 | 50.9 | 53.8 | 47.5 | | Source: Returns filed by PDs. |
| Table VII.31: Performance of SPDs in the G-secs Secondary Market | | (Amount in ₹ billion) | | Items | 2013-14 | 2014-15 | 2015-16 | 2016-17 | | 1 | 2 | 3 | 4 | 5 | | Outright | | | | | | Turnover of SPDs | 31,914 | 37,943 | 33,021 | 52,365 | | Market turnover | 89,567 | 101,561 | 97,285 | 168,741 | | Share of SPDs (Per cent) | 35.6 | 37.4 | 33.9 | 31.0 | | Repo | | | | | | Turnover of SPDs | 19,744 | 28,198 | 39,558 | 36,586 | | Market turnover | 72,281 | 78,752 | 86,217 | 118,350 | | Share of SPDs (Per cent) | 27.3 | 35.8 | 45.9 | 30.9 | | Total (Outright + Repo) | | | | | | Turnover of SPDs | 51,658 | 66,141 | 72,579 | 88,951 | | Market turnover | 161,848 | 180,314 | 183,502 | 287,091 | | Share of SPDs (Per cent) | 31.9 | 36.7 | 39.5 | 31.0 | Notes: 1. Total turnover for market participants for outright and repo trades includes one side quantity that is, buy or sell.
2. Total turnover for standalone PDs for outright and repo trades includes both sides quantity that is, buy + sell.
3. In case of repo, only 1st leg is considered for SPDs’ turnover.
4. Market turnover includes standalone PDs turnover for both outright and repo volume.
Source: Clearing Corporation of India Ltd. | Sources and Application of SPDs’ Funds VII.60 Funds mobilised by SPDs shrank by about 18.5 per cent during 2016-17 mainly reflecting lower recourse to market repo. Nevertheless, borrowings remained the major source of their funding accounting for 83.7 per cent of the total sources of funds as compared to 88.1 per cent at the end of the previous year. Unsecured loans increased during the year reflecting higher access to call money market. The decline in funds mobilised is attributable to a contraction of current assets during 2016-17 owing to reduction in market borrowings by the government during the last quarter of the year (Table VII.32). SPDs’ Financial Performance VII.61 SPDs’ profit after tax improved significantly in 2016-17 on account of favourable yields, with all seven SPDs posting substantially higher profits than the previous year (Appendix Table VII.3). Their income rose due to a significant increase in trading profits while their expenditure posted a marginal decline (Table VII.33). | Table VII.32: Sources and Applications of SPDs’ Funds | | (Amount in ₹ billion) | | Items | 2013-14 | 2014-15 | 2015-16 | 2016-17 | Percentage variation | | 2015-16 over 2014-15 | 2016-17 over 2015-16 | | 1 | 2 | 3 | 4 | 5 | 6 | 7 | | Sources of Funds | | | | | | | | 1. Capital | 16 | 15 | 15 | 15 | 0.0 | 0.0 | | 2. Reserves and surplus | 28 | 30 | 31 | 36 | 3.3 | 16.1 | | 3. Loans (a+b) | 196 | 285 | 338 | 261 | 18.6 | -22.8 | | (a) Secured | 149 | 231 | 248 | 154 | 7.4 | -37.9 | | (b) Unsecured | 47 | 54 | 90 | 107 | 66.7 | 18.9 | | Total | 239 | 330 | 383 | 312 | 16.1 | -18.5 | | Application of Funds | | | | | | | | 1. Fixed assets | 0.3 | 0.3 | 0.3 | 0.4 | 0.0 | 33.3 | | 2. HTM investments (a+b) | 26 | 14 | 20 | 15 | 42.9 | -25.0 | | (a) Government securities | 26 | 14 | 20 | 15 | 42.9 | -25.0 | | (b) Others | 0.03 | 0.03 | 0.02 | 0.02 | -33.3 | 0.0 | | 3. Current assets | 235 | 326 | 432 | 318 | 32.5 | -26.4 | | 4. Loans and advances | 5 | 8 | 8 | 10 | 0.0 | 25.0 | | 5. Current liabilities | -28 | -18 | -77 | -31 | 327.8 | -59.7 | | 6. Deferred tax | 0.08 | 0.08 | 0.03 | -0.31 | -62.5 | -1133.3 | | 7. Others | 0.00 | 0.00 | 0.00 | -0.06 | - | - | | Total | 239 | 330 | 383 | 312 | 16.1 | -18.5 | | Source: Returns submitted by PDs. | VII.62 In line with the increase in PAT, SPDs’ return on net worth increased in 2016-17. Reflecting improvement in operational efficiency, the cost-income ratio of these PDs also improved during the year (Table VII.34). VII.63 The combined CRAR of standalone PDs improved during 2016-17 and remained comfortably above the regulatory stipulation of 15 per cent (Chart VII.19) (Appendix table VII.4). | Table VII.33: Financial Performance of SPDs | | (Amount in ₹ billion) | | Items | 2013-14 | 2014-15 | 2015-16 | 2016-17 | Variation | | 2015-16 over 2014-15 | 2016-17 over 2015-16 | | Amount | Per cent | Amount | Per cent | | 1 | 2 | 3 | 4 | 5 | 6 | 7 | 8 | 9 | | A. Income (i to iii) | 28 | 32 | 30 | 42 | -2 | -6.3 | 12 | 40.0 | | (i) Interest and discount | 20 | 24 | 27 | 27 | 2 | 12.5 | 1 | 0.0 | | (ii) Trading profits | 6 | 8 | 3 | 14 | -5 | -62.5 | 11 | 366.7 | | (iii) Other income | 2 | 1 | 1 | 1 | 0 | 0.0 | 0 | 0.0 | | B. Expenses (i to ii) | 19 | 23 | 25 | 24 | 2 | 8.7 | 0 | -4.0 | | (i) Interest | 17 | 20 | 22 | 21 | 2 | 10.0 | -1 | -4.5 | | (ii) Other expenses including establishment and administrative costs | 2 | 3 | 3 | 3 | 0 | 0.0 | 0 | 0.0 | | C. Profit before tax | 4 | 9 | 5 | 18 | -4 | -44.4 | 13 | 260.0 | | D. Profit after tax | 6 | 6 | 3 | 12 | -3 | -50.0 | 8 | 300.0 | Note: Figures may not add up due to rounding-off.
Source: Returns submitted by PDs. |
| Table VII.34: SPDs’ Financial Indicators | | (Amount in ₹ billion) | | Indicator | 2013-14 | 2014-15 | 2015-16 | 2016-17 | | 1 | 2 | 3 | 4 | 5 | | (i) Net profit | 6 | 6 | 3 | 12 | | (ii) Average assets | 291 | 359 | 413 | 444 | | (iii) Return on average assets (Per cent) | 1.9 | 1.7 | 0.8 | 2.6 | | (iv) Return on net worth (Per cent) | 13.0 | 13.6 | 7.5 | 22.8 | | (v) Cost to income ratio | 22.7 | 21.5 | 33.3 | 16.3 |
VII.64 PDs’ share in the subscription of primary issuances of dated securities declined in 2016-17 due to lower devolvement and increased appetite from other market participants amidst reduction in government borrowings and lower bank credit off-take. The average underwriting commission paid to PDs during the year also declined. Though the share of SPDs declined in the total market turnover, their net profits improved considerably in 2016-17 on account of higher trading profits. VI. Recent Developments VII.65 This section discusses developments in the NBFI sector during April-September 2017.4 In view of the limited availability of data for this period, the discussion is focussed on select variables. NBFCs Sector VII.66 NBFCs’ consolidated balance sheet in the first half of 2017-18 expanded on the back of strong credit growth financed through higher borrowings (Table VII.35). VII.67 NBFCs’ credit growth during April-September 2017 was about seven percentage points higher than in the previous year on the back of retail and services sectors (Chart VII.20). VII.68 Disaggregation of credit extended by the NBFCs-ND-SI segment indicates a sharp growth in credit provided by LCs, followed by AFCs and ICs. LCs have relatively large exposure to commercial real estate, which saw a sharp increase in credit, signifying the revival of economic activity. NBFCs-IFC credit growth, on the other hand, remained subdued during the first half of 2017-18 amidst asset quality concerns in the sector. The share of retail and services sectors improved during the first half of 2017-18 (Chart VII.21). | Table VII.35: Abridged Balance Sheet of NBFCs | | (Amount in ₹ billion) | | Items | End-Sept. 2017 | Y-o-Y variation
(up to Sept.) | Financial year variation
(Apr-Sept.) | | 2016-17 | 2017-18 | 2016-17 | 2017-18 | | 1 | 2 | 3 | 4 | 5 | 6 | | 1. Borrowings | 14,739 | 5.1 | 4.9 | 12.8 | 4.9 | | 2. Loans and advances | 15,821 | 7.6 | 14.9 | 13.5 | 7.3 | | 3. Total assets/ liabilities | 20,631 | 7.8 | 6.5 | 13.9 | 4.6 | | Source: RBI Supervisory Returns. |
Lending rates of NBFCs-ND-SI VII.69 The weighted average lending rates (WALR) of NBFCs-ND-SI have been declining in line with the monetary easing cycle across all categories barring NBFCs-MFI which showed some uptick in the WALR (Table VII.36).
| Table VII.36: Weighted Average Lending Rates of Various Categories of NBFCs-ND-SI | | (Per cent) | | Categories | Dec-15 | Mar-16 | Jun-16 | Sep-16 | Dec-16 | Mar-17 | Jun-17 | Sep-17 | | 1 | 2 | 3 | 4 | 5 | 6 | 7 | 8 | 9 | | Infrastructure finance companies | 12.3 | 12.1 | 12.0 | 12.0 | 12.0 | 11.6 | 11.4 | 11.1 | | Loan companies | 14.3 | 13.9 | 14.7 | 14.3 | 14.1 | 13.9 | 13.1 | 11.5 | | Asset finance companies | 13.6 | 13.5 | 13.5 | 13.2 | 13.0 | 12.8 | 12.6 | 12.4 | | Investment companies | 11.9 | 13.5 | 12.6 | 11.6 | 11.4 | 12.4 | 11.5 | 10.2 | | NBFCs-MFI | 19.0 | 20.6 | 22.4 | 22.1 | 20.5 | 21.1 | 20.5 | 21.3 | | NBFCs-ND-SI | 13.6 | 13.2 | 14.1 | 13.7 | 13.4 | 13.2 | 11.9 | 11.6 | Note: Core Investment Companies, NBFCs-Factor and IDF-NBFCs have negligible share in credit deployment among NBFCs-ND-SI.
Source: RBI Supervisory Returns. | VII.70 NPAs of NBFCs-ND-SI, which recorded some deterioration in the quarter ending-June 2017, improved at end-September 2017 partly reflecting higher write-offs (Chart VII.22). Payments Banks VII.71 Among the payments banks, Airtel PB became the first payments bank in India to integrate the unified payments interface (UPI) on its digital platform. Jio Payments Bank, a joint venture of Reliance Industries Ltd. (RIL) and the State Bank of India (SBI), is expected to begin operations in December 2017. The government is working on expanding India Post payments bank’s branches for reaching out to rural people. These developments indicate the potential role of payments banks in promoting financial inclusion in the country. New categories of NBFCs engaged in P2P lending and account aggregation are expected to evolve over time (Box VII.2). 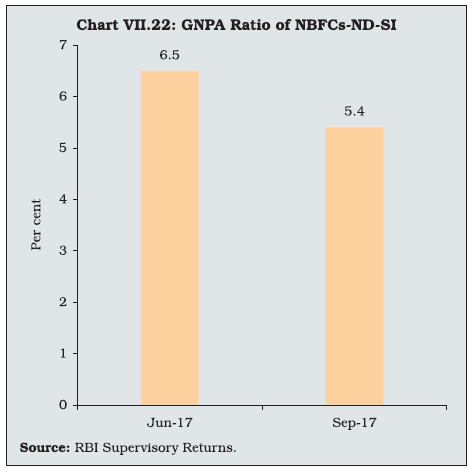
Box VII.2: Account Aggregator: A Cross-Country Analysis An account aggregator (AA) is an entity that retrieves or collects information related to a customer’s financial assets from the holders of such information and provides consolidated information to the customer or other users specified by the customer. In terms of the Reserve Bank’s guidelines issued in September 2016, NBFC-AAs are prohibited from undertaking any other business to support transactions by customers or from using the services of a third-party service provider for undertaking the business of account aggregation. AA’s utility was discussed in the Reserve Bank’s Annual Report, 2015–16 (p.73). Somewhat similar services are already being provided in India by some companies such as Perfios in the form of financial data aggregation based on the application programme interface (API). Account aggregation was started in 1999 in USA by Vertical One, which was subsequently merged with Yodlee. Business activity in this segment has been rising since then (ASIC, 2001 and Fujii, et al. 2002). In this context, it is interesting to note the variations in the regulatory frameworks prescribed and business models followed in different countries. The Consumer Financial Protection Bureau in the US released a set of consumer protection principles in October 2017 to ensure only consumer-authorised usage of financial data (CFPB, 2017). In Canada, financial institutions and independent companies provide aggregation service. Their activities are covered under different regulations and there is no specific regulation for the aggregation activity (Gentzoglanis, et al., 2014). In 2010, the Hong Kong Monetary Authority prescribed principles and risk management controls to be followed and put in place by institutions offering account aggregation services (HKMA, 2010). Broadly, two distinct aggregation techniques are used for account aggregation – screen scraping and direct data feed. In screen scraping, aggregator collects the information by using the consumer’s username and password shared by the customer himself with the account aggregator. Direct data feed, on the other hand, involves a tri-partite agreement among account aggregator, financial institution, and customer. The financial institution provides account information to the account aggregator in standardised format (ASIC, 2001). In the US, aggregators are usually operated by banks, banks’ agents, wealth managers and software companies such as Yodlee, Mint, and Simple. Aggregators allow customers to track their spending and saving patterns and manage bills and payments. The aggregators also analyse the financial data to make recommendations of new products and services to customers (CMA, 2016). In the UK, Citi Bank, Egg, and Money Supermarket started account aggregation services in the early 2000s. They provided information on banking, credit cards, investments, utilities, communication, travel, shopping and rewards. Initially, they used the screen scraping method but later shifted to direct data feed. In Canada, account aggregation services are provided by subsidiaries of foreign firms such as Mint as well as banks (Gentzoglanis, op. cit.). Mostly, they offer API-based account verification, account transactions (personal or business) and balance verification. Aggregation services in Japan developed around brokerage firms and the Nomura Research Institution and Monex started these services (application service implementation type) in 2001. In Hong Kong, account aggregation service is provided by authorised institutions only in co-operation with affiliated banking institution(s), which include overseas branches, local or overseas subsidiaries or the parent bank. Aggregators offer services such as balance enquiries, cross-fund transfers and securities trading activities (HKMA, 2010). Cross-country experience indicates variety in the services offered by AAs and points to the fact that financial viability of account aggregation on a stand-alone basis could be a challenge. The security and safety of consumers’ financial data are key concerns in the evolution of the regulatory regime and business models of account aggregators. India being a cost-sensitive market, the fee charged by account aggregators for their services will be crucial in their growth. Fast growing Fintech is expected to provide a vantage to AAs in India. Going forward, the scope of expanding permissible activities for account aggregators needs to be explored while ensuring the security of financial data. References: ASIC (2001), ‘Account Aggregation in the Financial Services Sector’, Consultation Paper 20, Australian Securities and Investment Commission, May. CFPB (2017), ‘Consumer Protection Principles: Consumer- Authorised Financial Data Sharing and Aggregation’ Consumer Financial Protection Bureau, US, October. CMA (2016), ‘Retail banking market investigation’ Final Report Competition and Markets Authority, UK, August. Fujii, H., T. Okano, S. Madnick and M. Siegel (2002), ‘E-Aggregation: The Present and Future of Online Financial Services in Asia-Pacific’, CISL Working Paper# 2002-06. Gentzoglanis, A and Avner Levin (2014), ‘Fraud and Privacy Violation Risks in the Financial Aggregation Industry: The Case of Regulation’, European Scientific Journal, Vol. 2, September. HKMA (2010), ‘Risk Management Controls over Internet Banking Account Aggregation Service’, Hong Kong Monetary Authority, July. | VII. Overall Assessment VII.72 The number of NBFCs has declined because of the regulatory initiatives aimed at protecting depositors’ interests and safeguarding financial stability. Nevertheless, the overall balance sheet size of NBFCs has expanded with their credit growth recording a higher reading in 2016-17 when bank credit witnessed historically low growth. More importantly, credit to the micro and small segments, both in industry and services sectors, displayed robust growth. Financial performance of these companies came under stress with a decline in profitability and deterioration in asset quality. Their capital positions also deteriorated during 2016-17 though they remained well above the stipulated norms. Their exposure to sensitive sectors such as capital markets and real estate at 13.4 per cent of their total assets as of March 2017 was marginally higher than the previous year. Notwithstanding a double-digit growth in public deposits mobilised by NBFCs, they remained well below 1 per cent of bank deposits. NBFCs took higher recourse to market-based instruments for resource mobilisation while reducing their dependence on bank borrowings. Conversion of a few large NBFCs-MFI into small finance banks may have implications for credit to the microfinance segment. VII.73 Primary dealers reported an increase in profits during the year due to favourable yields and higher trading profits. Payments banks reported negative profits due to high operational expenditures in the initial stage. Financial assistance sanctioned by AIFIs during 2016-17 increased by about 16 per cent while growth in disbursements was moderate at 7.7 per cent, a possible indication of demand conditions turning lacklustre during the year. NABARD and NHB disbursed significantly higher financial assistance supporting agriculture and housing sectors. VII.74 Regulations governing NBFCs are being increasingly harmonised with the banking sector while encouraging them to focus on specialised areas as evidenced by the recent notifications for setting up two new types of NBFCs by the Reserve Bank – Account Aggregator and Peer-to-Peer Lending Platform. Another recent regulatory development in the sector was the issuance of a comprehensive Information Technology Framework for NBFCs-ND to be adopted by June 30, 2018. VII.75 In the context of a regulatory regime for the sector, Financial Stability Board’s peer review of India has suggested that there is need for improving the sector’s risk assessment capacity and developing appropriate policy tools for non-banking financial entities (NBFEs) to ensure sustainable market-based finance and balance between promoting financial inclusion for supporting economic development with the consideration of financial stability risks. The review also suggested that the Reserve Bank may revisit the business criteria definition for NBFCs on a regular basis, review the merits of deposit-taking activities by non-financial firms, eliminate regulatory exemptions for government-owned NBFCs, rationalise the number of NBFC categories and continue harmonising NBFC prudential rules with those for banks. Also, there is a need to improve the timeliness and granularity of data collected from NBFEs, and enhancing its analysis. VII.76 The latest developments suggest a healthy growth in NBFCs’ credit during the first half of 2017-18 particularly in the retail and services sectors. A substantial improvement in credit to commercial real estate during the current year up to September portends well for economic activity. Available data also show improvements in NBFCs’ asset quality in the recent quarter pointing to the fading impact of demonetisation. The goods and services tax related adjustments may, however, need to be watched going forward.
|