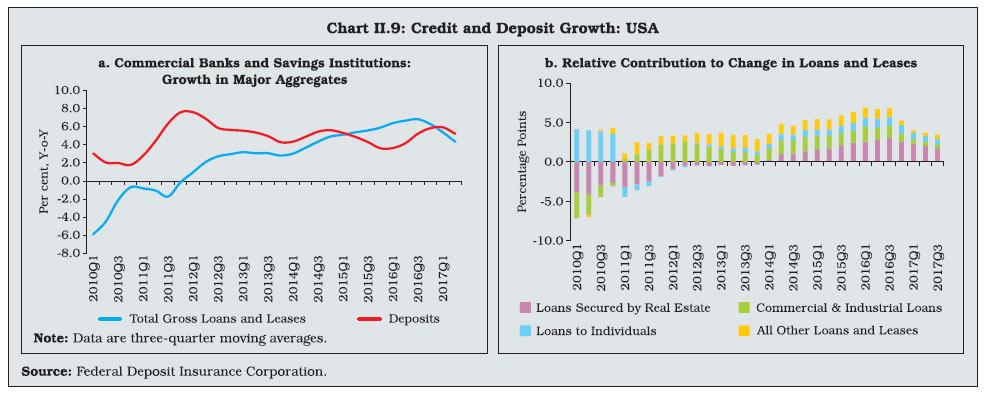
Global reforms have improved resilience of banking systems around the world even as concerns pertaining to bank profitability and asset quality remain. Bank balance sheet clean-up is still underway in some jurisdictions, while in others, banks are moving towards supporting growth. Performance of the 100 largest global banks was broadly the same in 2016 relative to the previous year. Considerable progress has been made on the global regulatory reform agenda, though it is still far from complete. I. Introduction II.1 In the wake of the global financial crisis (GFC), the European Sovereign Debt Crisis (ESDC) and right up to 2016, the persisting fragility of the banking system has engaged intense attention at national and multinational levels, remaining as it does a major downside risk to global growth. The massive retrenchment of bank lending, as these entities deleverage and buffer up is a major factor underlying the shrinking of global capital flows from the pre-crisis peak. In 2016, cross-border claims of Bank for International Settlements (BIS) reporting banks declined to 41.5 per cent of GDP from 42.3 per cent in 2015. Global credit conditions eased in early 2017 and international bank credit continued to grow in late 2016 and early 2017 but grew negatively in Q2: 2017. Credit to non-banks was the key driver of the growth in international bank claims. Currently, the global banking system is repairing and conforming to a new set of global rules. Though progress has been made in making banks safer, sounder and resilient, the global reform agenda is far from complete. II.2 Against this backdrop, Section II sets out the macroeconomic backdrop against which it analyses the performance of the global banking system in terms of key financial soundness indicators. Developments in the banking systems of some advanced economies (AEs) and emerging market economies (EMEs) are presented in Section III. The performance of the 100 largest global banks is examined in Section IV. Section V reviews the progress on the global reform agenda. Section VI gives the concluding observations and provides an outlook. II. The Macro-Financial Environment II.3 Global growth shed its sluggishness in the first half of 2016 and led by AEs it gradually gathered momentum in the second half. In the first three quarters of 2017, it gained traction and became broad-based healing commodity exporting large EMEs and lifting them out of recessionary conditions. Even as AEs and EMEs are recoupling their growth profiles, inflation conditions are converging below targets in AEs and softening in EMEs in conjunction with their unemployment rates. World trade has also picked up in line with the upturn in global activity. This has implications for EMEs seeking to harness the engine of world trade to integrate into the global economy and achieve their growth aspirations. General government debt levels in AEs remain elevated exceeding GDP while in EMEs they are less than half of GDP on average (Chart II.1). External imbalances have narrowed at the global level abstracting from noteworthy imbalances at the country level. Geo-political dynamics are likely to shape the emerging outlook alongside the spill overs from the normalisation of the monetary policy and the downsizing of balance sheets by systemic central banks. 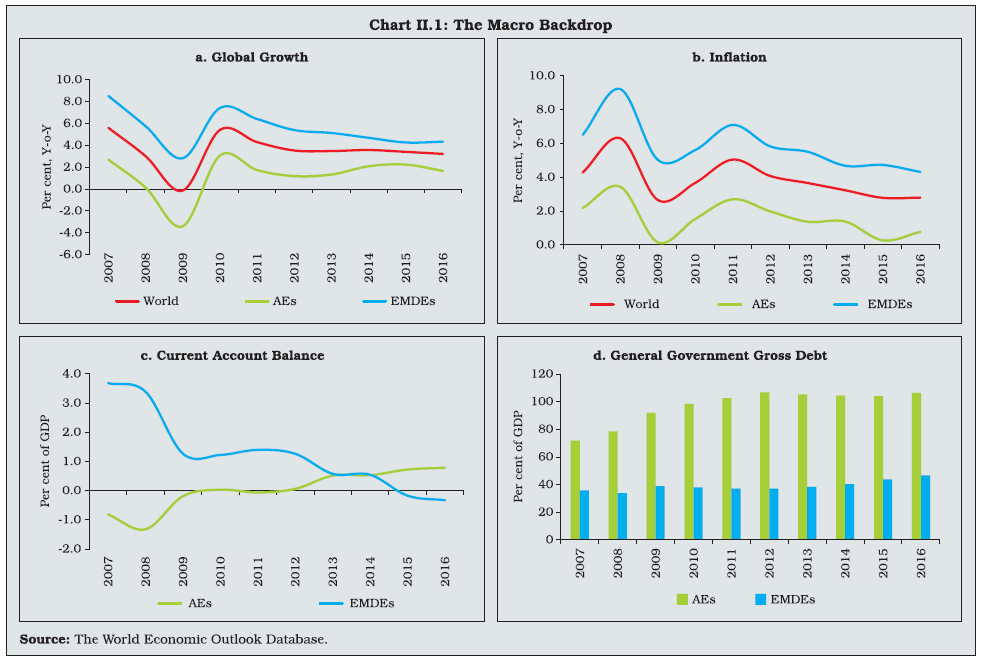 II.4 Bank credit, a key leading indicator of real activity1 in view of the close movement between real and financial cycles remains divergent across jurisdictions. In the Euro area, declining or low credit growth is exhibiting hysteresis. Even constituent countries, which engineered quick balance sheet clean-ups are experiencing some recent moderations after abrief credit rebound (Chart II.2). Country specific issues in EMEs have had a moderating impact on credit growth. While asset quality concerns restrained credit growth in Russia and India, low growth and dwindling demand from corporates pushed overall credit growth into the negative in Brazil. By contrast, China is still experiencing rapid growth in credit relative to its peers even with its economic activity moderating relative to the recent past. II.5 These dynamics in credit growth have influenced household debt, which continues to grow in some AEs and EMEs and ebb in others with China, UK, USA, India and Russia experiencing an increase in 2016 over 2015 (Chart II.3). Key Financial Soundness Indicators II.6 The banking systems in some jurisdictions are still in repair while in other jurisdictions banks are moving towards supporting growth even as they seek to increase capital and become profitable. A core set of indicators measuring profitability, asset quality and capital adequacy indicate the progress made over time and also summarise the current health of the banking systems.
Return on Assets II.7 With banking activity facing significant headwinds, banks’ return on assets (RoAs)2 remained subdued inhibiting their ability to expedite balance sheet repairs and augment capital buffers to insulate from stress in assets and in meeting the Basel III standards’ requirements. RoAs across banks in AEs have been improving since 2009 but they declined during 2016 reflecting country-level dynamics. Most strikingly, Greek banks registered positive RoAs after being in the red for two years largely due to a decrease in loan-loss provisions and an increase in net interest and non-interest incomes. RoAs of banks in Italy and Portugal turned negative in 2016 as revenues declined and asset impairments increased. RoAs of banks in the UK and USA remained stable but low largely due to moderation in operating income growth (Chart II.4). II.8 In EMEs, banks’ RoAs reflected a combination of elevated loan delinquencies, high credit costs and general lack of demand. These factors weighed on banks’ profitability in Brazil,China, India and Mexico. Banks in Russia, South Africa and Turkey improved their performance in 2016 over the previous year with banks in Russia exhibiting a sharp turnaround. Banks in Indonesia continued to be the most profitable largely due to relatively high net interest margins.
Capital Adequacy II.9 Capital adequacy proxied by the ratio of regulatory capital to risk-weighted assets (CRAR) generally improved across banks in AEs during 2016 though country-specific issues led to reduction in bank capital in Italy and Portugal. Similarly, CRAR positions of EME banks improved and they continued to maintain capital above theregulatory minimum (Chart II.5). Banks in the UK continued to maintain the highest capital ratio among AEs. Banks in Indonesia remained the most capitalised banks among EMEs. The capital position of Indian banks improved in 2016 over the previous year. Asset Quality II.10 The non-performing loans (NPL) ratio3 – a measure of asset quality – declined across banks in most AEs, barring Greece, Italy and Portugal, facing the overhang of the crisis-induced duress. Among other countries there was a considerable improvement in asset quality in Germany, the UKand USA (Chart II.6). In most EMEs, the NPL ratio generally increased relative to 2010. Sector- specific issues encumbered banks’ asset quality in India, while banks in Russia and Brazil were constrained by general economic weaknesses. Stress induced by heightened corporate leverage impacted asset quality in China. Asset quality concerns prompted policy action in many jurisdictions in the form of ‘Prompt Corrective Action’ (Box II.1). 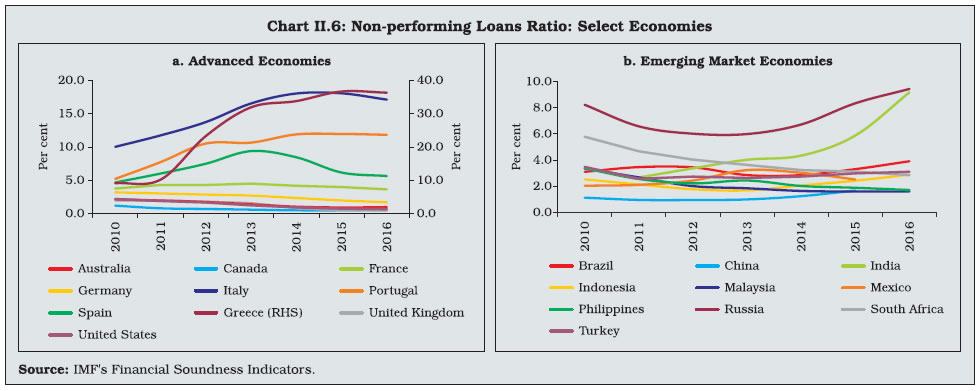
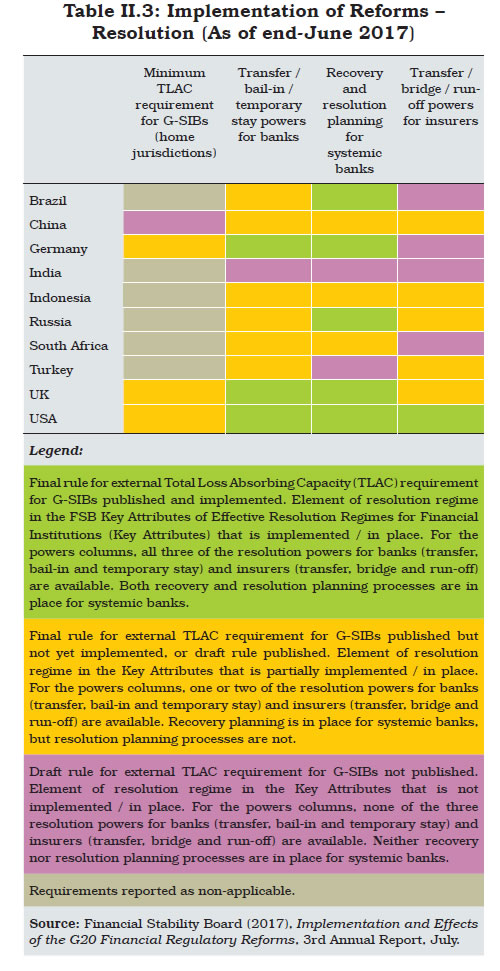
Box II.1: Prompt Corrective Action across Jurisdictions Prompt Corrective Action (PCA) refers to the imposition of appropriate regulatory sanctions on troubled financial institutions as and when they begin to exhibit symptoms of stress. The fundamental premise behind the PCA framework is based on the ‘to act before it’s too late’ principle. A set of criteria is used to determine the severity of a bank’s stress and restrictions are placed on its management and activities accordingly. PCA’s core lies in a sequence of increasingly harsh restrictions as the problem worsens so that banks have little incentive to delay corrective actions. It reduces the moral hazard associated with the Lender-of-Last-Resort (LOLR) and makes banks liable to improve their overall financial health. PCAs across the Globe USA: PCA of supervisory actions was introduced for insured depository institutions, which were not adequately capitalised. Banks were placed in one of the five zones (well capitalised; adequately capitalised; undercapitalised; significantly undercapitalised; and critically undercapitalised) based on three capital ratios (common equity Tier 1 (CET1); Tier I and total risk-based capital ratios) (IMF, 2015). Every zone other than the well capitalised zone, has a set of mandatory and discretionary provisions with increasing severity (Table 1). | Table 1: The PCA Framework in Various Jurisdictions | | | USA | UK | Canada | India | | Number of Stages | 5 | 5 | 4 | 3 | | Names of Stages | Stage 1: Well Capitalised Stage 2: Adequately Capitalised Stage 3: Undercapitalised Stage 4: Significantly Undercapitalised Stage 5: Critically Undercapitalised | Stage 1: Low risk to viability Stage 2: Moderate risk to viability Stage 3: Risk to viability absent action by the firm Stage 4: Imminent risk to viability of firm Stage 5: Firm in resolution or being actively wound up | Stage 1: Early warning Stage 2: Risk to financial viability or solvency Stage 3: Future financial viability in serious doubt Stage 4: Non-viability/ insolvency Imminent | Three thresholds defined for each indicator | | Key Parameters | Capital and leverage | Risk to viability | Financial viability or solvency | Capital, asset quality, Profitability | | Indicators Used | Total Capital, Tier 1 capital, CET 1 ratio, leverage, supplementary leverage. | Elements of the supervisory assessment framework that reflect the risks faced by a firm and its ability to manage them — external context, business risks, management and governance, risk management and controls, capital and liquidity. | Combination of an institution’s overall net risk, capital and earnings, risk management or control deficiencies, which present a serious threat to its financial viability or solvency. | CRAR/CET 1 ratio, net NPA ratio and return on assets. Leverage ratio is tracked additionally as a part of the framework. | | Method of Categorisation | Thresholds are defined for each indicator. | Quantitative and qualitative analysis is carried out for Proactive Intervention Framework (PIF) scores. | Quantitative and qualitative assessment of banks is carried out. | Thresholds are defined for each indicator. | | Rule-based | Every stage, other than the well capitalised zone, has a set of mandatory and discretionary provisions with increasing severity. | UK’s PIF gives guidance to banks on possible supervisory actions for the PIF stage they are in. | Every phase has an indicative set of actions. Authorities may choose to implement their powers on a case-to-case basis. | Rule-based regime with specified mandatory actions for each phase and a common menu of discretionary actions. | UK: The PCA framework in the UK [labelled the proactive intervention framework (PIF)] has five stages each denoting a different proximity to failure and every firm sits in a particular stage at each point in time. A firm’s PIF stage is reviewed at least annually and, if need be, at higher frequency depending on material developments (BOE, 2016). As a firm moves to a higher PIF stage – as the Prudential Regulatory Authority (PRA) determines that the firm’s viability has deteriorated – supervisory actions become more stringent. PRA assesses the risk to viability using qualitative and quantitative indicators. Canada: The PCA framework in Canada is a flexible intervention regime, which has no predetermined set of mandatory actions for every phase. The Guide to Intervention for Federally Regulated Deposit-Taking Institutions indicates what action / intervention will typically occur at what stage. The office of the Superintendent of Financial Institutions (OSFI) and / or the Canada Deposit Insurance Corporation (CDIC) have the freedom to deal with specific problems or institutions on a case-to-case basis, thus making the framework flexible. India: In contrast to these frameworks, the PCA framework in India is more broad-based and rule-based. It emphasises the importance of capital ratios, asset quality and profitability. A priori, information about discretionary and mandated actions makes banks aware of the sanctions that they might have to face once they breach risk thresholds. The Banking Regulations Act, 1949 empowers the Reserve Bank to take action when early warning signals of distress are visible. To adhere to international best practices, the Reserve Bank started the PCA scheme in December 2002. It worked out a schedule of corrective actions based on three indicators – capital ratios, the net NPA ratio and RoA. On the directions of the Financial Stability and Development Council (FSDC) sub-committee, the framework was reviewed recently and a revised PCA framework was implemented with effect from April 2017. The indicators to be tracked for capital, asset quality and profitability are capital to risk-weighted assets ratio (CRAR); the common equity Tier 1 ratio; net NPA ratio; and RoA. New risk thresholds have also been defined and a breach of these will lead to the invocation of PCA and mandatory and discretionary action. Further, a common menu of discretionary actions has been laid out for each PCA bracket (RBI, 2017). References: Bank of England (2016), The Prudential Regulation Authority’s Approach to Banking Supervision. London, March. IMF (2015), United States – Financial Sector Assessment Programme. Country Report No. 15/89, Washington DC, April. Reserve Bank of India (2017), Revised Prompt Corrective Action (PCA) Framework for Banks, April. | Leverage Ratio II.11 The ratio of capital to unweighted total assets, also called the leverage ratio, works as an adjunct to risk-weighted capital ratios in tracking the banks’ capital adequacy. The GFC proved that risk weights were not perfect and that a firm’s assets must be backed by at least some minimum amount of capital. The leverage ratio has generally improved across banks in AEs and EMEs largely due to a regulatory push under Basel III which sets a threshold of 3 per cent. Among AEs, banks in the US and Greece maintained the most capital relative to unweighted assets while banks in Indonesia and Malaysia had high leverage ratios among the EMEs (Chart II.7). Financial Market Indicators II.12 Market-based indicators of bank health and profitability have shown steady improvement reflecting progress in banks’ balance sheet repairs, improved prospects of bank profitability and sanguine market sentiments. Banks’ equity prices generally maintained an upward momentum through 2016 with banks in Europe and the US experiencing the largest gains relative to banks inEMEs, especially since mid-2016 (Chart II.8). Similarly, bank credit default swap (CDS) spreads narrowed, reflecting investors’ increasing comfort about their health. Banks in the UK and North America had the lowest CDS spreads. European banks’ declining CDS spreads underscore the progress made in bank balance sheet clean-ups, especially in Italy, Spain and Portugal. III. Banking Developments: Select Advanced and Emerging Market Economies II.13 Developments in the systemic banking systems in the US, UK and Euro area have a bearing on the global economy and are constantly evolving. On the other hand, the state of banking systems in China, Brazil and Russia depicts the condition of banks in peer EMEs, which are at various stages of the economic cycle and are grappling with their own issues. The US Banking System II.14 Credit growth in the US banking system was positive from Q1:2012 and broad-based favouring sectors like real estate and commercial and industrial loans. However, in 2017 credit growth in the US moderated as tightening credit standards took a toll on commercial real estate, credit cards and auto loans, coupled with muted demand for commercial and industrial loans. Deposit growth, on the other hand, has grown at a slightly higher pace relative to credit in 2017, so far (Chart II.9). 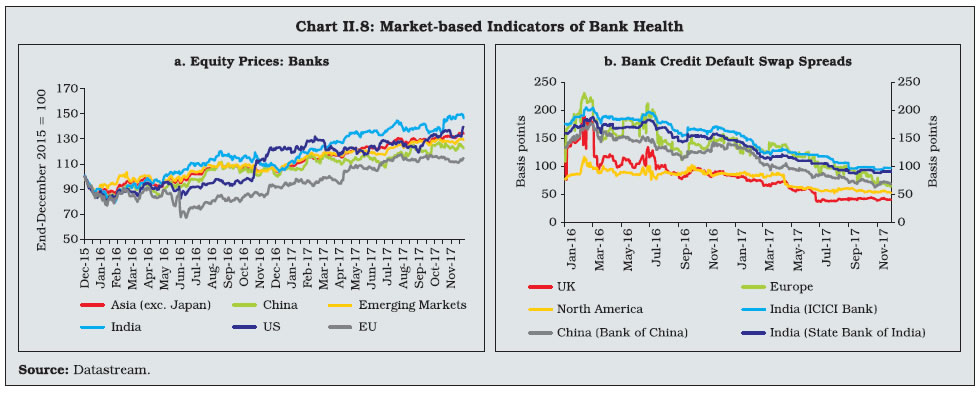
 II.15 Asset quality, represented by delinquency rates,4 improved as the US economy recovered and a policy-led bank balance sheet clean-up was initiated. Delinquency rates on real estate loans contributed the most to the overall delinquency rates. With these declining sharply from the post- GFC peaks, improvements in asset quality are reflected in a lesser number of institutions andlower amounts of assets failing (Chart II.10). Nonetheless, there was an uptick in delinquency rates for sub-prime credit card and auto loans from Q2:2016. The UK Banking System II.16 Amidst uncertain conditions surrounding Brexit, banks in the UK remained resilient with improving capital and leverage ratios and falling funding costs. Bank lending picked up and depositgrowth remained robust (Chart II.11). The recovery in credit growth was largely led by growth in loans to households, with pick-up in loans to other financial corporations in recent quarters. Within household credit, rapid growth in consumer credit amidst easier mortgage market lending standards raised concerns about loan serviceability in view of the relatively slower growth in nominal household incomes. 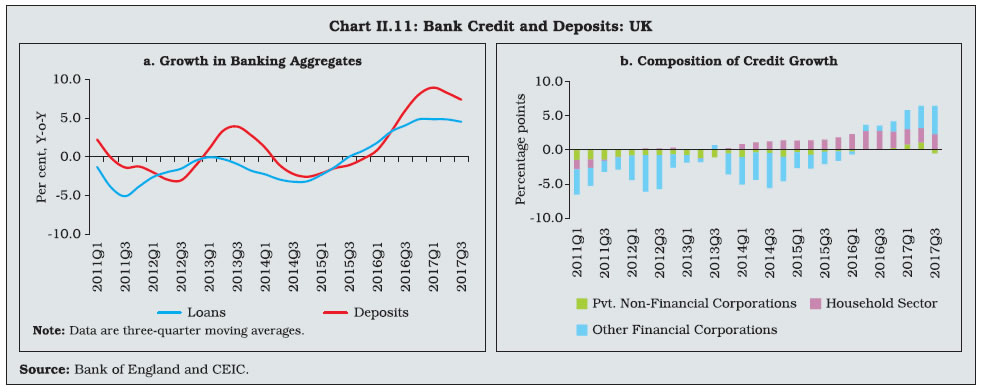 II.17 Similarly, growth in loans to businesses improved in 2017 so far, due to the recent recovery led by the growth in loans to large businesses(Chart II.12a). The Bank of England’s Credit Condition Survey (BOE-CCS) suggests that going forward growth in loan availability to SMEs is likely to be small but positive while credit availability for medium-sized enterprises isexpected to be inert (Chart II.12c). There are also concerns relating to defaults on unsecuredindividual credit (Chart II.12d). Uncertainties about Brexit and low profitability will continue to condition the interplay between banks and financial stability. The Euro Area Banking System II.18 As the much-expected cyclical recovery takes hold in Europe, banks in the Euro area are poised to support growth. Increasing demand for loans, easing credit standards and lower rejection rates on loans for enterprises continued to support credit growth. Commensurately, assets of Euro area banks increased for four quarters ending Q1:2017, even as they took lesser recourseto wholesale funding (Chart II.13a). Lending surveys suggest a general easing of creditconditions in the Euro area (Chart II.13b). However, despite these developments, credit to the non-financial sector in major Euro area economies, barring France, remained below the levels seen before the Euro area sovereign debt crisis (Chart II.13c). II.19 Nonetheless, asset quality remained impaired in the Euro area by country-specific issues and structural challenges such as ‘over-banking’, which have implications for bank profitability (Table II.1). Marking considerable progress in bank balance sheet repairs in the Euro area, banks in Italy and Portugal were recapitalised in 2016, followed by a few banks in Spain and Italy in June and July 2017. Weak bank profitability, however, remains a challenge. On average, the cost of equity is more than the return on equity for the EU banking system. II.20 In a scenario of low-for-long interest rates, growth in bank deposits in the Euro area has been declining from mid-2015 across all componentsbarring household deposits (Chart II.14). Consequently, banks’ net income margins may remain under pressure. The Chinese Banking System II.21 As the Chinese economy reorients towards a more balanced and sustainable growth model, the pace of its credit expansion has come off the post-GFC highs though it remains higher than its peer economies (Chart II.15a, also see Chart II.2). China’s credit-to-GDP gap is one of the highest in the world, while it remains negative in other peer economies. Sustained high credit growth pushed the outstanding credit to about twice the Chinese GDP, which was about 25 per cent higher thantrend at end-2016 (Chart II.15b). Combined with an elevated debt service ratio, this may be an early indication of the building up of stress in theChinese banking system (Chart II.15c). In line with declining asset quality, the profitability of the Chinese banking system is also under pressure although Chinese banks have comfortable capitalpositions (Chart II.15d). Nonetheless, many financial institutions continued to depend heavily on wholesale funding and ‘shadow credit,’5 with sizeable asset-liability mismatches and burgeoning liquidity and credit risks. The recent turbulence in money markets in China highlighted the vulnerabilities in the interconnected system as stress in one sector translated into strains in related sectors. II.22 Policies addressing high credit growth and excess capacity in state-owned enterprises are in place in China, which are likely to shore up macroeconomic and financial stability. On the other hand, large and complex exposures of intra-financial institutions warrant policy attention. Achieving a fine balance between the objectives of maintaining high growth and the need for deleveraging is engaging policy authorities in China. The Brazilian Banking System II.23 The 2016 recession in Brazil brought about a challenging operating environment for banks which was reflected in declining credit and bankprofitability and increasing NPL ratios (Chart II.16 a and b). Outstanding credit started declining in Q2: 2016 with the magnitude of decline increasing for loans to industry in 2017 so far, pushing the credit-to-GDP gap further into the negative. Corporate credit risks materialised in 2016, mainly among large corporates. However, commensurate increase in provisions is likely to cushion the impact of adverse asset quality on financial stability in Brazil. During 2017 so far, the banking sector’s performance has improved as the economy emerges from the recession. NPLs have declined, RoAs have improved and banks’ capital position has strengthened further. The Russian Banking System II.24 The Russian economy is emerging from a recession largely induced by external factors. Increase in oil prices will aid its recovery with commensurate improvements in the performance of the banking sector. All components of credit have increased in 2017 so far with personal loansreturning to positive growth (Chart II.17a). The resilience of Russia’s banking sector has improved as limits have been set on related-party transactions, policies have been put in place to reduce dollarisation and a tiered supervisoryframework has been set up (Chart II.17b). Banks’ profitability has improved largely on increase in net interest margins and lower provisioning in stabilising non-performing loans. IV. World’s Biggest Banks: Profitability, Health and Soundness6 II.25 The sample of the world’s top 100 banks when ranked by Tier 1 capital remained largely the same in 2016 as in the preceding year. Commensurate with the increasing role of EME banks in the global economy, their number among the top 100 banks (when ranked by Tier 1 capital) has been rising, which was also mirrored in theirshares in total banking assets (Chart II.18). Interestingly, nearly all EME banks in the top 100 increased their share in total assets led by Chinese banks while banks in the UK suffered the largest loss of share between 2015 and 2016. Profitability and Asset Quality II.26 Profitability of the largest 100 banks as measured by return on assets, was more or less unchanged between 2015 and 2016; 95 banks recorded positive RoAs in 2016 as compared to96 banks in 2015 (Chart II.19a), although a larger number of banks had RoAs between 2-3 per cent in 2016 relative to 2015. Improving asset quality, with fewer banks having NPLs of more than 5 per cent in 2016 as compared to 2015, is driving the gradual return to profitability (Chart II.19b). II.27 Alongside the improvements in asset quality, banks’ stronger capital positions enabled a concomitant reduction in financial leverage. In 2016 more banks in the top 100 maintained higher capital relative to assets than in the previous year; 53 banks had capital assets ratios (CARs) of at least 6 per cent in 2016 as compared to 50 banks in 2015 (Chart II.20a). Moreover, all the top 100 banks maintained a CAR of more than 3 per cent, the regulatory minimum prescribed under Basel III. II.28 In addition to the improvements in CAR, banks’ capital position relative to assets adjusted for risk also improved in 2016. Banks with capital to risk-weighted assets ratios (CRAR)7 of more than 16 per cent, that is, double the level prescribed under Basel III, increased in 2016 overthe previous year (Chart II.20b). Nonetheless, banks with higher capital were not the most profitable as declining asset quality has been taking its toll through income losses and provisions (Chart II.21a and b). V. Global Policy Reforms II.29 Drawing lessons from the GFC, a number of reforms are underway to reduce the likelihood and severity of future cataclysms while nurturing an open and integrated global financial framework in supporting the G20 objectives of strong, sustainable and balanced growth. Regulatory Reforms II.30 The reform programme has four core elements: (i) making financial institutions more resilient; (ii) ending the too-big-to-fail (TBTF); (iii) making derivatives markets safer; and (iv) transforming shadow banking into resilient market-based finance. The main elements of reforms have been agreed to and the reforms are at various stages of implementation. Apart from these reforms, work is also underway to strengthen governance frameworks to reduce misconduct risks, assess and address the decline in correspondent banking and analysing FinTech’s potential financial stability implications. Making Financial Institutions More Resilient II.31 Considerable progress has been made in implementing the Basel III norms (Table II.2). As a result, banks now have a larger capital base and more liquid assets than before thereby building resilience without impeding credit supply. All major internationally active banks have met risk-based capital and leverage ratio requirements well in advance of the deadline and global liquidity standards are catalysing the change in bank funding models. Further, jurisdictions in which global systemically important banks (G-SIBs) are headquartered have implemented higher loss absorbency requirements. Ending-Too-Big-To-Fail II.32 The identification processes for G-SIBs and global systemically important insurers (G-SIIs) are in place and the annual review of the list of G-SIBs and G-SIIs enables continuous assessment of these institutions (Table II.3). G-SIBs are subject to higher capital buffer requirements and have to meet total-loss absorbing capacity (TLAC) requirements in addition to Basel III’s regulatory capital standards. G-SIBs have increased capital by about US$ 1 trillion since 2009 while reducing assets thereby fortifying balance sheets. In addition, liquidity and loan-to-deposit ratios have improved. Thus, reliance on wholesale funding has fallen, even as about two-third of G-SIBs’ non-core assets have been disposed-off.8 A new assessment framework for G-SIBs was put forth by the Basel Committee on Banking Supervision (BCBS) in March 2017 and the International Association of Insurance Supervisors (IAIS) is developing an activities-based approach to systemic risk assessment for the insurance sector. Work is also underway to identify non-bank non-insurer global systemically important financial institutions (NBNI G-SIFIs). | Table II.2: Adoption Status of Basel III - Number of Basel Committee Member Jurisdictions (End-March 2017) | | Basel standard | BCBS agreed date of implementation | Status as of end- March 2017 | | Draft rules issued | Final rules issued (not in force) | Final rules in force | | Risk-based capital standards | | Definition of capital | Jan 2013 | -- | -- | 27 | | Capital conservation buffer | Jan 2016 | -- | -- | 27 | | Counter-cyclical buffer | Jan 2016 | 1 | -- | 26 | | Capital requirements for equity investments in funds | Jan 2017 | 11 | -- | 8 | | Standardised approach for measuring counterparty credit risk (SA-CCR) | Jan 2017 | 13 | 1 | 5 | | Securitisation framework | Jan 2018 | 11 | 3 | -- | | Margin requirements for non-centrally cleared derivatives | Sep 2016 | 2 | -- | 18 | | Capital requirements for CCPs | Jan 2017 | 11 | 1 | 5 | | Liquidity standards | | Liquidity coverage ratio (LCR) | Jan 2015 | -- | -- | 27 | | LCR disclosure requirements | Jan 2015 | 1 | -- | 16 | | Net stable funding ratio (NSFR) | Jan 2018 | 16 | 1 | 1 | | NSFR disclosure requirements | Jan 2018 | 12 | -- | 1 | | Other Basel III standards | | Leverage ratio | Jan 2018 | 2 | 1 | 19 | | Leverage ratio disclosure requirements | Jan 2015 | 1 | -- | 26 | | G-SIB requirements | Jan 2016 | -- | -- | 19 | | D-SIB requirements | Jan 2016 | 1 | -- | 26 | | Pillar 3 disclosure requirements | Dec 2016 | 3 | 9 | 8 | | Large exposures | Jan 2018 | 11 | -- | 2 | | Source: Basel Committee on Banking Supervision (2017), Implementation of Basel Standards, July. |
 Making Derivatives Markets Safer II.33 Meaningful progress has been made in implementing reforms in over-the-counter (OTC) derivatives market, particularly for trade reporting and interim higher capital requirements for non-centrally cleared derivatives (Table II.4). About three-fourth of the jurisdictions have implemented comprehensive central clearing frameworks while about half of the jurisdictions have implemented comprehensive margin requirements and trading platform frameworks. Progress has also been made in improving transparency via the use of trade repositories, while central counterparties (CCPs) have been rendered more resilient through prescription of higher capital. Further to the progress made, work is underway to improve CCPs’ resilience, recovery planning and resolvability. Efforts are also being made to improve data quality and remove legal barriers to reporting and accessing trade repositories’ data. Transforming Shadow Banking into Resilient Market-based Finance II.34 The risk elements of shadow banks, which precipitated the GFC have abated and currently do not pose financial stability risks. Vulnerabilities in the repo market and money market funds (MMFs) have also been addressed (Table II.5). Implementation of the policy measures recommended by the International Organisation of Securities Commissions (IOSCO) is reducing the risk of runs in money market funds. These recommendations have been implemented in the US and China in addition to five other FSB jurisdictions. Advancements have been made in implementing fair valuation of MMF portfolios though progress in liquidity management has been limited. There has also been increased participation in efforts to track trends and risks in non-banks’ activities. Addressing Misconduct Risks II.35 FSB is implementing an action plan to address misconduct risks through a range of preventive measures, focusing on: (i) improvements in financial institutions’ governance and compensation structures; (ii) improvements in global standards of conduct in the fixed income, commodities and currency markets; and (iii) reforms in major financial benchmark arrangements to reduce the risk of their manipulation. Correspondent Banking II.36 FSB is implementing a four-point action plan to assess and address the decline in correspondent banking, comprising of: (i) examining the dimensions and implications of the issue; (ii) clarifying regulatory expectations as a matter of priority including guidance by the Financial Action Task Force (FATF) and the Basel Committee on Banking Supervision; (iii) domestic capacity-building in jurisdictions that are home to affected respondent banks; and (iv) strengthening tools for due diligence by correspondent banks. FSB’s Correspondent Banking Data Report highlights a decline in the number of correspondent banking relationships (CBRs), especially for the US dollar and the euro. Reasons for the termination of CBRs include industry consolidation; lack of profitability; overall risk appetite; and various causes related to anti-money laundering and countering the financing of terrorism (AML / CFT) or sanctions regimes. FinTech’s Implications II.37 In its report to the G20 on Financial Stability Implications from FinTech in June 2017, FSB highlighted 10 areas that merit authorities’ attention of which three are seen as priorities for international collaboration to safeguard financial stability while fostering more inclusive and sustainable finance: (i) managing operational risks from third-party service providers; (ii) mitigating cyber risks; and (iii) monitoring macro-financial risks that could emerge as FinTech’s activities increase. Macroprudential Policies II.38 In a renewed focus on re-regulation the macroprudential policies have been refined (Box II.2). The first two Basel frameworks were largely microprudential in nature. Under Basel III, a comprehensive macroprudential framework has been put in place and it continues to evolve taking into account countries’ experiences and knowledge gained in the implementation of these policies. Box II.2: Role of Macroprudential Policies in the post-Global Financial Crisis Period Macroprudential policies have three interlocking intermediate objectives: (a) increasing the resilience of the financial system to aggregate shocks; (b) containing the build-up of systemic vulnerabilities over time; and (c) controlling structural vulnerabilities within the financial system. In an overarching sense, a macroprudential policy involves the use of primarily prudential tools to limit systemic risks (IMF-FSB-BIS 2011). In the post GFC period, macroprudential policies have been used in both advanced and emerging market economies to reduce the ‘agency problems’ of moral hazard and adverse selection (Chart 1). Broad-based capital tool buffers like the dynamic loan loss provisioning requirement (DPR) have been used to cover ‘expected losses’ over a cycle whereas the counter-cyclical capital buffer (CCCB) has been primarily used to dampen the pro-cyclicality of bank lending and to cover ‘unexpected losses’. This improves the financial system’s resilience and shields the real economy from the adverse effects of constricted liquidity conditions during crises. Complementing these tools is the leverage ratio, which seeks to augment the banking system’s resilience by capturing leverage over and above normal prudential metrics to ensure that the banks are not leveraged excessively beyond their capacity to absorb losses. 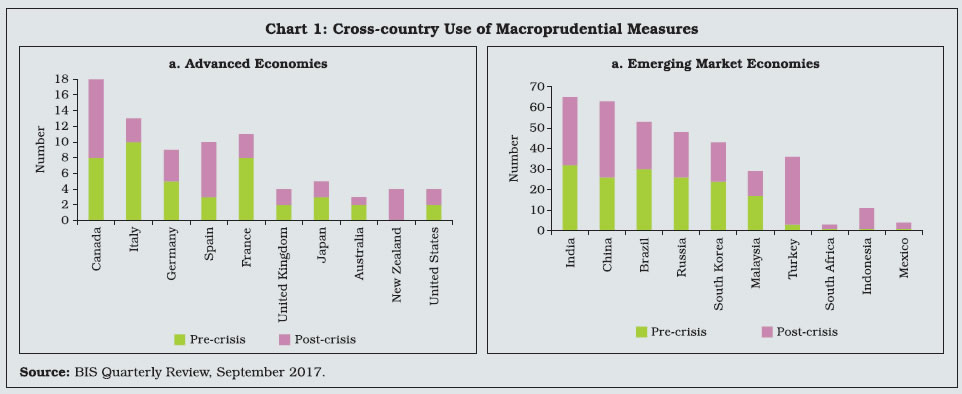 Sectoral capital requirements nudge banks towards internalising the cost of lending to particularly vulnerable sectors. On the other hand, loan-to-value (LTV) caps address elements of adverse selection and moral hazard and break the feedback loop between bank lending and asset prices. Debt-service-to-income (DSTI) ratios and the debt-to-income (DTI) ratios increase households’ resilience to income and interest rate shocks. They can be augmented by increasing risk weights on unsecured household borrowings to check leakages. Information content in the credit-to-GDP gap, that is, positive deviations of the credit-to-GDP ratio from its long-term trend, is used as an early warning signal. In addition, positive deviations of asset prices from their long-term trends also signal impending banking distress. Increase in property prices relative to rents and income point to a potential build-up of vulnerabilities. The debt service ratio has been found to be a better performing early warning indicator for shorter horizons. Funding large amount of credit from non-core sources signals the degree of risk being taken by banks. Though the evidence on the effectiveness of a macroprudential policy is still emerging, a number of studies suggest a favourable outcome. Resilience and credit growth are found to be supported by capital-based tools while sectoral capital requirements have been found to increase buffers (IMF, 2014). Tools such as LTV, loan-to-income (LTI) and DSTI ratios have been successful in breaking the feedback loop between credit and asset prices in Singapore (Darbar et al., 2015) and Hong Kong (HKMA, 2011) The loss-absorbing capacity of many global banks has increased, risks related to maturity transformation have been addressed and liquidity risks have reduced (Yellen, 2017). Macroprudential policies could also potentially involve output costs and may inhibit growth by affecting credit supply and investments. There is also recognition that there could be newer risks outside the current pedagogy of policy prescriptions which could destabilise the world economy. One such risk is the latent run-like behaviour in bond markets (Francia et al., 2016). At best, macroprudential policies reduce the likelihood of a crisis without eliminating it completely. Other policies need to work in conjunction to safeguard financial stability. References: Darbar, S.M and K. Habermeier (2015), ‘Experiences with Macroprudential Policy—Five Case Studies’, WP/15/123, International Monetary Fund, June. HKMA (2011), ‘Loan-to-value Ratio as a Macroprudential Tool – Hong Kong SAR’s Experience and Cross-country Evidence’, BIS Papers No. 57, Bank for International Settlements, October. IMF (2014), “Staff Guidance Note on Macroprudential Policy”, December. IMF-FSB-BIS, (2011), “Macroprudential Policy Tools and Frameworks: Progress Report to G20”, October. Ramos-Francia, M and S. Garcia-Verdu (2016), “Macroprudential Policy Regulation: Some Continuing Challenges”, BIS Policy Papers no. 86, September. Yellen, J.L (2017), ‘Financial Stability a Decade After the Onset of the Crisis’, Remarks at Fostering a Dynamic Global Recovery – a Symposium, Federal Reserve Bank of Kansas City, Jackson Hole, Wyoming, August. | Pillar 3 Disclosure Requirements II.39 The BCBS issued a new standard for disclosures under Pillar 3 in March 2017. This standard consolidates all existing BCBS disclosure requirements into the Pillar 3 framework and makes two enhancements to the existing framework – it introduces a dashboard of a bank’s key prudential metrics, which will provide users of Pillar 3 data with an overview of a bank’s prudential position. It also has a new disclosure requirement for those banks, which record prudent valuation adjustments (PVAs) to provide users with a granular breakdown of how a bank’s PVAs are calculated. Further revisions to the Pillar 3 standards include revised disclosure requirements for market risk arising from the revised market risk framework published by BCBS in January 2016. Reforming Major Interest Rate Benchmarks II.40 In 2014 a combination of attempted manipulation of interest rate benchmarks (IRBs) and a decline in liquidity in key unsecured interbank markets led FSB to make recommendations aimed at enhancing IRBs and promoting the development of nearly risk-free reference rates (RFRs). A number of measures are being taken to test and improve the robustness of methodologies of the Euro Interbank Offered Rate (EURIBOR), the London Interbank Offered Rate (LIBOR) and the Tokyo Interbank Offered Rate (TIBOR). The European Money Market Institute has been developing a hybrid model for EURIBOR, which will combine transactions and related market data with expert judgment. Similarly, administrators of LIBOR and TIBOR have adjusted the methodologies of these benchmarks to account for a lack of substantial data. Work is also underway to identify new or existing RFRs, which could be used in place of IRBs in a range of contracts, particularly derivatives. However, limited progress has been made in transitioning from IRBs to RFRs even when RFRs are available. VI. Summing up II.41 Considerable progress has been made in improving banks’ health in AEs since the global financial crisis. By contrast, country-specific factors have led to a spike in non-performing loans in some EMEs. Banks’ capital positions have improved and financial leverage is now contained. Credit growth is picking up in AEs with banks’ balance sheets repairs whereas supply and demand-side factors have led to a slowdown in credit growth in a number of EMEs. Against the backdrop of global growth regaining strength and spread, bank profitability remains low and in some cases below the cost of capital for banks, hindering their ability to organically augment capital bases and expand credit more strongly. The emergence of FinTech also poses a danger to bank profitability in some cases while providing an avenue for cutting costs through efficiency gains and hence boosting profitability in others. While reforms have made the global banking system safer and more resilient and macroprudential policies have reduced vulnerabilities and supported traditional policies, risks remain. In particular, greater acceptance of crypto-currencies is becoming a formidable risk to the traditional banking system.
|