The Indian economy would gradually consolidate growth in 2017-18 and 2018-19, according to the 28 forecasters surveyed by the Reserve Bank. CPI inflation is expected to gradually rise to 5.0 per cent by Q4:2017-18. Medium- and long-term inflation expectations have moderated. On the external front, foreign trade is expected to shed recent sluggishness. The Reserve Bank has been conducting the Survey of Professional Forecasters (SPF) since September 2007 and the 46th round of survey was conducted during May 20172 in which 28 forecasters participated. Annual forecasts for the financial year 2018-19 were sought for the first time in this round. The survey results are summarised in terms of their median forecasts and consolidated in the Annex. Highlights: 1. Output -
Real GDP and Real GVA are expected to grow by 7.4 per cent and 7.2 per cent, respectively, in 2017-18 and would consolidate further by 40 basis points (bps) and 50 bps, respectively in 2018-19 (Tables 1 and 2). -
On the demand side, both consumption and investment are expected to improve and a higher saving rate is likely to support the rising investment demand. | Table 1: Median Forecast of Growth in Real GDP, GVA and components – 2017-18 and 2018-19 | | (per cent) | | | 2017-18 | 2018-19 | | Real GDP Growth | 7.4 | 7.8 | | Real GVA Growth | 7.2
(-0.1) | 7.7 | | a. Agriculture and Allied Activities | 3.5
(0.0) | 3.0 | | b. Industry | 7.2
(+0.2) | 7.6 | | c. Services | 8.3
(-0.2) | 8.8 | Private Final Consumption Expenditure
(growth rate in per cent) | 12.1
(0.0) | 12.6 | Gross Saving Rate
(per cent of GNDI) | 31.8
(0.0) | 32.3 | Gross Fixed Capital Formation Rate
(per cent of GDP) | 28.0
(-0.8) | 29.5 | | Note:- In all the tables, the figures in parentheses indicate the extent of revision in median forecasts (percentage points) relative to the previous SPF round. |
| Table 2: Median Forecast of Real GDP and Real GVA growth from Q1:2017-18 to Q4:2017-18 | | (per cent) | | | Q1:17-18 | Q2:17-18 | Q3:17-18 | Q4:17-18 | | Real GDP Growth | 7.2 | 7.3 | 7.4 | 7.5 | | Real GVA Growth | 6.9
(-0.1) | 7.3
(-0.1) | 7.1
(-0.3) | 7.4
(-0.2) | | a. Agriculture and Allied Activities | 3.5
(+0.3) | 3.5
(0.0) | 3.9
(+0.4) | 3.5
(-0.4) | | b. Industry | 7.0
(+0.3) | 7.0
(0.0) | 7.4
(0.0) | 8.0
(+0.4) | | c. Services | 7.9
(-0.1) | 8.2
(0.0) | 8.3
(-0.2) | 8.5
(0.0) | - Among the forecasters, there is greater confidence that real GVA growth in 2017-18 would range between 7.0–7.4 per cent and in the range of 7.5-7.9 per cent in 2018-19 (Charts 1A and 1B).
2. Inflation -
Headline CPI inflation is expected to gradually increase from its current low to 5.0 per cent in Q4:2017-18, with core inflation (i.e., excluding food & beverages, pan, tobacco and intoxicants and fuel and light) expected to remain sticky at around 4.8 per cent. - WPI headline inflation is expected to rise moderately till December before declining to 3.0 per cent in Q4:2017-18.
| Table 3: Median Forecast of Quarterly Inflation | | (per cent) | | | Q1:17-18 | Q2:17-18 | Q3:17-18 | Q4:17-18 | | CPI Headline | 2.9
(-1.0) | 3.6
(-0.6) | 4.5
(-0.3) | 5.0
(-0.3) | | CPI excluding food & beverages, pan, tobacco & intoxicants and fuel & light | 4.5 | 4.8 | 4.8 | 4.8 | | WPI Headline | 3.2
(-1.3) | 3.5
(-1.0) | 3.7
(-1.0) | 3.0
(-0.7) | | WPI-Non-food Manufactured Products | 2.0
(-0.9) | 2.4
(-0.6) | 2.1
(-1.0) | 2.2
(-0.8) | - Projected density estimates for March 2018 and March 2019 indicate that the headline CPI inflation is highly likely to fall in the range 4.5–4.9 per cent by March 2018 and 4.0–4.4 per cent by March 2019.
3. External Sector -
There is greater optimism around the growth of both exports and imports than in previous rounds which is expected to sustain in 2018-19. -
Forecasters expect an increase in the current account deficit (CAD) to 1.3 per cent of GDP in 2017-18 and further to 1.5 per cent 2018-19. | Table 5: Median Forecast of Select External Sector Variables | | | 2017-18 | 2018-19 | Merchandise Exports – in US $ terms
(annual growth in per cent) | 7.4
(+1.5) | 7.6 | Merchandise Imports– in US $ terms
(annual growth in per cent) | 9.6
(+2.5) | 7.5 | Current Account Deficit
(Ratio to GDP at current market price in per cent) | 1.3
(+0.1) | 1.5 | 4. Medium-term and Long-term Forecasts -
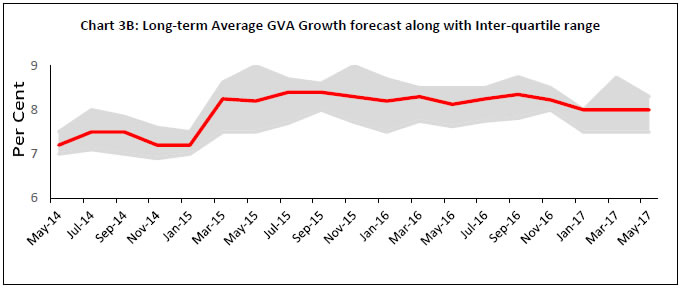
Real GVA growth is expected to improve over the medium-term (five year average) by 20 basis points to 7.7 per cent but long-term growth (ten year average) is expected to remain at 8.0 per cent as projected in the previous survey round (Charts 3A and 3B). -
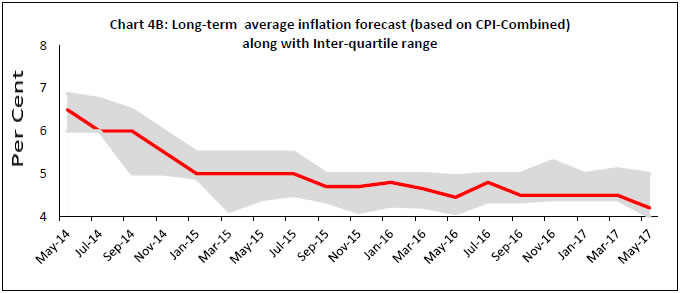
Inflation expectation, both in the medium- and long-term moderated by 10 bps and 30 bps respectively, to 4.7 per cent and 4.2 per cent respectively (Charts 4A and 4B). 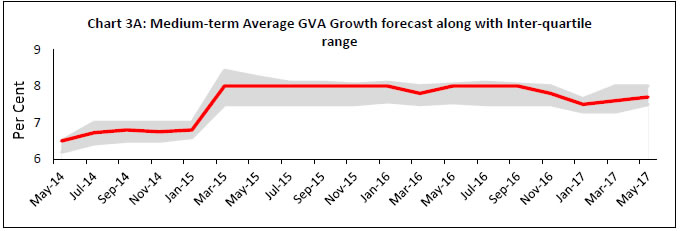

The Reserve Bank thanks the following individuals / institutions for their participation in this round of the Survey of Professional Forecasters (SPF): Deepali Bhargava, Credit Suisse; Upasna Bhardwaj, Kotak Mahindra Bank; Gaurav Kapur, IndusInd Bank; Shailesh Kejariwal, B&K Securities India Pvt Ltd; CARE Ratings; Sameer Narang, IDFC Bank; Siddharth Kothari, Sunidhi Securities & Finance Ltd; Charmy Jain, STCI Primary Dealer Ltd; ICICI Securities Primary Dealership; Arun Singh, Dun & Bradstreet India; SP Shama, Megha Kaul, Areesha Fatma, PHD Research Bureau; Nikhil Gupta, Motilal Oswal Securities; and Vikram Murarka, Kshitij Consultancy Services. The Bank also acknowledges the contribution of 15 others SPF panelists to the survey, who preferred to remain anonymous. |
Annex | Table A.1: Annual Forecasts for 2017-18 | | Key Macroeconomic Indicators | Annual Forecasts for 2017-18 | | Mean | Median | Max | Min | 1st quartile | 3rd quartile | | 1 | GDP at constant (2011-12) prices: Annual Growth (per cent) | 7.4 | 7.4 | 8.0 | 6.8 | 7.3 | 7.5 | | 2 | GVA at basic prices at constant (2011-12) prices: Annual Growth rate (per cent) | 7.2 | 7.2 | 7.5 | 6.6 | 7.0 | 7.4 | | a | Agriculture & Allied Activities (growth rate in per cent) | 3.5 | 3.5 | 5.4 | 1.8 | 3.0 | 3.7 | | b | Industry (growth rate in per cent) | 7.1 | 7.2 | 8.7 | 5.6 | 6.6 | 7.5 | | c | Services (growth rate in per cent) | 8.3 | 8.3 | 9.4 | 7.2 | 8.0 | 8.6 | | 3 | Private Final Consumption Expenditure (PFCE) at current prices: Annual Growth (per cent) | 11.9 | 12.1 | 14.9 | 7.1 | 11.2 | 13.1 | | 4 | Gross Saving Rate (per cent of Gross National Disposable Income) - at current prices | 31.5 | 31.8 | 35.2 | 28.2 | 30.0 | 32.8 | | 5 | Gross Fixed Capital Formation (GFCF) Rate (per cent of GDP at current market prices) | 28.3 | 28.0 | 33.8 | 26.0 | 27.0 | 29.5 | | 6 | Fiscal Deficit of Central Govt. (per cent of GDP at current market prices) | 3.0 | 3.2 | 3.6 | -3.2 | 3.2 | 3.2 | | 7 | Bank Credit - Scheduled commercial banks: Annual Growth (per cent) | 8.4 | 8.2 | 11.3 | 6.0 | 7.0 | 10.0 | | 8 | Yield on 10-Year G-Sec of Central Govt. (end-period) | 6.8 | 6.8 | 7.4 | 6.2 | 6.7 | 7.0 | | 9 | Yield on 91-day T-Bill of Central Govt. (end-period) | 6.2 | 6.2 | 7.5 | 5.6 | 5.8 | 6.5 | | 10 | BSE Sensex (end-December) | 30500 | 31000 | 33000 | 28000 | 28500 | 32250 | | 11 | Merchandise Exports - BoP basis - In US $ bn. | 297.9 | 296.4 | 322.0 | 279.7 | 291.1 | 303.8 | | 12 | Merchandise Exports - BoP basis - Annual Growth (per cent) | 7.9 | 7.4 | 15.0 | 2.3 | 6.0 | 9.3 | | 13 | Merchandise Imports - BoP basis - In US $ bn. | 426.2 | 424.7 | 468.0 | 394.0 | 415.0 | 434.7 | | 14 | Merchandise Imports - BoP basis - Annual Growth (per cent) | 9.9 | 9.6 | 16.7 | 4.6 | 7.7 | 11.6 | | 15 | Current Account Balance - In US $ bn. | -28.7 | -31.6 | 20.9 | -42.3 | -34.2 | -26.7 | | 16 | Current Account Balance - Ratio to GDP at current market price (per cent) | -1.0 | -1.3 | 1.5 | -1.7 | -1.4 | -1.1 | | 17 | Overall BoP - In US $ bn. | 28.0 | 25.0 | 53.5 | 12.0 | 19.6 | 34.3 | | 18 | Inflation based on CPI-Combined - Headline | 4.3 | 4.3 | 5.2 | 3.5 | 3.8 | 4.9 | | 19 | Inflation based on CPI-Combined - excluding 'Food & Beverages', 'Pan, Tobacco & Intoxicants' and 'Fuel & Light' | 4.8 | 4.7 | 5.8 | 4.0 | 4.5 | 5.0 | | 20 | Inflation based on WPI - All Commodities | 3.4 | 3.3 | 5.5 | 2.5 | 2.8 | 3.8 | | 21 | Inflation based on WPI -Non-food Manufactured Products | 2.3 | 2.0 | 3.7 | 1.5 | 1.8 | 2.9 |
| Table A.2: Annual Forecasts for 2018-19 | | Key Macroeconomic Indicators | Annual Forecasts for 2018-19 | | Mean | Median | Max | Min | 1st quartile | 3rd quartile | | 1 | GDP at constant (2011-12) prices: Annual Growth (per cent) | 7.8 | 7.8 | 8.2 | 6.9 | 7.6 | 8.0 | | 2 | GVA at basic prices at constant (2011-12) prices: Annual Growth rate (per cent) | 7.6 | 7.7 | 8.0 | 6.7 | 7.5 | 7.8 | | a | Agriculture & Allied Activities (growth rate in per cent) | 3.2 | 3.0 | 4.5 | 2.0 | 2.6 | 4.1 | | b | Industry (growth rate in per cent) | 7.4 | 7.6 | 8.2 | 6.0 | 6.7 | 8.0 | | c | Services (growth rate in per cent) | 8.9 | 8.8 | 10.0 | 7.6 | 8.6 | 9.1 | | 3 | Private Final Consumption Expenditure (PFCE) at current prices: Annual Growth (per cent) | 12.6 | 12.6 | 15.2 | 8.0 | 11.6 | 13.9 | | 4 | Gross Saving Rate (per cent of Gross National Disposable Income) - at current prices | 31.7 | 32.3 | 34.5 | 28.2 | 30.0 | 33.5 | | 5 | Gross Fixed Capital Formation (GFCF) Rate (per cent of GDP at current market prices) | 29.1 | 29.5 | 34.0 | 25.4 | 26.9 | 30.2 | | 6 | Fiscal Deficit of Central Govt. (per cent of GDP at current market prices) | 2.7 | 3.0 | 3.2 | -3.0 | 3.0 | 3.0 | | 7 | Bank Credit - Scheduled commercial banks: Annual Growth (per cent) | 10.7 | 11.0 | 13.0 | 8.0 | 10.0 | 11.9 | | 8 | Yield on 10-Year G-Sec of Central Govt. (end-period) | 6.8 | 6.8 | 7.5 | 6.3 | 6.5 | 7.2 | | 9 | Yield on 91-day T-Bill of Central Govt. (end-period) | 6.0 | 5.9 | 7.3 | 5.5 | 5.6 | 6.5 | | 10 | BSE Sensex (end-December) | 34125 | 34250 | 38000 | 30000 | 30875 | 37250 | | 11 | Merchandise Exports - BoP basis - In US $ bn. | 324.3 | 325.0 | 373.5 | 298.0 | 306.2 | 334.0 | | 12 | Merchandise Exports - BoP basis - Annual Growth (per cent) | 7.9 | 7.6 | 12.2 | 3.3 | 4.4 | 11.0 | | 13 | Merchandise Imports - BoP basis - In US $ bn. | 461.6 | 453.9 | 515.4 | 413.7 | 445.5 | 480.3 | | 14 | Merchandise Imports - BoP basis - Annual Growth (per cent) | 8.5 | 7.5 | 15.0 | 4.6 | 5.0 | 11.4 | | 15 | Current Account Balance - In US $ bn. | -37.0 | -44.9 | 21.6 | -48.3 | -47.7 | -37.0 | | 16 | Current Account Balance - Ratio to GDP at current market price (per cent) | -1.2 | -1.5 | 1.2 | -2.0 | -1.7 | -1.3 | | 17 | Overall BoP - In US $ bn. | 26.3 | 19.2 | 65.0 | 10.3 | 15.7 | 36.1 | | 18 | Inflation based on CPI-Combined - Headline | 4.8 | 4.8 | 6.2 | 4.0 | 4.5 | 5.0 | | 19 | Inflation based on CPI-Combined - excluding 'Food & Beverages', 'Pan, Tobacco & Intoxicants' and 'Fuel & Light' | 4.8 | 4.7 | 6.5 | 3.8 | 4.4 | 5.2 | | 20 | Inflation based on WPI - All Commodities | 3.6 | 3.5 | 5.0 | 2.6 | 3.0 | 4.3 | | 21 | Inflation based on WPI -Non-food Manufactured Products | 2.8 | 2.8 | 4.2 | 1.0 | 2.2 | 3.5 |
| Table A.3: Quarterly Forecasts from Q1:2017-18 to Q4:2017-18 | | Key Macroeconomic Indicators | Quarterly Forecasts | | Q1: 2017-18 | Q2: 2017-18 | | Mean | Median | Max | Min | Mean | Median | Max | Min | | 1 | GDP at constant (2011-12) prices: Annual Growth (per cent) | 7.2 | 7.2 | 7.6 | 6.7 | 7.3 | 7.3 | 7.8 | 6.3 | | 2 | GVA at constant (2011-12) prices: Annual Growth (per cent) | 6.9 | 6.9 | 7.7 | 6.2 | 7.2 | 7.3 | 7.9 | 6.3 | | a | Agriculture & Allied Activities (growth rate in per cent) | 3.8 | 3.5 | 7.4 | 2.6 | 3.7 | 3.5 | 8.0 | 1.8 | | b | Industry (growth rate in per cent) | 6.8 | 7.0 | 8.9 | 5.0 | 7.2 | 7.0 | 8.6 | 5.5 | | c | Services (growth rate in per cent) | 7.9 | 7.9 | 9.2 | 7.0 | 7.9 | 8.2 | 8.7 | 6.1 | | 3 | PFCE at current prices: Y-on-Y Growth (per cent) | 11.1 | 11.5 | 15.5 | 6.0 | 11.7 | 12.1 | 14.5 | 7.0 | | 4 | GFCF Rate (per cent of GDP at current market prices) | 28.4 | 28.0 | 32.5 | 26.5 | 27.8 | 27.6 | 30.5 | 25.7 | | 5 | IIP (2011-12=100): Quarterly Average Growth (per cent) | 3.8 | 3.9 | 5.1 | 2.4 | 4.8 | 4.7 | 6.5 | 2.7 | | 6 | Merchandise Exports - BoP basis (in US$ bn.) | 72.8 | 73.0 | 78.0 | 66.0 | 73.4 | 73.8 | 79.1 | 66.9 | | 7 | Merchandise Imports - BoP basis (in US$ bn.) | 103.8 | 103.7 | 112.0 | 89.4 | 105.4 | 106.4 | 115.5 | 90.0 | | 8 | Rupee - US_Dollar Exchange rate (RBI reference rate) (end-period) | 64.9 | 64.6 | 67.8 | 64.0 | 65.0 | 65.0 | 67.3 | 59.5 | | 9 | Crude Oil (Indian basket) price (US $ per barrel) (end-period) | 52.1 | 52.0 | 57.0 | 49.9 | 53.9 | 53.0 | 57.0 | 49.0 | | 10 | Repo Rate (end-period) | 6.24 | 6.25 | 6.25 | 6.00 | 6.19 | 6.25 | 6.25 | 6.00 | | 11 | Cash Reserve Ratio (end-period) | 4.00 | 4.00 | 4.00 | 4.00 | 4.05 | 4.00 | 5.00 | 4.00 |
| Key Macroeconomic Indicators | Quarterly Forecasts | | Q3: 2017-18 | Q4: 2017-18 | | Mean | Median | Max | Min | Mean | Median | Max | Min | | 1 | GDP at constant (2011-12) prices: Annual Growth (per cent) | 7.5 | 7.4 | 7.7 | 7.0 | 7.6 | 7.5 | 9.1 | 7.2 | | 2 | GVA at constant (2011-12) prices: Annual Growth (per cent) | 7.2 | 7.1 | 7.7 | 6.4 | 7.5 | 7.4 | 9.0 | 6.8 | | a | Agriculture & Allied Activities (growth rate in per cent) | 3.7 | 3.9 | 5.7 | 1.7 | 3.8 | 3.5 | 6.0 | 2.0 | | b | Industry (growth rate in per cent) | 7.4 | 7.4 | 9.5 | 5.3 | 7.8 | 8.0 | 10.9 | 5.8 | | c | Services (growth rate in per cent) | 8.4 | 8.3 | 9.2 | 7.2 | 8.6 | 8.5 | 10.3 | 7.2 | | 3 | PFCE at current prices: Y-on-Y Growth (per cent) | 11.8 | 12.0 | 15.0 | 7.5 | 12.7 | 13.2 | 16.3 | 7.6 | | 4 | GFCF Rate (per cent of GDP at current market prices) | 27.8 | 27.3 | 31.9 | 25.8 | 27.9 | 27.4 | 32.0 | 24.9 | | 5 | IIP (2011-12=100): Quarterly Average Growth (per cent) | 5.3 | 5.6 | 6.7 | 3.3 | 5.8 | 5.5 | 7.9 | 3.8 | | 6 | Merchandise Exports - BoP basis (in US$ bn.) | 73.9 | 73.6 | 80.5 | 67.5 | 77.0 | 75.6 | 84.8 | 68.5 | | 7 | Merchandise Imports - BoP basis (in US$ bn.) | 108.5 | 109.3 | 118.5 | 91.5 | 109.4 | 109.3 | 122.0 | 90.5 | | 8 | Rupee - US_Dollar Exchange rate (RBI reference rate) (end-period) | 65.7 | 65.5 | 68.6 | 61.0 | 65.8 | 66.0 | 68.0 | 61.0 | | 9 | Crude Oil (Indian basket) price (US $ per barrel) (end-period) | 53.8 | 53.8 | 60.0 | 50.0 | 53.3 | 53.0 | 60.0 | 50.0 | | 10 | Repo Rate (end-period) | 6.18 | 6.25 | 6.25 | 6.00 | 6.18 | 6.25 | 6.25 | 6.00 | | 11 | Cash Reserve Ratio (end-period) | 4.05 | 4.00 | 5.00 | 4.00 | 4.05 | 4.00 | 5.00 | 4.00 |
| Table A.4: Forecasts of CPI-Combined Inflation | | (per cent) | | | CPI Combined Headline | Core CPI Combined (excluding food & fuel) | | Mean | Median | Max | Min | Mean | Median | Max | Min | | Q1:2017-18 | 3.0 | 2.9 | 4.5 | 2.4 | 4.5 | 4.5 | 4.9 | 4.3 | | Q2:2017-18 | 3.7 | 3.6 | 4.9 | 2.2 | 4.9 | 4.8 | 5.6 | 4.4 | | Q3:2017-18 | 4.6 | 4.5 | 6.0 | 2.9 | 4.9 | 4.8 | 6.4 | 4.3 | | Q4:2017-18 | 4.9 | 5.0 | 5.9 | 3.4 | 5.0 | 4.8 | 7.0 | 4.2 |
| Table A.5: Forecasts of WPI Inflation | | (per cent) | | | WPI Headline | WPI-Manufactured Products | | Mean | Median | Max | Min | Mean | Median | Max | Min | | Q1:2017-18 | 3.3 | 3.2 | 5.0 | 2.0 | 2.6 | 2.0 | 5.0 | 1.9 | | Q2:2017-18 | 3.5 | 3.5 | 5.2 | 2.5 | 2.6 | 2.4 | 4.0 | 2.0 | | Q3:2017-18 | 3.7 | 3.7 | 6.0 | 2.4 | 2.4 | 2.1 | 3.8 | 1.7 | | Q4:2017-18 | 2.9 | 3.0 | 5.6 | 0.8 | 2.3 | 2.2 | 3.5 | 0.9 |
| Table A.6: Mean probabilities attached to possible outcomes of Real GVA growth | | Growth Range | Forecasts for 2017-18 | Forecasts for 2018-19 | | 10.0 per cent or more | 0.00 | 0.00 | | 9.5 to 9.9 per cent | 0.00 | 0.00 | | 9.0 to 9.4 per cent | 0.00 | 0.00 | | 8.5 to 8.9 per cent | 0.01 | 0.04 | | 8.0 to 8.4 per cent | 0.06 | 0.22 | | 7.5 to 7.9 per cent | 0.24 | 0.37 | | 7.0 to 7.4 per cent | 0.48 | 0.25 | | 6.5 to 6.9 per cent | 0.17 | 0.10 | | 6.0 to 6.4 per cent | 0.04 | 0.02 | | 5.5 to 5.9 per cent | 0.00 | 0.00 | | 5.0 to 5.4 per cent | 0.00 | 0.00 | | 4.5 to 4.9 per cent | 0.00 | 0.00 | | 4.0 to 4.4 per cent | 0.00 | 0.00 | | 3.5 to 3.9 per cent | 0.00 | 0.00 | | 3.0 to 3.4 per cent | 0.00 | 0.00 | | 2.5 to 2.9 per cent | 0.00 | 0.00 | | 2.0 to 2.4 per cent | 0.00 | 0.00 | | Below 2.0 per cent | 0.00 | 0.00 |
| Table A.7: Mean probabilities attached to possible outcomes of CPI (Combined) inflation | | Inflation Range | Forecasts for March 2018 | Forecasts for March 2019 | | 8.0 per cent or above | 0.00 | 0.00 | | 7.5 to 7.9 per cent | 0.00 | 0.00 | | 7.0 to 7.4 per cent | 0.00 | 0.00 | | 6.5 to 6.9 per cent | 0.00 | 0.00 | | 6.0 to 6.4 per cent | 0.03 | 0.00 | | 5.5 to 5.9 per cent | 0.14 | 0.10 | | 5.0 to 5.4 per cent | 0.17 | 0.20 | | 4.5 to 4.9 per cent | 0.30 | 0.29 | | 4.0 to 4.4 per cent | 0.21 | 0.31 | | 3.5 to 3.9 per cent | 0.13 | 0.07 | | 3.0 to 3.4 per cent | 0.02 | 0.03 | | 2.5 to 2.9 per cent | 0.00 | 0.00 | | 2.0 to 2.4 per cent | 0.00 | 0.00 | | 1.5 to 1.9 per cent | 0.00 | 0.00 | | 1.0 to 1.4 per cent | 0.00 | 0.00 | | 0.5 to 0.9 per cent | 0.00 | 0.00 | | 0 to 0.4 per cent | 0.00 | 0.00 | | Below 0 per cent | 0.00 | 0.00 |
| Table A.8: Annual Average Percentage Change | | | Annual average percentage change over the next five years | Annual average percentage change over the next ten years | | Mean | Median | Max | Min | Mean | Median | Max | Min | | Real GVA | 7.75 | 7.70 | 8.73 | 7.00 | 8.07 | 8.00 | 10.00 | 7.00 | | CPI Combined | 4.66 | 4.70 | 5.00 | 3.80 | 4.36 | 4.20 | 5.00 | 3.50 |
|