8.1 Integration of financial markets is a process of unifying markets and enabling convergence of risk-adjusted returns on the assets of similar maturity across the markets. The process of integration is facilitated by an unimpeded access of participants to various market segments. Financial markets all over the world have witnessed growing integration within as well as across boundaries, spurred by deregulation, globalisation and advances in information technology. Central banks in various parts of the world have made concerted efforts to develop financial markets, especially after the experience of several financial crises in the 1990s. As may be expected, financial markets tend to be better integrated in developed countries. At the same time, deregulation in emerging market economies (EMEs) has led to removal of restrictions on pricing of various financial assets, which is one of the pre-requisites for market integration. Capital has become more mobile across national boundaries as nations are increasingly relying on savings of other nations to supplement the domestic savings. Technological developments in electronic payment and communication systems have substantially reduced the arbitrage opportunities across financial centres, thereby aiding the cross border mobility of funds. Changes in the operating framework of monetary policy, with a shift in emphasis from quantitative controls to price-based instruments such as the short-term policy interest rate, brought about changes in the term structure of interest rates. This has contributed to the integration of various financial market segments. Harmonisation of prudential regulations in line with international best practices, by enabling competitive pricing of products, has also strengthened the market integration process.
8.2 Integrated financial markets assume vital importance for several reasons. First, integrated markets serve as a conduit for authorities to transmit important price signals (Reddy, 2003). Second, efficient and integrated financial markets constitute an important vehicle for promoting domestic savings, investment and consequently economic growth (Mohan, 2005). Third, financial market integration fosters the necessary condition for a country’s financial sector to emerge as an international or a regional financial centre (Reddy, 2003). Fourth, financial market integration, by enhancing competition and efficiency of intermediaries in their operations and allocation of resources, contributes to financial stability (Trichet, 2005). Fifth, integrated markets lead to innovations and cost effective intermediation, thereby improving access to financial services for members of the public, institutions and companies alike (Giannetti et al., 2002). Sixth, integrated financial markets induce market discipline and informational efficiency. Seventh, market integration promotes the adoption of modern technology and payment systems to achieve cost effective financial intermediation services.
8.3 An important objective of reforms in India has been to integrate the various segments of the financial market for bringing about a transformation in the structure of markets, reducing arbitrage opportunities, achieving higher level of efficiency in market operation of intermediaries and increasing efficacy of monetary policy in the economy (Reddy, 1999, 2005d). Efficient allocation of funds across the financial sector and uniformity in the pricing of various financial products through greater inter-linkages of financial markets has been the basic emphasis of monetary policy (Mohan, 2005). In the domestic sphere, integration of markets has been pursued through strengthening competition, financial deepening with innovative instruments, easing of restrictions on flows or transactions, lowering of transaction costs and enhancing liquidity. Financial markets in India have also increasingly integrated with the global financial system as a result of calibrated and gradual capital account liberalisation in keeping with the underlying macroeconomic developments, the state of readiness of the domestic financial system and the dynamics of international financial markets (Reddy, 2005a).
8.4 In the above backdrop, this chapter examines in detail the various aspects of integration of financial markets within the country as well as with international financial markets. The chapter is organised in six sections. Section I provides a brief review of the concept of financial integration along with a discussion on measurement issues. The policy measures enabling financial market integration in India are discussed in Section II. Empirical analysis of domestic financial market integration is presented in Section III. Integration of domestic financial markets with international as well as regional financial markets is set out in Section IV. Section V suggests some measures for further strengthening the integration process of the markets. Concluding observations are set out inSection VI.
I. CONCEPT AND DIMENSIONS OF FINANCIAL
MARKET INTEGRATION
8.5 Financial market integration encompasses a complex interplay of various factors such as policy initiatives, structure and growth of financial intermediaries/markets, organic linkages among market participants and the preference of savers and investors for financial instruments. While assessing the integration of financial markets, it may be useful to keep in view the heterogeneity of markets, dimensions of integration, measurement issues and perceived benefits and risks of integration.
Heterogeneity of Markets
8.6 Various financial market segments are not uniform as they trade in a variety of instruments, which differ in terms of risk and liquidity. First, some market segments are national, whereas others are international in nature, depending on where financial transactions occur among participants within a country’s geographic boundary or across the border. Generally, money and credit market segments involving participation of banks and other financial institutions operating within a country’s boundary are national in character. On the other hand, foreign exchange markets dealing with cross-border transactions and stock markets with cross-listings of securities and participation of foreign institutional investors are international in nature. Second, financial markets differ in terms of depth and liquidity. For instance, money market instruments are more liquid, while bonds in the capital markets are less liquid. Third, financial markets differ in terms of economic nature of instruments catering to various needs of economic agents. For instance, a distinction can be made between saving, investment, credit and derivative instruments. Fourth, financial markets are differentiated in terms of risk profile of instruments such as government bonds, which do not involve default and credit risks, and corporate bonds, which are relatively more risky in nature. Integration of market segments, thus, reflects an investor’s attitude towards risk and the trade-off between risk and return on assets. Fifth, market participants in different financial markets could be different such as banks, non-bank financial institutions, including mutual funds, insurance companies, mortgage institutions and specialised long-term financial institutions.
8.7 Financial market integration at the theoretical level has been postulated in several ways. The most popular economic principles of financial integration include the law of one price, term structure of interest rates, parity conditions such as purchasing power parity, covered and uncovered interest parity conditions, capital asset price model, arbitrage price theory and Black-Scholes’ principle of pricing derivatives (Box VIII.1).
Dimensions of Financial Market Integration
8.8 Broadly, financial market integration occurs in three dimensions, nationally, regionally and globally (Reddy, 2002 and BIS, 2006). From an alternative perspective, financial market integration could take place horizontally and vertically. In the horizontal integration, inter-linkages occur among domestic financial market segments, while vertical integration occurs between domestic markets and international/ regional financial markets (USAID, 1998).
8.9 Domestic financial market integration entails horizontal linkages of various segments, reflecting portfolio persification by savers, investors and intermediaries. Under horizontal integration, market interest rates typically revolve around a basic reference rate, which is defined as the price of a short-term low-risk financial instrument in a competitive and liquid market. It typically provides the basic liquidity for the formal financial system and central banks often use it to gauge the tightness of monetary policy. Domestic markets may be closely integrated because intermediaries operate simultaneously in various market segments; for instance, commercial banks operate in both the saving (deposit) and loan markets.
8.10 Global integration refers to the opening up of domestic markets and institutions to the free cross-border flow of capital and financial services by removing barriers such as capital controls and withholding taxes. A deeper dimension of global integration entails removing obstacles to movement of people, technology and market participants across border (BIS, 2006). Global integration is promoted through harmonisation of national standards and laws, either through the adoption of commonly agreed minimum standards or the mutual recognition of standards (Reddy, 2005c).
8.11 Regional financial integration occurs due to ties between a given region and the major financial centre serving that region. Economic integration might be easier to achieve at a regional level due to network externalities and the tendency of market makers to concentrate in certain geographical centres. Gravity models, which take into account the economic sizes and distance between two countries, explain bilateral trade and investment flows. Furthermore, regional financial integration can be an important means of developing local financial markets, for instance, through peer pressure to strengthen institutions and upgrade local practices (BIS, 2006).
Box VIII.1
Theory of Financial Market Integration
The law of one price (LOOP), pioneered by Augustin Cournot (1927) and Alfred Marshall (1930), constitutes the fundamental principle underlying financial market integration. According to the LOOP, in the absence of administrative and informational barriers, risk-adjusted returns on identical assets should be comparable across markets. While the LOOP provides a generalised framework for financial market integration, finance literature provides alternative principles, which establish operational linkages among different financial market segments. First, the term structure of interest rates, deriving from paradigms of unbiased expectations, liquidity preference, and market segmentation, establishes integration across the maturity spectrum, i.e., short, medium and long ends of the financial market (Blinder, 2004). Usually, the term structure is applied to a particular instrument such as the risk free government securities. In the monetary economics literature, it is recognised that the term structure of interest rate contains useful information about future paths of inflation and growth, which characterise the objective function of policy in most countries. Second, the capital asset pricing model (CAPM) of Nobel laureate, William Sharpe (1964) is used widely for valuing systematic risk to financial assets. The CAPM establishes linkage between market instruments and risk free instruments such as government securities. The CAPM envisages a simplified world with no taxes and transaction costs, and identical investors. In such a world, super-efficient portfolio must be the market portfolio (Tobin, 1958). All investors will hold the market portfolio; leveraging or de-leveraging would be driven by the risk-free asset in order to achieve a desired level of risk and return. Third, the Black-Scholes’ principle of option pricing postulates linkage between derivative products on the one hand, and cash/spot market of underlying assets on the other. The often quoted put-call parity principle in finance theory states that in the absence of arbitrage opportunities, a derivative instrument can be replicated in terms of spot price of an underlying asset, coupled with some borrowing or lending activity. The forward-spot parity relation is used widely for analysing linkages between foreign exchange forwards and the money market instruments.
Beyond economic and financial principles, financial markets integration could also occur due to information efficiency as economic agents form expectations about the future course of policy and real sector developments. For instance, even if transactions between residents and non-residents and between markets and intermediaries remain incomplete or limited due to regulatory barriers, participants could form expectation that such restrictions would not continue for long with a shift in policy regime towards greater opening and liberalisation of markets over time.
Measures of Financial Integration
8.12 The progress of domestic, global and regional financial integration could be measured using a number of approaches. Generally, these measures are pided into three categories: institutional/regulatory measures, quantity and price based measures. From a policy perspective, specific indicators of financial integration could be classified into de jure and de facto measures. The existence of legal restrictions on trade and capital flows across border as well as market segments is the most frequently used de jure indicators. However, these indicators have several shortcomings as restrictions may not be binding, or they are not respected because capital flows would not exist somehow. They may not cover a specific aspect of all possible impediments to financial integration (Prasad et al., 2006). Moreover, in practice, de jure indicators adopting a dichotomous scheme of the existence or absence of restrictions may not reveal actual degree of openness of countries to capital flows.
8.13 De facto indicators of financial integration are usually based either on prices or quantities. The commonly used price based measures for gauging price equalisation and convergence of market segments include cross-market spreads, correlation among various interest rates, tests of common trend in the term structure of interest rates and volatility transmission. From a policy perspective, interest rate spreads between the official short-term rate and a benchmark short-term market instrument on the one hand, and various other market interest rates on the other, are used for measuring price convergence and effectiveness of policy. Price-related measures also include covered and uncovered interest rate parity as well as asset price correlations between countries. There are, however, serious practical problems in using prices to measure global or regional financial integration, particularly in emerging markets. This is because prices may move together because of a common external factor or because of similar macroeconomic fundamentals and not because of market integration. Moreover, prices may be affected by differences in currency, credit and liquidity risks, implying different price movements even if there is a substantial degree of financial integration (Prasad et al., 2006).
8.14 Liquidity and turnover data are used as quantitative indicators for measuring inter-linkages among domestic financial market segments. For global integration, capital flows indicate whether a country is becoming more or less financially integrated over time. In this context, gross capital flows are a among various interest rates, tests of common trend in the term structure of interest rates and volatility transmission. From a policy perspective, interest rate spreads between the official short-term rate and a benchmark short-term market instrument on the one hand, and various other market interest rates on the other, are used for measuring price convergence and effectiveness of policy. Price-related measures also include covered and uncovered interest rate parity as well as asset price correlations between countries. There are, however, serious practical problems in using prices to measure global or regional financial integration, particularly in emerging markets. This is because prices may move together because of a common external factor or because of similar macroeconomic fundamentals and not because of market integration. Moreover, prices may be affected by differences in currency, credit and liquidity risks, implying different price movements even if there is a substantial degree of financial integration (Prasad et al., 2006).
Benefits and Risks of Financial Integration
8.15 Though financial integration provides several benefits, it also involves various risks. The benefits and costs of financial market integration depend on the degree of domestic financial market integration, international financial integration and financial development. Evaluating the benefits and risks of financial market integration is a complex issue, in particular, in an economy with open capital account (Box VIII.2).
Box VIII.2
Benefits and Risks of Financial Integration
The benefits of global integration depend on size, composition, and quality of capital flows. Global financial integration involves direct and indirect or collateral benefits (Prasad et al,. 2006). Analytical arguments supporting financial openness revolve around main considerations such as the benefits of international risk sharing for consumption smoothing, the positive impact of capital flows on domestic investment and growth, enhanced macroeconomic discipline and increased efficiency as well as greater stability of the domestic financial system associated with financial openness (Agenor, 2001). International financial integration could positively affect total factor productivity (Levine, 2001). Financial openness may increase the depth and breadth of domestic financial markets and lead to an increase in the degree of efficiency of the financial intermediation process by lowering costs and excessive profits associated with monopolistic and cartelised markets, thereby lowering the cost of investment and improving the resource allocation (Levine, 1996; Caprio and Honhan, 1999). Empirical studies on international integration offer mixed perspectives on the benefits of financial integration. The cumulative growth performance of emerging markets, excluding China and India, appears less spectacular than usually perceived under globalisation (Prasad et al., 2006). Financial market integration also poses some risks and entails costs. A major risk is that of contagion, which was evident in the case of East Asian crisis. There are two channels through which the contagion normally works. One, the real channel, which relates to potential for ‘domino effects’ through real exposures on participants operating in other segments. Two, the information channel which relates to contagious withdrawals due to lack of accurate and timely information. Increased domestic and international integration accentuates the risk of contagion as problems in one market segment are likely to be transmitted to other markets with the potential to cause systemic instability.
In the context of globalisation, potential costs include the high degree of concentration of capital flows, misallocation of flows, which may hamper their growth effects and exacerbate domestic distortions; the loss of macroeconomic stability; the pro-cyclical nature of short-term capital flows and the risk of abrupt reversals; a high degree of volatility of capital flows, which relates in part to herding and contagion effects; and risks associated with foreign bank penetration (Dadush, Dasgupta and Ratha; 2000). Most studies find that direct investment tends to be less volatile than other forms of capital flows (Chuhan et al., 1996; Brewer and Nollen, 2000; Sarno and Taylor, 1999). Volatility of capital flows translates into exchange rate instability (under flexible exchange rate) or large fluctuations in official reserves (under a pegged exchange rate regime) and sometimes currency crises as was observed in the East Asian crisis. For instance, nominal exchange rate volatility may hamper expansion of exports if appropriate hedging techniques are not available to exporters. Large capital inflows could also lead to rapid monetary expansion (due to the difficulty and cost of pursuing aggressive sterilisation policies), inflationary pressures (resulting from the effect of capital inflows on domestic spending), real exchange rate appreciation and widening of current account deficits.
8.16 In recent years, there appears to be some rethinking about financial globalisation based on the experience of various crises in the late 1990s and the current global imbalances (Reddy, 2005b). Owing to contagion effects, some economists have viewed increasing capital account liberalisation and unfettered capital flows as a serious impediment to global financial stability (Rodrik, 1998; Bhagwati, 1998; and Stiglitz, 2002). Others argue that increased capital account openness has largely proven essential for countries aiming to upgrade from lower to middle-income status (Prasad et al., 2006). In order to benefit from international capital inflows, host countries need to pursue sound macroeconomic policies, develop strong institutions and adopt an appropriate regulatory framework for the stability of financial systems and sustained economic progress (Reddy, 2003 and 2005).
8.17 There is growing realisation that unlike trade integration, where benefits to all countries are demonstrable, in the case of financial integration, a ‘threshold’ in terms of preparedness and resilience of the economy is important for a country to get full benefits (Kose et al., 2006). A judgemental view needs to be taken whether and when a country has reached the ‘threshold’. The nature of optimal integration is highly country-specific and contextual. Financial integration needs to be approached cautiously, preferably within the framework of a plausible roadmap that is drawn up embodying the country-specific context and institutional features. On balance, there appears to be a greater advantage in well-managed and appropriate integration into the global process, which implies not large-scale but more effective interventions by the authorities. In fact, markets do not and cannot exist in a vacuum, i.e., without some externally imposed rules and such order is a result of public policy (Reddy, 2006b). Thus, with a view to enhancing financial sector efficiency, it is necessary not only to foster competition among institutions but also to develop a system that facilitates transparent and symmetric dissemination of maximum information to the markets.
II. POLICY MEASURES ENABLING MARKET
INTEGRATION IN INDIA
8.18 Until the early 1990s, India’s financial sector was tightly controlled. Interest rates in all market segments were administered. The flow of funds between various market segments was restricted by extensive micro-regulations. There were also restrictions on participants operating in different market segments. Banks remained captive subscribers to government securities under statutory arrangements. The secondary market of government securities was dormant. In the equity market, new equity issues were governed by several complex regulations and restrictions. The secondary market trading of such equities lacked transparency and depth. The foreign exchange market remained extremely shallow as most transactions were governed by inflexible and low limits under exchange regulation and prior approval requirements. The exchange rate was linked to a basket of currencies. Although the financial sector grew considerably in the regulated environment, it could not achieve the desired level of efficiency. Compartmentalisation of activities of different types of financial intermediaries eliminated the scope for competition among existing financial intermediaries (Mohan, 2004b).
8.19 Financial markets reform initiated in the early 1990s focused on removal of structural bottlenecks, introduction of new players/instruments, free pricing of financial assets, relaxation of quantitative restrictions, improvement in trading, clearing and settlement practices and greater transparency (Mohan, 2004b, 2006). Other policy initiatives in the money, the foreign exchange, the government securities and the equity markets were aimed at strengthening institutions, greater transparency, encouraging good market practices, effective payment and settlement mechanism, rationalised tax structures and enabling legislative framework. Dismantling of various price and non-price controls in the financial system has facilitated the integration of financial markets. While various measures initiated to develop the markets have been delineated in the respective chapters, some measures, in particular, facilitated the integration of markets (Box VIII.3).
III. DOMESTIC FINANCIAL MARKET
INTEGRATION IN INDIA
8.20 Broadly, India’s domestic financial market comprises the money market, the credit market, the government securities market, the equity market, the corporate debt market and the foreign exchange market, each of which has been addressed at length in the previous chapters. The channels of integration among various market segments differ. For instance, the Indian money and the foreign exchange markets are intrinsically linked in view of the presence of commercial banks’ and the short-term nature of both markets. The linkage is established through various channels such as banks borrowing in overseas
Box VIII.3
Measures Enabling Financial Market Integration in India
Broadly, integration of financial markets in India has been facilitated by various measures in the form of free pricing, widening of participation base in markets, introduction of new instruments and improvements in payment and settlement infrastructure.
Free Pricing
• Free pricing in financial markets was facilitated by various measures. These include, inter alia, freedom to banks to decide interest rate on deposits and credit; withdrawal of a ceiling of 10 per cent on call money rate imposed by the Indian Banks’ Association in 1989; replacement of administered interest rates on government securities by an auction system; abolition of the system of ad hoc Treasury Bills in April 1997 and replacement by the system of Ways and Means Advances (WMAs) with effect from April 1, 1997; shift in the exchange rate regime from a single-currency fixed-exchange rate system to a market-determined floating exchange rate regime; gradual liberalisation of the capital account in line with the recommendations of the Committee on Capital Account Convertibility (Chairman: Shri S. S. Tarapore) (see Chapter VI on Foreign Exchange Market); and freedom to banks to determine interest rates (subject to a ceiling) and maturity period of Foreign Currency Non-Resident (FCNR) deposits (not exceeding three years); and to use derivative products for hedging risk.
• In the capital market, the Capital Issues (Control) Act, 1947 was repealed. The introduction of the book-building process in the new issue market strengthened the price discovery process.
Widening Participation
• Enhanced presence of foreign banks, in line with India’s commitment to the World Trade Organisation under GATS, strengthened domestic and international markets inter-linkages, apart from increasing competition.
• Initially, the participation in the call market was gradually widened by including non-banks such as financial institutions, non-banking financial companies, primary/satellite dealers, mutual funds and corporates (through primary dealers). The process of transformation of the call money market into a pure inter-bank market, which commenced from May 2001, was completed in August 2005.
• Foreign Institutional Investors (FIIs) were allowed to participate in the Indian equity market and set up 100 per cent debt funds to invest in government (Central and State) dated securities in both the primary and secondary markets. This provided a major thrust to the integration of domestic markets with international markets.
• The linkage between the domestic foreign exchange market and the overseas market (vertical integration) was facilitated by allowing banks/authorised dealers (ADs) to borrow and invest funds abroad (subject to certain limits), and to lend in foreign currency to companies in India for any productive purpose, giving them the choice to economise on interest cost and exchange risk. Exporters also have the ability to substitute rupee credit for foreign currency credit.
• Indian companies were permitted to raise resources from abroad, through American/Global Depository Receipts (ADRs/ GDRs), foreign currency convertible bonds (FCCBs) and external commercial borrowings (ECBs), thus, facilitating integration of domestic capital market with international capital market. The Reserve Bank allowed two-way fungibility of ADRs/GDRs in February 2002.
• Corporates were allowed to undertake active hedging operations by resorting to cancellation and rebooking of forward contracts, booking forward contracts based on past performance, using foreign currency options and forwards, and accessing foreign currency-rupee swap to manage longer-term exposures arising out of external commercial borrowings.
•Integration of the credit market and the equity market was strengthened by application of capital adequacy norms and allowing public sector banks to raise capital from the equity market up to 49 per cent of their paid-up capital.
New Instruments
• Repurchase agreement (repo) was introduced as a tool of short-term liquidity adjustment. The liquidity adjustment facility (LAF) is open to banks and primary dealers. The LAF has emerged as a tool for both liquidity management and also signalling device for interest rates in the overnight market. Several new financial instruments such as inter-bank participation certificates (1988), certificates of deposit (June 1989), commercial paper (January 1990) and repos (December 1992) were introduced. Collateralised borrowing and lending obligation (CBLO) and market repos have also emerged as money market instruments.
• New auction-based instruments were introduced for 364-day, 182-day, 91-day and 14-day Treasury Bills, the zero coupon bond and government of India dated securities. In the long-term segment, Floating Rate Bonds (FRBs) benchmarked to the 364-day Treasury Bills yields and a 10-year loan with embedded call and put options exercisable on or after 5 years from the date of issue were introduced.
• Derivative products such as forward rate agreements and interest rate swaps were introduced in July 1999 to enable banks, FIs and PDs to hedge interest rate risks. A rupee-foreign currency swap market was developed. ADs in the foreign exchange market were permitted to use cross-currency options, interest rate and currency swaps, caps/collars and forward rate agreements (FRAs) in the international foreign exchange market, thereby facilitating the deepening of the market and enabling participants to persify their risk.
Institutional Measures
• Institutions such as Discount and Finance House of India (DFHI), Securities Trading Corporation of India (STCI) and PDs were allowed to participate in more than one market, thus strengthening the market inter-linkages.
• The Clearing Corporation of India Ltd. (CCIL) was set up to act as a central counter-party to all trades involving foreign exchange, government securities and other debt instruments routed through it and to guarantee their settlement.
Technology, Payment and Settlement Infrastructure
• The Delivery-versus-Payment system (DvP), the Negotiated Dealing System (NDS) and subsequently, the advanced Negotiated Dealing System – Order Matching (NDS-OM) trading module and the real time gross settlement system (RTGS) have brought about immense benefits in facilitating transactions and improving the settlement process, which have helped in the integration of markets.
• In the equity market, the floor-based open outcry trading system was replaced by electronic trading system in all the stock exchanges. markets, providing hedging facilities to corporates, accepting foreign currency deposits and acting as conduit for making payments for overseas merchant transactions. The linkage between the call money and the government securities markets exists, as at times, large positions in government securities are funded through short-term borrowings. The foreign exchange market and the equity markets are linked through the operations of foreign institutional investors. The emerging linkages among the money, the government securities and the foreign exchange markets have at times necessitated the use of short-term monetary measures by the Reserve Bank for meeting demand-supply mismatches to curb volatility.
Phases of Market Integration in India
8.21 Various segments of financial markets have become better integrated in the reform period, especially from the mid-1990s (Chart VIII.1). As reforms in the financial markets progressed, linkages amongst various segments of market and between domestic and international markets improved. For the purpose of analysis, financial market linkages could be pided into two distinct phases. The first phase refers to the early transition period of the 1990s and the second phase is the period of relative stability in the financial markets from 2000 onwards.
8.22 In the first phase, domestic financial markets witnessed modest integration. Financial markets, in general, lacked depth as measured by the turnover in various market segments (Table 8.1). Domestic financial markets during this phase witnessed easing of various restrictions, which created enabling conditions for increased inter-linkages amongst market segments. The institution of a market-based exchange rate mechanism in March 1993 and transition to current account convertibility in August 1994 facilitated inter-linkages between the money and the foreign exchange markets. Since the beginning of second half of the 1990s, some episodes of volatility were witnessed in the money and the foreign exchange markets, which underscored the gradual integration of the domestic money market and the foreign exchange market.
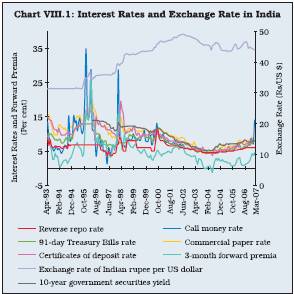
Table 8.1: Depth of Financial Markets in India - Average Daily Turnover |
(Rupees crore) |
|
|
|
|
|
|
Year |
Money |
Government |
Foreign Exchange |
Equity Market** |
Equity Derivatives |
|
Market* |
Securities Market |
Market # |
(Cash Segment) |
at NSE |
1 |
2 |
3 |
4 |
5 |
6 |
1991-92*** |
6,579 |
391 |
– |
469 |
– |
2000-01 |
40,923 |
2,802 |
21,198 |
9,308 |
11 |
2001-02 |
65,500 |
6,252 |
23,173 |
3,310 |
410 |
2002-03 |
76,722 |
7,067 |
24,207 |
3,711 |
1,752 |
2003-04 |
28,146 |
8,445 |
30,714 |
6,309 |
8,388 |
2004-05 |
31,832 |
4,826 |
39,952 |
6,556 |
10,107 |
2005-06 |
39,997 |
3,643 |
56,391 |
9,504 |
19,220 |
2006-07 |
56,413 |
4,863 |
83,894 |
11,760 |
29,803 |
* : Including the call money, the notice money, the term money and the repo markets. The turnover in the CBLO segment was Rs.6,698 crore
in 2004-05, Rs. 20,040 crore in 2005-06 and Rs. 32,390 crore in 2006-07.
** : Includes both BSE and NSE turnover.
*** : Data for the government securities market and the equity market pertain to 1995-96.
# : Inter-bank turnover only.
– : Not available.
Source : Reserve Bank of India; Bombay Stock Exchange Limited; and National Stock Exchange of India Limited. |
8.23 Financial markets in India felt the initial impulses of the contagion from financial crises in the East Asian countries, which erupted in the second half of 1997-98. Pressures from contagion re-emerged in the mid-November 1997, following the weakening of the sentiment in response to financial crisis spreading to hit South Korea and far off Latin American markets. The East Asian crisis necessitated policy action by the Reserve Bank to mitigate excess demand conditions in the foreign exchange market. It also moved to siphon off excess liquidity from the system in order to reduce the scope for arbitrage between the easy money market and the volatile foreign exchange market. Foreign currency operations were undertaken in the third quarter of 1997-98 to curb volatility in the exchange rate. This helped in maintaining stability in the exchange rate of the rupee, but resulted in reduced money market support to the government borrowing, leading to an increase in the Centre’s monetised deficit. The Reserve Bank tightened its monetary policy stance by raising the CRR and the Bank Rate, thus, substituting cheap discretionary liquidity with expensive discretionary liquidity. A host of monetary policy actions were taken to tighten liquidity in November and December 1997 and January 1998.1 Monetary policy tightening measures in the wake of East Asian crisis led to hardening of domestic interest rates across various segments in the money market and the government securities market, especially at the short-end. Restoration of stability in the domestic financial markets in the second half of 1998, especially in the foreign exchange market, led the Reserve Bank to ease some of the monetary policy tightening measures undertaken earlier. Several banks reduced their lending and deposit rates in response to the Bank Rate cut as also in line with seasonal trends.
8.24 The second phase, beginning 2000 onwards, reflects the period of broad stability in financial markets with intermittent episodes of volatility. The process of financial market integration was more pronounced during this phase. A growing integration between the money, the gilt and the foreign exchange market segments was visible in the convergence of financial prices, within and among various segments and co-movement in interest rates. The capital market exhibited generally isolated behaviour from the other segments of domestic financial markets. However, there was a clear indication of growing cross-border integration as the domestic stock markets declined sharply in line with the sharp decline in international technology stock driven exchanges in 2001. On several other occasions also, the Indian equity markets tended to move in tandem with major international stock markets.
8.25 Growing integration of financial markets beginning 2000 could be gauged from cross correlation among various market interest rates. The correlation structure of interest rates reveals several notable features of integration of specific market segments (Table 8.2). First, in the money market segment, there is evidence of stronger correlation among interest rates in the more recent period 2000-06 than the earlier period 1993-2000, suggesting the impact of policy initiatives undertaken for financial deepening. The enhanced correlation among interest rates also indicates improvement in efficiency in the operations of financial intermediaries trading in different instruments. Second, the high correlation between risk free and liquid instruments such as Treasury Bills, which serve as benchmark instruments, and other market instruments such as certificates of deposit (CDs) and commercial papers (CPs) and forward exchange premia, underlines the efficiency of the price discovery process. Third, the sharp improvement in correlation between the reverse repo rate and money market rates in the recent period implies enhanced effectiveness of monetary policy transmission. Fourth, the high degree of correlation between long-term government bond yield and short-term Treasury Bills rate indicates the significance of term-structure of interest rates in financial markets. Fifth, the correlation between interest rates in money markets and three-month forward premia was significantly high, indicating relatively high horizontal integration. Integration of the foreign exchange market with the money market and the government securities market has facilitated closer co-ordination of monetary and exchange rate policies. The consequences of foreign exchange market intervention are kept in mind in monetary management which includes constant monitoring of the supply of banking system liquidity and an active use of open market operations to adjust liquidity conditions. Sixth, the equity market appears to be segmented with relatively low and negative correlation with money market segments.
1 See Chapter VI for details.
Table 8.2: Correlation Among Major Financial Markets |
(April 1993 to March 2000) |
Instrument |
RREPO |
Call |
TB91 |
TB364 |
Yield10 |
CDs |
CPs |
FR1 |
FR3 |
FR6 |
EXCH |
LBSES |
1 |
2 |
3 |
4 |
5 |
6 |
7 |
8 |
9 |
10 |
11 |
12 |
13 |
RREPO |
1.00 |
|
|
|
|
|
|
|
|
|
|
|
|
Call |
0.35 |
1.00 |
|
|
|
|
|
|
|
|
|
|
|
TB91 |
0.44 |
0.61 |
1.00 |
|
|
|
|
|
|
|
|
|
|
TB364 |
0.32 |
0.40 |
0.90 |
1.00 |
|
|
|
|
|
|
|
|
|
Yield10 |
0.04 |
0.46 |
0.57 |
0.49 |
1.00 |
|
|
|
|
|
|
|
|
CDs |
0.30 |
0.32 |
0.45 |
0.41 |
0.38 |
1.00 |
|
|
|
|
|
|
|
CPs |
0.39 |
0.54 |
0.81 |
0.75 |
0.57 |
0.71 |
1.00 |
|
|
|
|
|
FR1 |
0.27 |
0.80 |
0.45 |
0.33 |
0.46 |
0.47 |
0.63 |
1.00 |
|
|
|
|
FR3 |
0.28 |
0.68 |
0.47 |
0.32 |
0.56 |
0.58 |
0.65 |
0.97 |
1.00 |
|
|
|
FR6 |
0.30 |
0.61 |
0.48 |
0.36 |
0.60 |
0.62 |
0.68 |
0.91 |
0.98 |
1.00 |
|
|
EXCH |
0.03 |
-0.04 |
-0.23 |
-0.38 |
-0.06 |
-0.19 |
-0.31 |
-0.25 |
0.12 |
0.13 |
1.00 |
|
LBSES |
-0.37 |
-0.10 |
-0.24 |
-0.34 |
-0.05 |
-0.40 |
-0.28 |
-0.32 |
-0.28 |
-0.30 |
0.35 |
1.00 |
(April 2000 to March 2007) |
RREPO |
1.00 |
|
|
|
|
|
|
|
|
|
|
|
|
Call |
0.77 |
1.00 |
|
|
|
|
|
|
|
|
|
|
|
TB91 |
0.85 |
0.88 |
1.00 |
|
|
|
|
|
|
|
|
|
|
TB364 |
0.83 |
0.85 |
0.99 |
1.00 |
|
|
|
|
|
|
|
|
|
Yield10 |
0.79 |
0.79 |
0.96 |
0.98 |
1.00 |
|
|
|
|
|
|
|
|
CDs |
0.75 |
0.88 |
0.93 |
0.92 |
0.89 |
1.00 |
|
|
|
|
|
|
|
CPs |
0.80 |
0.85 |
0.96 |
0.94 |
0.92 |
0.95 |
1.00 |
|
|
|
|
|
FR1 |
0.57 |
0.64 |
0.58 |
0.52 |
0.51 |
0.61 |
0.66 |
1.00 |
|
|
|
|
FR3 |
0.59 |
0.58 |
0.60 |
0.54 |
0.54 |
0.62 |
0.70 |
0.97 |
1.00 |
|
|
|
FR6 |
0.60 |
0.56 |
0.60 |
0.55 |
0.56 |
0.63 |
0.71 |
0.93 |
0.99 |
1.00 |
|
|
EXCH |
0.27 |
0.06 |
0.08 |
0.04 |
0.06 |
0.14 |
0.21 |
0.51 |
0.61 |
0.66 |
1.00 |
|
LBSES |
-0.19 |
0.01 |
-0.07 |
-0.05 |
-0.11 |
-0.06 |
-0.13 |
-0.39 |
-0.50 |
-0.56 |
-0.69 |
1.00 |
TB91 |
: 91-day Treasury Bills rate. |
|
|
|
RREPO : |
Reverse repo rate. |
|
|
|
Yield10 |
: 10-year government securities yield. |
|
|
Call |
: |
Inter-bank call money rate (weighted average). |
|
CPs |
: Commercial paper rate. |
|
|
|
TB364 |
: |
364-day Treasury Bills rate. |
|
|
|
FR1 |
: 1-month forward exchange premia. |
|
|
CDs |
: |
Certificates of deposit rate. |
|
|
|
FR6 |
: 6-month forward exchange premia. |
|
|
FR3 |
: |
3-month forward premia. |
|
|
|
LBSES |
: Natural logarithm of BSE Sensex. |
|
|
EXCH |
: |
Exchange rate of Indian rupee per US dollar. |
|
Note
: Based on monthly data. |
Segment-wise Integration
Integration of the Government Securities Market
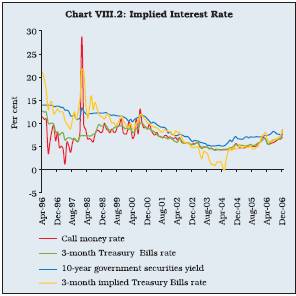
8.26 The existence of a well-developed government securities market is a pre-requisite for a market-based monetary policy and for facilitating financial market integration. The government securities market is also required to develop a domestic rupee yield curve, which could provide a credible benchmark for pricing of securities in other markets. The government securities market is increasingly getting integrated with other market segments as is reflected in the close co-movement of interest rates. As alluded to earlier, a high degree of correlation between long-term government bond yields and short-term Treasury Bills rates in recent years demonstrates the significance of the term-structure of interest rates in the financial market. Furthermore, the movement of 3-month rupee interest rate implied from the forward premia has also moved largely in tandem with the 91-day Treasury Bills rate, barring the redemption phase of Resurgent India Bond when the forward premia turned negative, implying a reasonable level of integration of the government securities market with the foreign exchange market (Chart VIII.2).
8.27 As indicated earlier, the efficiency of monetary policy also hinges on how effectively impulses are transmitted across various financial markets, which in turn, is incidental upon the level of market integration. An improvement in the transmission of impulses was reflected in the sharp moderation in the of the term-structure of interest rates in the financial market. Furthermore, the movement of 3-month rupee interest rate implied from the forward premia has also moved largely in tandem with the 91-day Treasury Bills rate, barring the redemption phase of Resurgent India Bond when the forward premia turned negative, implying a reasonable level of integration of the government securities market with the foreign exchange market (Chart VIII.2).
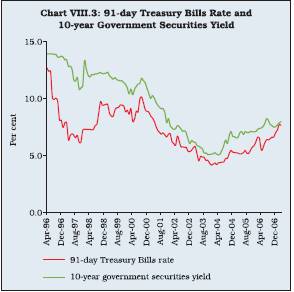
8.27 As indicated earlier, the efficiency of monetary policy also hinges on how effectively impulses are transmitted across various financial markets, which in turn, is incidental upon the level of market integration. An improvement in the transmission of impulses was reflected in the sharp moderation in the term premium in the government securities market, especially the narrowing down of the spread on 10-year government bond yield and Treasury Bills instruments in the recent period (Chart VIII.3). Since long-term interest rates account for a premium charge on liquidity risk and various uncertainties relating to macroeconomic fundamentals such as inflation and growth, the flattening of the yield curve or narrowing of spread between long-term and short-term interest rates points towards a stronger economy and stable financial environment.
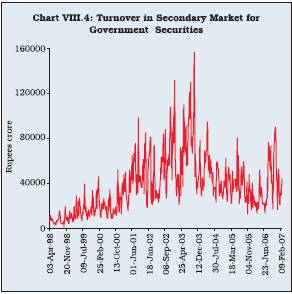
8.28 For effective market integration, it is essential that there exists a deep secondary market for government securities, which provides a benchmark for valuation of other market instruments, and the turnover of the instruments in both primary and secondary markets is fairly large. The turnover in the secondary segment of government securities market, indicating the depth of this market segment, inter alia, is influenced by some key factors such as monetary policy stance, banks’ SLR holding and credit demand by the private sector. This was evident in the rise in turnover in the secondary market for government securities, fuelled by banks’ excess SLR holding during the period of softening interest rates. In the recent period, following the tightening of policy stance and rise in credit demand, banks have reduced SLR holdings close to the prescribed limit. Reduction in volumes in the secondary segment of government securities in the second half of 2006 was mostly due to rise in interest rates apart from demand side factors. The secondary market turnover has, thus, declined in the recent period (Chart VIII.4). This trend, if persists for long, could affect the depth and yield in this segment and consequently pose some challenges for effective market integration. International evidence suggests that banks tend to rebalance their portfolio and reduce their holding of government securities when interest rates rise. For instance, in the US, the proportion of government securities held by commercial banks in total US government securities declined to 1.6 per cent in 2005 from 5.3 per cent in 2003 when the interest rates rose following increase in the Federal Funds Rate from 1.25 per cent in 2003 to 5.0 per cent in 20052 .
Integration of the Credit Market
8.29 The integration of the credit market with other money market segments has become more pronounced in recent years. Sustained credit demand has led to higher demand for funds, exerting some pressure on liquidity. This was reflected in the decline in banks’ investment in government securities and higher activity in all the money market segments such as inter-bank call money, collateralised borrowing and lending obligation (CBLO) and market repo rates. Total volume in these three markets increased from Rs.16,132 crore in March 2005 to Rs.35,024 crore in March 2006 and further to Rs.38,484 crore in February 2007. Banks also resorted to increased issuances in the CDs market to meet their liquidity requirements. Outstanding CDs increased from Rs.12,078 crore in March 2005 to Rs.43,568 crore in March 2006 and further to Rs.77,971 crore by March 2, 2007.
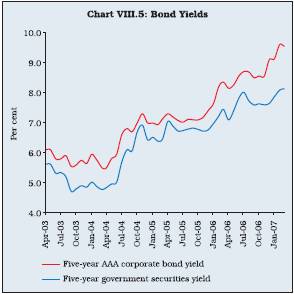
8.30 In the context of credit market integration with other markets, particularly, the benchmark government securities, there is evidence of high correlation between the commercial paper rate and the Treasury Bills rate. Also, the AAA rated 5-year corporate bond yield and government securities yield of corresponding maturity show high co-movement (Chart VIII.5). However, the spread of the AAA rated 5-year corporate bond yield over government securities yield of corresponding maturity has increased in the recent period. Under competitive market condition, the market rate should be equal to risk free rate plus a risk premium3 . Though a simple regression model confirmed the unitary elasticity response of the corporate bond rate to government securities yield, the model was subject to auto-correlated errors, implying some imperfection in the corporate debt market. Furthermore, in an alternative specification using weekly data, it was found that the AAA rated 5-year corporate bond spread over the risk free 91-day Treasury Bills rate could be significantly determined by the term spread, i.e., the spread of 5-year government securities yield over 91-day Treasury Bills rate, and default premia (AAA rated 5-year corporate bond yield less AB rated 5-year corporate bond yield), besides the persistence in corporate bond spread (its own lagged terms). Thus, a rising spread between the corporate bond yield and the benchmark risk free government bond yield suggests that the corporate debt market continues to lack adequate depth and liquidity. As indicated by the High Level Expert Committee on Corporate Bonds and Securitisation, 2005 (Chairman: Dr. R. H. Patil), the corporate debt market, which is at a nascent stage of development, needs to be strengthened, inter alia, in terms of investor base and enhanced liquidity through consolidation of the issuance process by creating large floating stocks.
Integration of the Foreign Exchange Market
8.31 The degree of integration of the foreign exchange market with other markets is largely determined by the degree of openness. At the cornerstone of the international finance, integration through foreign exchange market is characterised with the Purchasing Power Parity (PPP) doctrine and the three international interest parity conditions, viz., the Covered Interest Parity (CIP), the Uncovered Interest Parity (UIP) and the Real Interest Parity (RIP). According to the PPP, in the absence of restrictions on cross border movements of goods and services and assuming no transactions costs, commodity prices expressed in any single currency should be the same all over the world. In other words, the path of the nominal exchange rate should be guided by the developments in the domestic prices of goods and services vis-à-vis prices of the major trading partners. The behaviour of the Real Effective Exchange Rate (REER) could, therefore, indicate whether the nominal exchange rate moves as per the principle of PPP. The simplest approach to test PPP is just a test of stationarity of the REER, i.e., to see whether deviations from the PPP are temporary and whether over time the REER reverts to some mean or equilibrium, usually the benchmark level at 100, subject to a base year. In India, the 36-currency REER did not show any sustained appreciation or depreciation over longer horizon during the April 1993-December 2006 (Chart VIII.6). During this period, it hovered around the mean at 99.2, which was close to the benchmark level. A formal unit root test also suggests that the broad-based REER is stationary, thus, supporting the purchasing power parity in the long-run.
2 Source: Federal Reserve Bank of New York, the US. Also, www.bondmarkets.com
3 For a sample period of April 2003 to February 2007, applying a regression of AAA rated 5-year corporate bond yield upon 5-year government securities yield, the following estimates were found: Corporate Bond Yield = 0.40 + 1.05 G-sec Yield (1.50) (25.50) R –2= 0.94, DW = 0.34.
Figures in parentheses are estimated t-values. The unity restriction on the coefficient of G-sec yield could not be rejected.
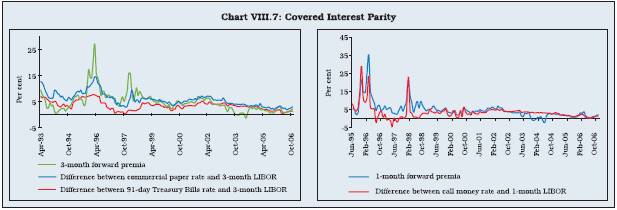
8.32 According to the Covered Interest Parity (CIP), the rates of return on homogenous financial instruments that are denominated in same currency, but traded domestically or offshore must be equal under efficient market conditions, provided exchange controls do not exist and country risk premium is similar in two markets. The CIP implies that yield on foreign investment that is covered in forward markets equals the yield on domestic investment. The interest differential is offset by premium or discount on the forward rate. The absence of covered interest differential indicates that there are some impediments to financial integration, attributable to some element of market imperfection, transaction costs, market liquidity conditions, margin requirements, taxation and market entry-exit conditions. In the Indian context, the forward price of the rupee is not essentially determined by the interest rate differentials, but it is also significantly influenced by: (a) supply and demand of forward US dollars; (b) interest rate differentials and expectations of future interest rates; and (c) expectations of future US dollar-rupee exchange rate. Empirical evidence supports this view, as three month forward premia has less than perfect co-movement with interest rate differential (between 91-day treasury bill rate and three-month LIBOR), indicative of the time varying nature of the risk premium. Inter-linkage becomes stronger when the interest rate differential is based on the monthly average call money rate and one-month LIBOR (Chart VIII.7). The relationship improves still further, when the difference between commercial paper (CP) rate in India and the 3-month US dollar LIBOR rate is considered for interest parity assessments. The deviation of the forward premium from the interest parity condition appears to increase during volatile conditions in the spot segment of the foreign exchange market.

8.33 The Uncovered Interest Rate Parity (UIP) implies that ex-ante, expected home currency returns on foreign bonds or deposits in excess of domestic deposits of equal maturity and default risk should be zero. The currency composition of the asset holdings is, therefore, irrelevant in determining relative returns. The prevalence of UIP also implies that the cost of financing for domestic firms in domestic and foreign markets would be the same. Operating through rational expectations, the UIP suggests that expected changes in the nominal exchange rates should approximate the interest rate differentials. In the Indian context, though empirical studies confirm the existence of CIP, they dispute the existence of UIP. Usually, if CIP holds, UIP will also hold if investors are risk-neutral and form their expectations rationally, so that expected depreciation of home currency equals the forward discount (Box VIII.4).
Stock Market Integration
8.34 As alluded to earlier, the equity market has relatively low and negative correlation with other market segments (Table 8.2). The low correlation of the equity market with risk free instruments is indicative of greater volatility of stock returns and the existence of large equity risk premium. The large risk premium occurs when equity price movements cannot be rationalised with standard inter-temporal optimisation models of macroeconomic fundamentals such as consumption and savings (Mehra and Prescott, 1985). This could be on account of different participants in the equity and other financial markets. For instance, the common participation by banks in the money, the government, the foreign exchange and the credit markets ensures fairly high correlation among these segments. The exposure of banks to the capital market remains limited on account of restrictions due to prudential regulation. A major reason for the surge in equity prices could be due to demand-supply mismatches for equity securities. In fact, a large proportion of equities is held by promoters and institutional investors as detailed in Chapter VII. The supply of securities for retail investors could possibly be lagging behind their demand. Equity prices, however, have relatively higher correlation with the forward exchange rate than other market interest rates. This is because portfolio investors, mainly, the FIIs, are allowed to hedge their exposure in the foreign exchange market through the forward market.
Integration and Stability of Markets
8.35 Financial markets integration process could be smooth or volatile depending on the risks associated with different instruments. When financial integration occurs in a smooth manner, it promotes efficiency in allocation of resources and stability of the financial system. On the contrary, volatility induced integration fuels speculation and undermines competitive price discovery process, with adverse consequences for resource allocation. In the Indian context, empirical evidence shows that growing integration among financial market segments has been accompanied by lower volatility in interest rates (Table 8.3). Barring the stock market, various segments of financial markets, in general, witnessed significantly lower volatility (measured by standard deviation) during April 2000 to March 2007 than the earlier period April 1993 to March 2000. The cross-section volatility of market interest rates has also declined, suggesting the convergence of interest rates due to effective management of liquidity and increasing depth of financial markets.
8.36 The reduction in volatility in the money market segment, in particular, coincided with the introduction of the full-fledged liquidity adjustment facility (LAF) in 2000-01. The operation of the LAF has generally managed to keep the overnight rate, i.e., the call money rate in the corridor of reverse repo rate and repo rate (Chart VIII.8). The gradual phasing out of non-banks from the call money market has led to development of collateralised markets such as the repo market and the CBLO. The migration to the collateralised segments has also reduced the volatility in the overnight money market rates as availability of alternative avenues for mobilising short-term funds has enabled market rates to align with the informal interest rate corridor of repo and reverse repo rate under the LAF.
Financial Market Integration and Monetary Policy
8.37 Developed and integrated financial markets are pre-requisites for effective and credible transmission of monetary policy impulses. The success of a monetary policy transmission framework that relies on indirect instruments of monetary management such as interest rates is contingent upon the extent and speed with which changes in the central bank’s policy rate are transmitted to the spectrum of market interest rates and exchange rate in the economy and onward to the real sector (Mohan, 2007). Deviations between money market rates and the policy interest rate, in particular, have at least two adverse effects. First, they weaken the monetary policy transmission mechanism and introduce an element of uncertainty. Greater the influence the central bank has over interest rate levels, the easier it is for it to manage demand in the economy and attain its objective of low inflation and sustained growth (Petursson, 2001). Second, a large spread entailing a mismatch between inter-bank rates and the central bank’s policy rate could lead to inefficiencies in the financial intermediation process. In the Indian context, there has been convergence among market segments, with a significant decline in the spread of market interest rates over the reverse repo rate (Table 8.4). The spread was the lowest for the inter-bank call money rate followed by rates on Treasury Bills, certificates of deposit, commercial paper and 10-year government bond yield. The benefit of financial markets development percolating to the private sector was also evident from the moderation in spread of commercial paper over the policy rate. The narrowing of the spread between the policy rate and other market rates suggests the increasing efficiency of the transmission mechanism of monetary policy.
8.38 Besides correlation measure, more formal and robust approach to market integration analysis entails an investigation of causal relationship among various interest rates. The causal relationship between reverse repo rate and market interest rates, in particular, highlights the importance of monetary transmission in influencing the term structure of interest rates. Empirical analysis of Granger causality reveals certain important features of transmission mechanism in the Indian context5. First, lags associated with the transmission of policy impulses to market rates are aligned with the term structure of instruments; short-term rates exhibit relatively lower lags than medium and longer maturity instruments to the changes in policy rates. Second, the reverse repo rate has uni-directional causal effect on short-end of the financial market, including call money rate and 91-day Treasury Bills rate. In the medium-to-longer term horizon, 10-year Government bond yield has a bi-directional causal association with the reverse repo rate. This could be attributed to the feedback between policies and markets, since at the longer end, financial markets contain useful information about investment activity and economic agents’ expectations about inflation and growth prospects.
Box VIII.4
Foreign Exchange Market Efficiency
In the context of a country’s international financial integration, an important issue is the degree of foreign exchange market efficiency, which can be examined through empirical evaluation of ‘covered interest parity (CIP)’ and ‘uncovered parity (UIP)’ hypotheses. The interest parity hypothesis is important from a policy perspective (Blinder, 2004). First, the CIP reflects information efficiency of the foreign exchange market. Deviations from CIP can arise because of imperfect integration with overseas markets. Second, the UIP could be attributed to effectiveness of sterilised foreign exchange market intervention by central banks as well as that of interest rate defence of the exchange rate. To the extent that UIP is valid, official intervention cannot successfully change the prevailing spot exchange rate relative to the expected future spot rate, unless the authorities allow interest rates to change (Isard, 1995). It may, however, be added that there are other channels (for instance, the signalling channel) through which sterilised intervention may still be effective. Similarly, the interest rate defence of the exchange rate rests on possible deviations from UIP; otherwise, any attempts by the monetary authority to increase interest rates to defend the exchange rate would be offset exactly by expected currency depreciation. Policy-exploitable deviations from UIP are, therefore, a necessary condition for an interest rate defence (Flood and Rose, 2002).
From a cross-country perspective, empirical literature generally supports the CIP. As regards the UIP, the literature in general does not support it, though results could vary across currency, time horizon and countries (Isard, 1995; Fama, 1984; Froot and Thaler, 1990; Wadhwani, 1999; Chinn and Meredith, 2002; Bekaert et al., 2002; and Flood and Rose, 2002). The failure of UIP is attributable, inter alia, to time-varying risk premium, deviations from rational expectations (since tests of UIP involve a joint test of efficient market hypothesis and rational expectations), transaction costs, and endogenous monetary policy (Wadhwani, 1999; Kim and Roubini, 2000; and Meredith and Ma, 2002).
In the Indian context, empirical evidence covering the period April 1993 to early 1998 finds some support for CIP but not for UIP (Bhoi and Dhal, 1998; and Joshi and Saggar, 1998). Deriving from theoretical and empirical insights from cross-country studies, Pattnaik, Kapur and Dhal (2003) adopted a rigorous empirical analysis of parity conditions in the Indian context during April 1993 to March 2002. The study reiterated that the overall evidence in favour of market efficiency appears to be inconclusive. While CIP appears to hold on an average, the evidence for UIP comes from the absence of any predictable significant excess foreign exchange market returns. In view of significant ongoing liberalisation of the capital account in the subsequent period, it was attempted to examine afresh the interest parity conditions for India. Accordingly, interest parity conditions for the rupee vis-à-vis the US dollar using monthly data over the period April 1993 to September 2006 with regard to 3-month forward premia were examined. For interest rate differential, two alternative measures of domestic interest rate (call money rate and 91-day Treasury Bills rate) have been used; for the foreign interest rate, 1-month and 3-month LIBOR were used. The results were more or less in line with previous studies4 . Deviations from UIP could not only be due to presence of time varying risk premium but also due to surges in private capital flows (RBI, 2001). Although non-residents have been increasingly permitted to invest in the Indian markets, restrictions on borrowing and investing by residents in the overseas markets remained for most of the sample period of this study. Moreover, even with regard to non-residents, the major players, viz., the foreign institutional investors (FIIs) are more focused on the equity markets. Furthermore, central bank intervention in the market and administrative measures can also affect market behaviour. All these factors can cause deviations from UIP in the short-horizon, but over time there remains a tendency for the exchange rate movements to be consistent with UIP and stable real exchange rate. The average level of interest rate differentials points the right way in forecasting long-run currency changes, even though the short-run correlation usually points the wrong way in forecasting near-term exchange rate changes (Froot and Thaler, 1990).
4 The estimated CIP equations are as follows: FR3 = 1.70 + 0.45 ID1 + 0.25 ID1(-1) + 0.17 ID1(-2)
(4.8) (6.4) (3.2) (2.5) DW = 0.3 R –2= 0.47 FR3 = 1.08 + 1.08 ID2 (1.7) (6.7) DW = 0.3 R –2 = 0.22 where FR3 is 3-month forward premia, ID1 is interest rate differential between the call money rate and the 1-month LIBOR and ID2 is the interest rate differential between the 91-day Treasury Bills rate and the 3-month LIBOR. Figures in parentheses are estimated t-values.
The estimated UIP equation is as follows:
DEPX = -0.06 - 0.04 FR3 (t-3) 2 (0.4) (1.5) DW = 1.5 R – = 0.01 where DEPX is actual exchange rate depreciation under the assumption of rational expectations. Figures in parentheses are estimated t-values.
Table 8.3: Financial Market Volatility |
Rate Apr-1993 |
Apr-1993 |
Apr-2000 |
|
to |
to |
to |
Mar-2007 |
Mar-2000 |
Mar-2007 |
1 |
2 |
3 |
4 |
Call money rate |
4.30 |
5.38 |
1.90 |
Reverse repo rate |
1.27 |
1.14 |
1.32 |
Treasury Bills rate (91 days) |
2.29 |
1.93 |
1.46 |
Treasury Bills rate (364 days) |
2.57 |
1.56 |
1.66 |
Certificates of deposit rate |
3.17 |
2.36 |
1.66 |
Commercial paper rate |
3.30 |
2.50 |
1.99 |
Yield on 10-year government |
|
|
|
securities |
2.77 |
0.99 |
1.78 |
Exchange rate (Rs./US$) |
5.96 |
4.62 |
1.61 |
Forward exchange premium |
4.69 |
5.99 |
1.91 |
(1 month) |
|
|
|
Forward exchange premium |
3.93 |
4.51 |
1.86 |
(3 month) |
|
|
|
Forward exchange premium |
3.73 |
4.00 |
1.84 |
(6 month) |
|
|
|
BSE SENSEX (index volatility) |
2582 |
685 |
3194 |
(annualised index |
(32.94) |
(32.44) |
(33.36) |
return volatility) |
|
|
|
Cross-section volatility* |
3.88 |
4.08 |
2.53 |
Note : 1. Volatility is measured in terms of standard deviation.
2. Data for 10-year government securities yield are available
since April 1996, while data for 1-month forward exchange
premia are available from June 1995.
* :Standard deviation of all of the above interest rates and forward premia. |
8.39 As alluded to earlier, market integration could be attributable to liquidity, term structure, credit market conditions, exchange rate and macroeconomic fundamentals. Empirical results reveal that the market integration process is influenced by liquidity, safety and risk, external market developments, private sector growth, credit requirements and macroeconomic developments such as growth and inflation outlook implied by the long-term bond yield6. First, short-term liquidity impact on the inter-bank call money rate is mainly influenced by foreign exchange market developments reflected in the movement of forward exchange rate and fiscal policy induced effect at the short-end of the market through changes in the benchmark 91-day Treasury Bills rate. Second, the rate on 91-day Treasury Bills is influenced by the 10-year government securities yield and private sector credit condition through changes in the commercial paper rate, while foreign exchange market development and liquidity exert some influence in the short-run. Third, forward exchange premia is driven by arbitrage condition, with the inter-bank call money market being the key driver, though some modest impact was due to developments in the private sector (commercial paper) and long-term fundamentals (10-year government bond yield). Fourth, for the private sector, commercial paper is driven by long-term government securities yield in the medium to longer term horizon, while liquidity, risk premium and foreign exchange market condition have modest impact in the shor t-run. Fifth, the commercial paper representing developments in productive activities and credit requirements by the private sector has a substantially larger impact than liquidity, foreign exchange market and risk premium. Moreover, an extension of the above multivariate vector auto-regression(VAR) model to a structural representation reveals that financial market integration in the medium to longer term horizon is induced by the long-term yield on government securities and the commercial paper rate, attributable to macroeconomic developments such as medium-term inflation outlook and real sector developments in the private sector.
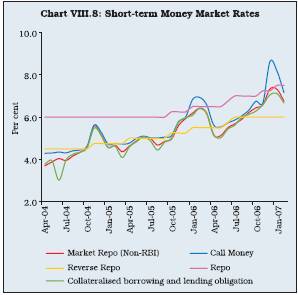
Table 8.4: Interest Rate Spread over the |
Reverse Repo Rate |
(Percentage point) |
|
|
|
|
Interest Rate |
Apr-1993 |
Apr-1993 |
Apr-2000 |
|
to |
to |
to |
|
Mar-2007 |
Mar-2000 |
Mar-2007 |
1 |
2 |
3 |
4 |
Call Money Rate |
1.78 |
2.98 |
0.58 |
Certificates of Deposit Rate |
3.31 |
5.43 |
1.19 |
Commercial Paper Rate |
3.99 |
6.09 |
1.89 |
91-day Treasury Bills Rate |
1.69 |
2.90 |
0.48 |
364-day Treasury Bills Rate |
2.48 |
4.18 |
0.79 |
10-year Yield on Government |
|
|
Securities |
3.42 |
6.21 |
1.83 |
Dynamics of Market Inter-linkages
8.39 As alluded to earlier, market integration could be attributable to liquidity, term structure, credit market conditions, exchange rate and macroeconomic fundamentals. Empirical results reveal that the market integration process is influenced by liquidity, safety and risk, external market developments, private sector growth, credit requirements and macroeconomic developments such as growth and inflation outlook implied by the long-term bond yield6. First, short-term liquidity impact on the inter-bank call money rate is mainly influenced by foreign exchange market developments reflected in the movement of forward exchange rate and fiscal policy induced effect at the short-end of the market through changes in the benchmark 91-day Treasury Bills rate. Second, the rate on 91-day Treasury Bills is influenced by the 10-year government securities yield and private sector credit condition through changes in the commercial paper rate, while foreign exchange market development and liquidity exert some influence in the short-run. Third, forward exchange premia is driven by arbitrage condition, with the inter-bank call money market being the ke driver, though some modest impact was due to developments in the private sector (commercial paper) and long-term fundamentals (10-year government bond yield). Fourth, for the private sector, commercial paper is driven by long-term government securities yield in the medium to longer term horizon, while liquidity, risk premium and foreign exchange market condition have modest impact in the shor t-run. Fifth, the commercial paper representing developments in productive activities and credit requirements by the private sector has a substantially larger impact than liquidity, foreign exchange market and risk premium. Moreover, an extension of the above multivariate vector auto-regression(VAR) model to a structural representation reveals that financial market integration in the medium to longer term horizon is induced by the long-term yield on government securities and the commercial paper rate, attributable to macroeconomic developments such as medium-term inflation outlook and real sector developments in the private sector.
8.40 To sum up, integration among various market segments has grown, especially in the recent period. This was reflected in an increase in the depth of the markets and higher correlation among interest rates in various market segments. Growing integration among various financial market segments was accompanied by lower volatility of interest rates. The narrowing of the interest rate spread over the reverse repo rate reflects an improvement in the monetary policy transmission channel and greater financial market integration. Financial market integration reflects a dynamic interaction among various parameters such as liquidity, safety and risk, foreign exchange market development, private sector activity, and macroeconomic fundamentals. Alternatively, financial integration exhibits interaction among financial intermediaries, the Government, the private sector and the external sector. In respect of specific market segments, it was found that the reverse repo rate has one-way causal effect with the short-end of the financial markets, i.e., money market, while with the 10-year government bond yield, a two-way causal relation exists, implying a feedback between policy and markets at the longer end. In the foreign exchange market, the PPP doctrine has been held in the absence of any sustained appreciation/depreciation of the REER. The equity market has a relatively low interaction with other market segments, which is reflected in the existence of a large equity risk premium.
5 Granger causality tests were conducted for the period April 1993 to September 2006 by estimating a vector error correction model (VEC) by taking the following variables: reverse repo rate, 91-day Treasury Bills rate, 364-day Treasury Bills rate and 10-year Government securities yield. The order of the VAR model was chosen to be two months lag based on the Schwarz Criterion.
6 An unrestricted vector auto-regression model was estimated to analyse financial market inter-linkages in terms of interaction among five variables such as the inter-bank call money rate, the 91-day Treasury Bills rate, the three-month forward premia, the commercial paper rate and the 10-year government bond yield. From an alternative perspective, such multivariate dynamics demonstrate the underlying financial and real linkages arising from interaction among intermediaries, the Government, the external sector, the private sector and macroeconomic developments. The model was estimated using monthly data for the period April 1993 to September 2006. The order of the VAR was found to be 9-month lag, based on the Likelihood Ratio test. The forecast error variance decomposition analysis of the VAR model was used for explaining the variation of one variable in terms of variation in other variables in the system.
IV. INDIA’S INTERNATIONAL FINANCIAL
INTEGRATION
8.41 Development of financial markets is required for the purpose of not only realising the hidden saving potential and effective monetary policy, but also for expanding the economy’s role and participation in the process of globalisation and regional integration. With growing openness, global factors come to play a greater role in domestic policy formulation, leading to greater financial market integration (Reddy, 2006b). With growing financial globalisation, it is important for emerging market economies such as India to develop financial markets to manage the risks associated with large capital flows. In a globalised world, the importance of a strong and well-regulated financial sector can hardly be overemphasised to deal with capital flows that can be very large and could reverse very quickly. The Report of the Committee on Fuller Capital Account Convertibility, 2006 (Chairman: Shri S.S. Tarapore) observed that in order to make a move towards the fuller capital account convertibility, it needs to be ensured that different market segments are not only well-developed but also that they are well-integrated.
Global and Regional Trends
8.42 Globalisation has manifested itself in a new form of trade and financial inter-dependence among industrial, developing and emerging market economies. Developing and emerging economies, which earlier relied mainly on primary commodity exports, have emerged as the leading countries in manufacturing and services trade. Though in absolute terms, industrial countries continue to account for the bulk of global trade, their share has declined in recent years, leading to a rise in the share of developing and emerging market economies led by China and countries in the East and South East Asia. The spreading out of the production process across countries, with companies increasingly finding it profitable to allocate different links of the value chain across a range of countries, has been accompanied by increased market integration. Thus, in terms of trade openness, developing and emerging market economies surpassed advanced economies (Table 8.5). Across income groups, trade openness of low and middle-income countries has increased at a faster rate than high-income countries.
8.43 The major trend in the global economy today alongside globalisation is growing regionalisation. In this context, the issue whether the process of globalisation and the growing regionalism complement each other or the growing regionalism is detrimental to globalisation has become a subject of intense discussion for policy makers and academics. Some believe that globalisation is nothing but a greater integration of economies nationally, regionally and worldwide. For others, since the regional integration process remains concentrated exclusively in certain countries, doubts arise whether such exclusivity throws up building blocks or stumbling blocks on the road to global economic integration. Despite these alternative perspectives, the regionalisation process has accelerated since the mid-1980s with varying features and scale in different regions. According to the World Trade Organisation (WTO), by March 2007, there were 194 regional trade arrangements as compared with only 24 agreements in 1986 and 66 agreements in 1996. According to the World Investment Report, 2006 of the United Nations Conference on Trade and Development, international investment agreements (IIAs) have increased substantially. At the global level, total number of IIAs was close to 5,500 at the end of 2005, comprising 2,495 bilateral investment treaties (BITs), 2,758 double taxation treaties (DTTs) and 232 other international agreements that contain investment provisions. The total number of BITs among developing countries increased sharply from 42 in 1990 to 644 by the end of 2005, while the number of DTTs rose from 105 to 399, and other IIAs from 17 to 86 during the same period. Asian countries are particularly engaged as parties to approximately 40 per cent of all BITs, 35 per cent of DTTs and 39 per cent of other IIAs.
Table 8.5: Global Trade Openness |
(Exports plus Imports as percent of GDP) |
Category |
1980s |
1990s |
2000s |
2006 |
1 |
2 |
3 |
4 |
5 |
World |
37.1 |
41.4 |
52.7 |
60.8 |
Advanced Economies |
38.3 |
40.5 |
49.3 |
56.5 |
Developing and Emerging Economies |
33.6 |
46.2 |
65.0 |
73.4 |
Low Income Economies |
22.9 |
33.6 |
43.0 |
50.0 * |
Middle Income Economies |
35.4 |
49.4 |
61.1 |
67.0 * |
High Income Economies |
38.1 |
40.0 |
46.1 |
45.2 # |
* : Data for 2004. # : Data for 2003. |
|
|
|
Source :
World Economic Outlook, April 2007,
IMF and World
Development Indicators, 2006, World Bank. |
8.44 The East and South East Asian economies, in particular, have achieved significant integration due to liberalisation of foreign trade and foreign direct investment (FDI) regimes within the frameworks of GATT/WTO and several bilateral regional cooperation agreements. The changing production structure along with the various policy measures in the form of tariff reductions and liberalisation of investment norms have played an important role in improving the trade among the regions (Table 8.6). The resulting expansion of trade and FDI has become the engine of economic growth and development in the region.
8.45 In the sphere of finance, the traditional postulate that the capital flows from the capital surplus developed countries to the capital scarce developing countries, seems to have been disproved in recent years (Reddy, 2006b). Today, the world is confronted with the puzzle of capital flowing uphill that is, from the developing to the developed countries (Prasad et al., 2006). The world’s largest economy, the United States, currently runs a current account deficit, financed to a substantial extent by surplus savings or capital exports from the developing and emerging market economies (Table 8.7). With rising incomes and increasingly open policies, developing and emerging market economies have become a significant source of foreign direct investment, bank lending and official development assistance (ODA) to other developing countries.
8.46 Trade and financial openness share more than a complementary relationship. In absolute terms, the level of integration of different country groups into global financial markets is measured as the sum of gross international financial assets and liabilities (Prasad et al., 2006). While trade openness at global level increased from an average of 37 per cent of GDP during the 1980s to 61 per cent of GDP in 2006, financial openness, measured by gross foreign assets and liabilities as per cent to GDP, witnessed almost a four-fold increase from 68 per cent in the early 1980s to 250 per cent during 2000-04. Though the level of integration into global financial markets is clearly the largest for developed countries, emerging market economies have accounted for the bulk of integration experienced by the developing economies block (Table 8.8).
8.47 Global capital flows to developing and emerging market economies have seen a boom-bust cyclical pattern, typically reflecting a part of a larger process of development of the global economy (Chart VIII.9). Lending and other forms of capital flows have tended to surge when technological changes improve communications, growth is buoyant, trade is expanding, financial innovation is rapid and the political climate is supportive (World Bank, 2000). The underlying surge in capital flows to developing and emerging market economies in recent years is led by the strong demand for emerging market debt and equities, supported by sharp improvement in fundamentals in many EMEs and investors’ search for higher yields in an environment where long-term interest rates remain low in major industrial countries (World Bank, 2006).
Table 8.6: Intra-regional Trade Share in Asia |
(Per cent) |
Reporter/Partner |
1990 |
1995 |
2000 |
2005 |
1 |
2 |
3 |
4 |
5 |
Asia |
47.0 |
54.9 |
54.8 |
58.7 |
East Asia |
30.2 |
37.1 |
38.1 |
42.6 |
ASEAN+3 |
29.4 |
37.6 |
37.3 |
39.2 |
Southeast Asia |
18.8 |
24.0 |
24.7 |
28.1 |
ASEAN |
18.8 |
24.0 |
24.7 |
28.1 |
SAARC |
2.7 |
3.9 |
3.9 |
4.8 |
South Asia |
2.1 |
3.8 |
3.6 |
4.7 |
Source : Asia Regional Integration Centre, ADB. |
|
Table 8.7: Global Current Account Balance |
(US $ billion) |
Period/Year |
World |
Advanced |
United |
Developing |
China |
|
|
Economies |
States |
& Emerging |
|
|
|
|
|
Economies |
|
1 |
2 |
3 |
4 |
5 |
6 |
1980s |
-68 |
-41 |
-78 |
-27 |
-1 |
1990s |
-85 |
-4 |
-122 |
-81 |
12 |
2000 |
-182 |
-268 |
-415 |
86 |
21 |
2001 |
-174 |
-213 |
-389 |
39 |
17 |
2002 |
-152 |
-229 |
-472 |
77 |
35 |
2003 |
-73 |
-221 |
-528 |
148 |
46 |
2004 |
-43 |
-255 |
-665 |
213 |
69 |
2005 |
-45 |
-473 |
-792 |
428 |
161 |
2006 |
-19 |
-563 |
-857 |
544 |
239 * |
* : IMF Staff estimate. |
|
|
|
Source :World Economic Outlook, Online Database, April 2007, IMF. |
Table 8.8: Gross Foreign Assets and Liabilities |
(US $ trillion) |
Period |
Global |
Industrial |
Developing and |
Emerging |
|
|
Economies |
Emerging |
Asia |
|
|
|
Economies |
|
1 |
2 |
3 |
4 |
5 |
1980-84 |
7.9 |
6.1 |
1.9 |
0.5 |
|
(67.5) |
(74.5) |
(52.8) |
(53.7) |
1985-89 |
16.4 |
13.5 |
2.9 |
1.2 |
|
(97.7) |
(107.7) |
(68.4) |
(102.2) |
1990-94 |
29.0 |
24.0 |
5.1 |
2.6 |
|
(120.2) |
(127.1) |
(95.9) |
(141.6) |
1995-99 |
50.7 |
42.1 |
8.7 |
4.5 |
|
(170.1) |
(183.0) |
(126.9) |
(162.7) |
2000-04 |
86.0 |
73.8 |
12.2 |
6.2 |
|
(250.0) |
(280.5) |
(150.6) |
(179.3) |
Note : |
Figures in brackets represent percentage to GDP. |
Source : |
Lane and Ferretti (2006), On-line Database, IMF. |
8.48 A key feature of global financial integration during the past three decades is the shift in the composition of capital flows to developing and emerging market economies. First, private sector flows have outpaced official flows due to increasing liberalisation. Second, a shift has occurred in terms of components, from the dominance of debt flows in the 1970s and the 1980s to foreign direct investment (FDI) and portfolio flows since the 1990s (Table 8.9). FDI flows have been determined by several push and pull factors, including strong global growth, soft interest rates in home countries, a general improvement in emerging market economies’ risks, greater business and consumer confidence, rising corporate profitability, large scale corporate restructuring, sharp recovery of asset prices and rising commodity prices. Trade and FDI openness has encouraged domestic institutional and governance reforms promoting trade and investment further. The hope of better risk sharing, more efficient allocation of capital, more productive investment and ultimately higher standards of living for all have also propelled the drive for stronger regional connections of financial systems across the world. In terms of overall financial flows, Asia has benefited from the surge in net capital flows to emerging markets in recent years.

Table 8.9: Capital Flows to Developing and |
Emerging Economies |
(Per cent to total) |
Period |
|
FDI |
Portfolio |
Debt |
Grants |
1 |
|
2 |
3 |
4 |
5 |
1970s |
|
14.9 |
0.0 |
71.8 |
13.3 |
1980s |
|
16.4 |
0.3 |
65.7 |
17.6 |
1990s |
|
41.5 |
7.0 |
37.4 |
14.2 |
2000-06 |
|
62.9 |
8.1 |
16.8 |
12.3 |
Note |
: |
1. Data are period averages. |
|
|
2. Based on data on net capital flows.
Source :
Global Development Finance 2006, World Bank. |
8.49 In any approach to the policies relating to the financial integration, it may be useful to consider both quantitative and qualitative factors in such flows (Reddy, 2003). An important parameter of quality of capital flows relates to volatility of such flows. In this regard, cross-country evidence on volatility of capital flows over the period 1985-2004 shows that FDI inflows to developing and emerging economies have been relatively stable as compared with other types of capital flows (Table 8.10). For instance, portfolio flows exhibited sharp variations, declining from the peak of US $ 30 billion on an average during the 1993-97 to US $ 7 billion during 1998-2002, following a series of crises in the South East Asia, the Latin America, Russia, Argentina and Turkey.
Indian Context
8.50 As a result of policy measures undertaken since the early 1990s, India’s trade and financial integration has grown with the global economy. This is evident from the significant increase in various indicators of openness since the onset of reforms (Table 8.11). In terms of overall trade openness during the 1990s, the Indian economy was relatively less dependent on external demand as compared with select emerging market economies. However, India’s trade openness was higher than some of the advanced economies, including the US.
8.51 The increasing openness of the Indian economy to the external sector in recent years
Table 8.10: Volatility of Capital Flows (1985-2004) |
Category |
FDI |
Equity |
Debt |
FDI and |
|
|
|
|
Equity |
1 |
2 |
3 |
4 |
5 |
All Countries |
|
|
|
|
Mean |
0.85 |
0.98 |
0.76 |
0.80 |
Median |
0.77 |
0.98 |
0.66 |
0.75 |
Advanced economies |
|
|
|
|
Mean |
0.92 |
0.99 |
0.64 |
0.84 |
Median |
0.87 |
0.98 |
0.64 |
0.77 |
Emerging markets |
|
|
|
|
Mean |
0.75 |
1.07 |
0.85 |
0.71 |
Median |
0.76 |
1.00 |
0.67 |
0.66 |
Other Developing |
|
|
|
|
Mean |
0.89 |
0.65 |
0.80 |
0.87 |
Median |
0.77 |
0.70 |
0.70 |
0.77 |
|
|
|
|
|
Note : Volatility is measured by co-efficient of variation based on data for the period 1985-2004.
Source : Kose et al., 2006.
|
characterises its expanding economic relationships with the rest of Asia. In recent years, the Asian economies are emerging as major trading partners of India. Emerging Asian economies including China, Hong Kong, Indonesia, Korea, Malaysia, the Philippines, Singapore and Thailand accounted for a significant 24.1 per cent share in India’s total non-oil exports in 2005-06 (9.7 per cent in 1990-91) and 27.8 per cent of India’s non-oil imports (11.5 per cent in
Table 8.11: Select Indicators of India's Openness |
(Per cent to GDP) |
Year |
Merchandise |
Trade in |
Gross Capital |
|
Trade* |
Goods and |
Transactions |
|
|
Services# |
@ |
1 |
2 |
3 |
4 |
1990-91 |
14.6 |
17.2 |
12.1 |
1995-96 |
21.5 |
25.7 |
12.5 |
2000-01 |
22.5 |
29.2 |
21.6 |
2001-02 |
21.1 |
27.6 |
16.3 |
2002-03 |
23.3 |
30.7 |
16.1 |
2003-04 |
24.3 |
35.5 |
22.4 |
2004-05 |
29.3 |
40.4 |
24.2 |
2005-06 |
32.5 |
44.8 |
32.4 |
* : Merchandise exports plus imports as percentage to GDP at
current market prices.
# : Exports of goods and services plus imports of goods and
services as percentage to GDP at current market prices.
@ : Capital account receipts plus payments as percentage to
GDP at current market prices.
Source :
Reserve Bank of India. |
1990-91). Since 2004-05, China has emerged as the third major export destination for India after the US and the UAE. China has now become the largest source of imports for India, relegating the US to the second position. India’s exports to China surged to 7.4 per cent of India’s total non-oil exports (0.3 per cent in 1991-92). Similarly, India’s imports from China accounted for 10.3 per cent of India’s total non-oil imports, a sharp increase from 0.2 per cent in 1991-92. This reflects growing trade relations between the two countries. A similar trend was noticeable vis-à-vis the ASEAN-5 (Singapore, Thailand, Malaysia, Indonesia and the Philippines). In recognition of the growing importance of Asian countries in India’s foreign trade, a series of nominal and real effective exchange rate indices released by the Reserve Bank were revised a couple of years ago to include Chinese renminbi and Hong Kong dollar in the weighting scheme. With Japan already a part of the indices, the representation of Asian economies has increased to three in the six-country real effective exchange rate index. There has been an ongoing transformation in the composition of production and trade as the comparative advantage of many Asian economies continues to change in an environment of growing regional co-operation (Box VIII.5). In particular, economies with relatively high wage costs are shifting towards higher value-added products, including services. 8.52 In tandem with trade openness, India’s capital account has witnessed a structural transformation since the early 1990s, with a shift in the composition from official flows to market-oriented private sector flows (Table 8.12). After independence, during the first three decades, trade balance was financed by capital account balance comprising mainly the official flows. During the 1980s, the dependence on official flows moderated sharply with private debt flows in the form of external commercial borrowing and non-resident Indian (NRI) deposits emerging as the key components of the capital account.
8.53 Following the shift in emphasis from debt to non-debt flows in the reform period, foreign investment comprising direct investment and portfolio flows emerged as predominant component of capital account. India’s FDI openness, as measured by FDI stock to GDP ratio, increased ten-fold from 0.5 per cent in 1990 to 5.8 per cent in 2005. However, this is still much lower than other emerging countries in Asia, including China (Table 8.13).
8.54 India has emerged as a major destination for global portfolio equity flows since the late 1990s. On an average, India’s share was 24 per cent of total
Box VIII.5
Initiatives on Regional Integration in Asia
After the South East Asian crisis of 1997, the geographic scope of cooperation initiatives is expanding across sub-regions of Asia. East Asian economies have embarked on various initiatives for regional monetary and financial cooperation. The major initiatives for regional cooperation in Asia include ASEAN+3, Chiang Mai Initiative, Executives’ Meeting of East Asia- Pacific Central Banks (EMEAP), Asian Bond Market Initiative and Asian Bond Fund. The countries of ASEAN –Brunei Darussalam, Cambodia, Indonesia, Laos, Malaysia, Myanmar, the Philippines, Singapore, Thailand and Vietnam –and India have entered into a Framework Agreement on comprehensive economic cooperation. The ASEAN has embarked on a process to expand economic cooperation with its neighbours in the north, namely China, Japan and South Korea (ASEAN+3). As far as India’s association with ASEAN community is concerned, currently India is not a full-fledged part of the ASEAN network but holds a regular summit with the ASEAN. However, in the years ahead, it is envisaged that ASEAN+3+3 network1 would help India to share and cooperate on various financial issues as the present network of ASEAN+3 has been consistently engaging in economic policy dialogue of unprecedented scope and depth.
Another instance of central banking cooperation in Asia exists in the form of reciprocal currency or swap arrangements under the Chiang Mai Initiative2 . The ASEAN Swap Arrangement (ASA) was created primarily to provide liquidity support to countries experiencing balance of payments difficulties. The Finance Ministers of ASEAN+3 announced this initiative in May 2000 with the intention to cooperate in four major areas, viz., monitoring capital flows, regional surveillance, swap networks and training personnel.
A more explicit central banking cooperation has been existing in the form of EMEAP since 19913. The ongoing work of EMEAP seeks to further strengthen policy analysis and advice within the region and encourage co-operation with respect to operational and institutional central banking issues. EMEAP central banks have actively coordinated on issues relating to financial markets, banking supervision and payment and settlement systems. The Asian Bond Fund (ABF) initiative of the EMEAP Group has been one of the major initiatives aimed at broadening and deepening the domestic and regional bond markets in Asia. The initiative has been in the form of ABF1 and ABF2. In the near term, the ABF2 Initiative is expected to help raise investor awareness and interest in Asian bonds by providing innovative, low-cost and efficient products in the form of passively managed bond funds. More and more similar kinds of index-driven private bond funds are rapidly emerging in Asia. At present, India does not contribute in the ABF. The informal meeting organised by Asia Cooperation Dialogue (ACD) is, however, attended by participant central banks including India, to discuss promotion of supply of Asian Bonds. The Government of India has given a commitment on participation in the ABF2 to the tune of US$ 1 billion.
SEANZA and SEACEN4 are the oldest initiatives in central bank cooperation in Asia. The SEANZA, formed in 1956, promotes cooperation among central banks by conducting intensive training courses for higher central banking executive positions with the objective to build up knowledge of central banking and foster technical cooperation among central banks in the SEANZA region. The SEACEN provides a forum for member central bank governors to be familiar with each other and to gain deeper understanding of the economic conditions of the individual SEACEN countries. It initiates and facilitates co-operation in research and training relating to the policy and operational aspects of central banking, i.e., monetary policy, banking supervision and payments and settlement systems.
Asian Clearing Union (ACU), an arrangement of central banking cooperation, is successfully functioning since 1974 for multilateral settlement of payments for promoting trade and monetary cooperation among the member countries5. Since 1989, the ACU has also included a currency swap arrangement among its operational objectives. The SAARCFINANCE, established in September 1998 is a regional network of the SAARC Central Bank Governors and Finance Secretaries which aims at strengthening the SAARC with specific emphasis on international finance and monetary issues6. India has been very actively participating in SAARCFINANCE activities.
The clearest evidence of Asian countries’ desire to forge closer economic relationships is the proliferation of Free Trade Agreements (FTAs). By 2006, there were more than 30 FTAs under negotiation in East Asia alone. Increasingly, these agreements are also deeper, extending to areas beyond just tariff reduction. An example is the recently signed India-Singapore comprehensive economic cooperation agreement, which covers not only trade in goods, but also services, investments and cooperation in technology, education, air services and human resources.
1 India, Australia and New Zealand are included in ASEAN+3+3.
2 Under this Initiative, the total resources available are currently estimated to be around US$ 75 billion (up from less than US$ 40 billion in May 2005), reflecting the renegotiation of most Bilateral Swap Agreements (BSAs).
3 Members are the central banks of Australia, China, Hong Kong, Indonesia, Japan, Korea, Malaysia, New Zealand, the Philippines, Singapore and Thailand.
4 The SEANZA refers to South East Asia, New Zealand and Australia. The SEACEN refers to South East Asia Central Banks.
5 At present, its membership includes eight members including India, Islamic Republic of Iran, Nepal, Pakistan and Sri Lanka being the founder members (Myanmar, Bangladesh and Bhutan joined later).
6 SAARCFINANCE members are India, Pakistan, Sri Lanka, Bangladesh, Bhutan, Malpes and Nepal. It is a permanent body, which got formal recognition of SAARC at the 11th SAARC Summit, held in Kathmandu, Nepal in January 2002.
Table 8.12: India’s Trade and Capital Accounts |
(US $ million) |
Period |
Trade |
Current |
Capital |
Major Components of Capital Account |
|
|
Balance |
Account |
Account |
External |
Foreign |
Commercial |
NRI Deposits |
|
|
Balance |
Balance |
Assistance |
Investment |
Borrowing |
|
1 |
2 |
3 |
4 |
5 |
6 |
7 |
8 |
|
|
|
(Annual Average) |
|
|
|
1950s |
-489 |
-265 |
126 |
106 |
29 |
0 |
0 |
1960s |
-938 |
-831 |
845 |
852 |
48 |
0 |
0 |
1970s |
-1,303 |
-29 |
615 |
662 |
37 |
114 |
85 |
1980s |
-7,363 |
-4,414 |
3,932 |
1,487 |
349 |
1,044 |
1,135 |
1990s |
-10,356 |
-4,368 |
7,822 |
1,515 |
3,390 |
1,778 |
1,328 |
2000s |
-22,331 |
1,584 |
16,290 |
-71 |
12,010 |
1,080 |
2,253 |
2003-06 |
-33,087 |
809 |
23,402 |
346 |
17,036 |
1,820 |
1,822 |
Source: Reserve Bank of India. |
8.55 Financial market integration has assumed added significance in the recent period as capital has become more mobile across countries with reduction in capital controls and improvement in technological infrastructure. This is reflected in increasing co-movements in interest rates, bond yields and stock indices. The bond yield differential in Asia has narrowed down in an environment of improved macroeconomic fundamentals and lower inflation in these economies. Evidence from price-based measures of financial integration suggests increasing financial markets integration in Asia.
Table 8.13: FDI Openness : Select Countries |
(Per cent to GDP) |
Country |
1990 |
1997 |
2003 |
2004 |
2005 |
1 |
2 |
3 |
4 |
5 |
6 |
China |
5.4 |
17.1 |
16.2 |
14.9 |
14.3 |
Hong Kong |
59.4 |
143.6 |
239.2 |
275.2 |
299.9 |
India |
0.5 |
2.5 |
5.2 |
5.7 |
5.8 |
Indonesia |
7.7 |
14.6 |
5.0 |
7.0 |
7.7 |
Korea |
2.0 |
3.0 |
9.0 |
9.2 |
8.0 |
Malaysia |
23.4 |
42.3 |
40.4 |
37.2 |
36.5 |
Pakistan |
3.6 |
14.1 |
8.7 |
8.8 |
8.8 |
Philippines |
7.4 |
10.2 |
15.2 |
14.9 |
14.4 |
Singapore |
82.6 |
78.4 |
160.2 |
156.2 |
158.6 |
Sri Lanka |
8.5 |
12.2 |
11.2 |
11.3 |
10.4 |
Thailand |
9.7 |
8.8 |
33.3 |
32.9 |
33.5 |
|
|
|
|
|
|
Note : FDI openness is measured in terms of FDI stock as
percentage of GDP
Source : On-line FDI Database, United Nations Conference on Trade and Development (UNCTAD). |
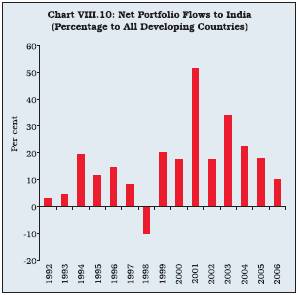
Table 8.14: Regional Stock Market Return Correlation |
Country |
China |
Hong Kong |
India |
Indonesia |
Japan |
Korea |
Malaysia |
Philippines |
Singapore |
Thailand |
1 |
2 |
3 |
4 |
5 |
6 |
7 |
8 |
9 |
10 |
11 |
China |
1.00 |
|
|
|
|
|
|
|
|
|
Hong Kong |
0.48 |
1.00 |
|
|
|
|
|
|
|
|
India |
0.46 |
0.93 |
1.00 |
|
|
|
|
|
|
|
Indonesia |
0.26 |
0.87 |
0.80 |
1.00 |
|
|
|
|
|
|
Japan |
0.41 |
0.86 |
0.86 |
0.72 |
1.00 |
|
|
|
|
|
Korea |
-0.03 |
0.44 |
0.45 |
0.57 |
0.60 |
1.00 |
|
|
|
|
Malaysia |
0.26 |
0.65 |
0.56 |
0.81 |
0.57 |
0.70 |
1.00 |
|
|
|
Philippines |
0.26 |
0.87 |
0.80 |
0.86 |
0.78 |
0.43 |
0.58 |
1.00 |
|
|
Singapore |
0.30 |
0.93 |
0.85 |
0.91 |
0.85 |
0.65 |
0.74 |
0.92 |
1.00 |
|
Thailand |
0.53 |
0.64 |
0.65 |
0.61 |
0.52 |
0.36 |
0.66 |
0.44 |
0.59 |
1.00 |
Note : Based on monthly data for the period 2003-2005.
Source : Regional Integration Database, Asian Development Bank. |
8.56 Stock markets in Emerging Asia show a high degree of correlation with several countries in the region, barring China (Table 8.14). In the region, Japan, Hong Kong and Singapore are the main drivers. The Indian stock market showed high correlation with Asian stock markets, barring China and Korea. Moreover, correlation of India’s stock market with Japan, Hong Kong and Singapore washigher than with some of the other Asian countries including, China, Korea, Malaysia and Thailand.
8.57 The international linkage of India’s stock market has been enhanced with listing of Indian companies in some of major stock exchanges. In the US NASDAQ, 12 major Indian companies are listed. These companies account for about 20 per cent weight in the BSE Sensex. In the London Stock Exchange, 50 companies including eight major companies in the BSE Sensex and the others in BSE 200 are listed. Empirical evidence suggests that movements in the BSE Sensex are positively correlated with the indices in the US, the UK. In a multivariate framework, co-integration analysis involving the BSE Sensex, the major stock markets such as the US, the UK and Japan and regional stocks suggested the existence of opportunities for portfolio persification by investors, particularly, foreign investors operating in the regional as well as global markets7.
8.58 In general, money and bond market segments in Asia showed lower degree of correlation as compared with stock markets. Within countries, bond and money market correlation was negative in many countries, implying that these markets remain segmented in the region (Tables 8.15 and 8.16). The Indian money market showed high correlation with Indonesia, but modest correlation with Hong Kong, Korea and Thailand. India’s money market correlation with Singapore was positive but low, while it remained near zero with Japan and negative with the Philippines and China. The integration of India’s money and bond markets with Asian countries, in the absence of flows across markets, could be attributable, inter alia, to relative strength of India’s financial markets, common participation of foreign institutional investors in the region, emergence of several dedicated funds for investment in India floated by international investors in the Asian region and the existence of offshore market for non-deliverable forwards, especially in Japan and some of the emerging Asian economies.
Table 8.15: Regional Money Market Correlation |
Country |
China |
Hong Kong |
India |
Indonesia |
Japan |
Korea |
Malaysia |
Philippines |
Singapore |
Thailand |
1 |
2 |
3 |
4 |
5 |
6 |
7 |
8 |
9 |
10 |
11 |
China |
1.00 |
|
|
|
|
|
|
|
|
|
Hong Kong |
-0.43 |
1.00 |
|
|
|
|
|
|
|
|
India |
-0.24 |
0.55 |
1.00 |
|
|
|
|
|
|
|
Indonesia |
-0.28 |
0.47 |
0.81 |
1.00 |
|
|
|
|
|
|
Japan |
0.02 |
0.10 |
-0.01 |
-0.04 |
1.00 |
|
|
|
|
|
Korea |
0.01 |
-0.08 |
0.50 |
0.77 |
-0.22 |
1.00 |
|
|
|
|
Malaysia |
-0.15 |
0.18 |
0.41 |
0.47 |
0.09 |
0.39 |
1.00 |
|
|
|
Philippines |
-0.13 |
-0.28 |
-0.46 |
-0.12 |
0.07 |
0.04 |
-0.10 |
1.00 |
|
|
Singapore |
-0.30 |
0.80 |
0.26 |
0.06 |
0.29 |
-0.49 |
-0.02 |
-0.31 |
1.00 |
|
Thailand |
-0.44 |
0.90 |
0.50 |
0.38 |
0.27 |
-0.22 |
0.13 |
-0.24 |
0.92 |
1.00 |
Note : Based on monthly data for the period 2003-2005. Money market rates refer to inter-bank segment.
Source : Regional Integration Database, Asian Development Bank. |
Table 8.16: Regional Bond Market Correlation |
Country |
Hong Kong |
India |
Indonesia |
Japan |
Korea |
Malaysia |
Philippines |
Singapore |
Thailand |
1 |
2 |
3 |
4 |
5 |
6 |
7 |
8 |
9 |
10 |
Hong Kong |
1.00 |
|
|
|
|
|
|
|
|
India |
-0.49 |
1.00 |
|
|
|
|
|
|
|
Indonesia |
0.43 |
0.17 |
1.00 |
|
|
|
|
|
|
Japan |
0.30 |
-0.04 |
0.21 |
1.00 |
|
|
|
|
|
Korea |
0.59 |
-0.33 |
0.57 |
-0.12 |
1.00 |
|
|
|
|
Malaysia |
-0.05 |
-0.30 |
-0.38 |
0.56 |
-0.34 |
1.00 |
|
|
|
Philippines |
-0.48 |
0.15 |
-0.48 |
0.22 |
-0.75 |
0.53 |
1.00 |
|
|
Singapore |
0.66 |
-0.73 |
0.11 |
0.32 |
0.37 |
0.25 |
-0.31 |
1.00 |
|
Thailand |
0.09 |
0.39 |
0.55 |
0.53 |
0.19 |
0.18 |
0.03 |
-0.04 |
1.00 |
Note : Based on monthly data for the period 2003-2005. Bond market rates are yields for domestic 10-year sovereign bonds.
Source : Regional Integration Database, Asian Development Bank. |
8.59 To sum up, past two decades have witnessed rapid increase in the pace of globalisation, led by growing participation of developing and emerging economies. Financial integration has outpaced trade integration. Cross-border flows of real and financial capital have increased sharply, reflecting the decline in the degree of home bias in capital markets. Regional integration in Asia has improved significantly due to liberalisation measures, formation of several regional cooperation agreements and stronger economic activity in the region. The sharp increase in intra-regional trade indicates that regional economies are better integrated. Regional financial integration is manifested in the price co-movements in the stock, the money and the bond markets. Stock markets in the Asian region are better correlated than the bond and the money markets.
8.60 India’s integration with the world economy has increased significantly in terms of trade openness and financial integration. Tariff liberalisation and removal of non-tariff barriers have contributed to India’s trade integration at global and regional levels. India’s capital account has witnessed a structural transformation during the reform period with cross-border non-debt creating private capital flows, emerging as a major component. India is now a major destination for global portfolio equity flows suggesting growing confidence of foreign investors in the Indian economy and financial markets.
8.61 At the regional level, India’s trade links with Asia are growing at a rapid pace, spurred by trade links with China and South-East Asian countries. Also, India’s financial integration with the Asian region has occurred through the linkage of regional stock markets and through modest correlation of bond and money markets.
V. THE WAY FORWARD
8.62 Integrated financial markets are a key element in the transmission process and hence for the smooth conduct of monetary policy. Financial integration also leads to a better persification of risks and makes a positive contribution to financial stability by improving the capacity of economies to absorb shocks. On the other hand, fully integrated financial markets also pave the way for shocks to propagate more quickly among market participants, which could necessitate appropriate safeguards. To mitigate the risks and maximise benefits from financial integration, it is imperative that the financial markets are developed further. Enhanced co-operation among various regulatory authorities is also important for ensuring effective corrective action in an increasingly integrated environment. Further, it is necessary to establish further linkages amongst the various components of financial infrastructure – the trading, payment, clearing, settlement and custodian systems.
8.63 As international experience suggests, integration of the four major segments of the financial market in India, viz., the money, the foreign exchange, the government securities and the credit market segments depends on the conditions such as (i) the ability of market participants to buy and sell (including short-sale) a wide array of cash instruments, subject to applicable restrictions such as those required under mandated capital charge; (ii) the ability of market participants to lend and borrow funds as also securities; (iii) the ability of market participants to trade in derivative instruments in foreign exchange, interest rate and credit; and (iv) the ability of market participants to arbitrage between cash and derivatives instruments. Developments in these areas will have to be calibrated with those in overall market development, institutional sophistication, evolving needs of the real economy and capacity of market participants. Furthermore, for emergence of an integrated yield curve to serve as a benchmark for pricing of all cash and derivative instruments, it is essential that, apart from the government securities market, there should be (a) a term money market; (b) an interest rate futures market; and (c) an interest rate swap market. 8.64 Financial markets in India have come a long way and are getting increasingly integrated domestically and globally. Reform measures in terms of free pricing, removal of barriers to flows and broad-based participation have yielded results in terms of fairly high degree of integration of the money market, the government securities market and the foreign exchange market, although in varying degrees. The money market and the foreign exchange market are reasonably well integrated, which is reflected in the high correlation coefficients between various money market rates and forward premia. The inter-linkage between the domestic money and international markets has also increased as is reflected in the increasing importance of interest rate differentials in the determination of forward premia. In general, the interest rate differential between the domestic money and international markets motivates market participants to shift funds between the markets. Thus, interest arbitrage links the domestic and international money markets and the forward markets.
8.65 The domestic credit market is also getting increasingly integrated with the international capital market as large and creditworthy borrowers have been raising large resources by way of external commercial borrowings. Such corporates are, therefore, less constrained by domestic credit conditions. Raising of resources by banks, the major players in the credit market, by way of external commercial borrowings, albeit within limits, has also integrated the domestic and international credit markets. The money market and the government securities market are also integrated as changes in money market rates are quickly transmitted to government securities yields. The linkage between the money market and the credit market also exists even as some stickiness has been observed in the lending interest rate structure. The inter-linkages between the credit market and the bond market are also growing through asset securitisation by banks. However, the inter-linkages between the equity market on the one hand, and the money, the foreign exchange and the government securities markets on the other, are still weak. The term money market and the private corporate debt market are missing links in the Indian financial markets. There is not much activity in the public issue segment of the corporate debt market, despite availability of good infrastructure, a vibrant equity market and a reasonably developed government securities market. In the corporate debt market, the issuers prefer the private placement segment, which lacks transparency and deprives the retail investor from participating in the debt market. While the need is to further deepen and widen the various segments, which would facilitate better inter-linkages among them, some specific measures that could strengthen the integration process among various market segments are detailed below.
Term Money Market
8.66 A developed term money market is necessary for the development of a money market yield curve. This, in turn, would facilitate the development of the derivative market and the integration of the foreign exchange market and the domestic currency market. Given the critical role the term money market can play in the development of other segments, concerted efforts need to be made to develop the term money market in India.
Domestic Institutional Investors
8.67 Although integration of the equity market with other segments has to emerge from the market oriented process, the need is felt to enhance the role of various domestic institutional investors such as banks, pension and provident funds in the equity market, subject to certain prudential limits as detailed in Chapter VII. This would help in facilitating better inter-linkages of the equity market with other segments, apart from developing domestic institutional investors as a counterweight to FIIs.
Promoting Secondary Markets for various Instruments.
8.68 For effective financial market integration, it is essential that there exist secondary segments for trading of various instruments to provide liquidity and enable efficient risk pricing in various market segments. The secondary segment is nearly absent for financial instruments such as certificates of deposit (CDs), commercial paper (CP) and corporate bonds. For instance, CDs are issued by banks during periods of tight liquidity at relatively higher interest rates (as compared with term deposits). Due to higher interest rate on CDs, subscribers find it profitable to hold CDs till maturity. As a result, the secondary market for CDs has been slow to develop. Similarly, the market for CP is driven by the demand for this instrument mainly by mutual funds whose assets under management have increased manifold in recent years. The price of CP usually ranges between some representative money market rate and the scheduled commercial bank’s lending rate, representing the opportunity cost of funds. Mutual funds hold CP till maturity, leading to a subdued secondary segment for such instruments. In most international markets, the CP is issued on a short-term basis with a rollover facility. This facility, however, is not allowed in the Indian CP market. The secondary market turnover for non-government corporate debt securities has remained insignificant. For instance, the secondary market turnover for non-government corporate debt securities accounted for about two per cent of total turnover for the debt market in the National Stock Exchange of India Ltd. Concerted efforts, therefore, need to be made to develop the secondary markets, wherever they do not exist. The need is to widen the investor base so that pergent views emerge, which would help in creating liquid secondary markets. The need is also felt to incentivise market participants to acquire skills so that they are able to take a forward looking view of emerging macroeconomic scenario and are, thus, encouraged to trade.
Private Corporate Debt Market
8.69 Though corporate bond yields exhibit co-movement with yields on benchmark government securities, empirical evidence supports market imperfection affecting price development in the corporate bond segment, which is the least transparent and illiquid segment of the financial market. As mentioned earlier, the corporate bond market also lacks a secondary segment. The issues relating to the development of the corporate bond market have been addressed comprehensively by the High Level Committee on Corporate Bond Market and Securitisation (Chairman: Dr. R. H. Patil). In order to develop and integrate the corporate bond market with other markets, corporate bonds have to become really tradable instruments. For this purpose, an elevated and significant level of reforms will be needed on the basis of recommendations of the High Level Committee and other measures as detailed in Chapter VII.
Key Role of Government Securities Market in Financial Market Integration
8.70 The government securities market holds the key to better integrated financial markets. Interest rates in government securities serve as a risk free benchmark for the purpose of asset valuation in other markets. Thus, well-functioning and deep government securities market is a necessary condition for integration of financial markets. In the government securities market, turnover in the secondary segment has declined in the recent period. While this could be termed as a cyclical development reflecting banks’ portfolio rebalancing through reduction of SLR holdings to stipulated levels in an environment of high credit demand and rising interest rates, it is critical to recognise that the persistence of such a trend could pose risks to the price discovery process and integration of financial markets. Efforts to sustain the turnover in this segment warrant the formulation of a clear strategy. Turnover in this segment is dominated by Central Government securities. Initiatives to promote trading in other securities, particularly, State Government securities, could be helpful for market development. To impart liquidity to the government securities market, the investor base also needs to be widened. There is also a need to consider various other measures as detailed in Chapter VI.
Securitisation
8.71 Securitisation is gaining acceptance as one of the fastest growing and most innovative forms of asset financing in the global capital market. Asset securitisation could play an important role in promoting integration of the credit market and the debt market in India. Securitisation increases the number of debt instruments in the market. In the case of securitisation, the price of a securitised instrument would tend to converge with the price of a bond. Securitisation, by creating marketability, generates liquidity in the otherwise illiquid portfolio of loan assets of lenders. It also furthers the growth of the bond market by providing investment avenues to investors suiting their risk-return profiles. It, therefore, complements the bond market. In the Indian context, the securitisation market has witnessed a significant growth in recent years. This, therefore, should help in furthering the development of the bond market. The international experience shows that the credit appraisal and documentation process in the hands of the loan originator could be lax, which, in turn, could lead to loss of investor confidence in such instruments. Since securitisation essentially involves repackaging of a pool of a large number of relatively small-sized loan receivables, any reassessment by the market of credit risk of the pool has the potential to cause volatility in prices. Therefore, care would need to be taken to ensure that appropriate credit appraisal and documentation process is followed at the time of origination of loans.
Derivatives Market
8.72 Financial derivatives have played a major role in the development of financial markets and their integration across several economies, especially in developed countries, in the last two decades. Derivatives serve to achieve a more complete financial system because previously fixed combinations of the risk properties of loans and financial assets can be bundled and unbundled into new synthetic assets. For instance, structured products or synthetic derivatives could be created by adding elementary assets or underlying assets such as bonds, stocks (or equities) and borrowing and lending instruments with a combination of derivative products such as put and call options. Repackaging risk properties in this way can provide a more perfect match between an investor’s risk preferences and the effective risk of the portfolio or cash-flow. Derivatives allow individual risk elements of an asset to be priced and traded individually, thus, ensuring an efficient price system in the asset markets. In the Indian context, derivative instruments are available in the foreign exchange market, the money market and the equity market. In the foreign exchange market, the instruments are available in the form of currency forwards, swaps and forward rate agreements (FRAs) and rupee options. Though some of the derivative instruments have recorded growth in recent years, the derivative markets continue to face various rigidities on account of (i) lack of credible term money benchmark; (ii) lack of significant participation by large players such as public sector banks, mutual funds and insurance companies; (iii) absence of cash market for floating rate bonds; and (iv) lack of transparency in price and volume information. It would be desirable to address these issues in future for the development of the derivatives market in India. Thus, the widening of participation and enhancing the depth of the derivatives market by allowing several products could contribute to greater inter-linkages amongst the various financial market segments.
8.73 Since its emergence in the early 2000, the interest rate swap market in India has grown significantly both in terms of volumes and participants. In the absence of a term money market, choice of a transparent benchmark for the floating rate in swap deals has all along been an issue. Much like what happened under similar conditions in some other emerging countries, the market devised the so-called MIFOR swaps that use a synthetic benchmark money market rate, derived from LIBOR and the US $/Rupee forward margin. Impressive growth of the interest rate swap market notwithstanding, the risk free government securities yield curve and the swap curves are not integrated at present. The swap curves have often traded below the government securities curve. Volatility of swap rates in response to changes in short-term rates, has, at times, been higher than yields on government securities. Some policy actions that would result in integration of the government securities yield and swap rates include progressive reduction in SLR, more flexibility with regard to short sale, securities financing arrangements and more open regime in respect of arbitrage between the curves.
Technology Platform
8.74 Integration of financial markets is greatly enhanced with an integrated payment, clearing and settlement infrastructure. The Reserve Bank has been working closely with market participants to improve the infrastructure of financial markets. Payment and settlement systems, which constitute the backbone of the financial economy, aim at minimising the systemic risk. The payment system influences the speed, financial risk, reliability and the cost of domestic and international transactions. With the significant improvements in payment and settlement systems, depth and liquidity of various segments of the financial market have improved. Nevertheless, it is to be recognised that not all trading is done through the technology platform introduced and over-the-counter (OTC) trading continues. There is, therefore, need to enhance participation through the technology platform. The widening of participation through technology platform would reduce the settlement cycle and contribute to faster integration of markets.
Appropriate Risk Management Strategies
8.75 Greater international financial market integration exposes domestic markets to certain risks and contagion. For instance, global financial imbalances, growing sophistication of financial market participants and the proliferation of complex and highly leveraged financial instruments, including credit derivatives and structured products such as collateralised debt obligations, could heighten volatility in the financial markets. Thus, with growing international integration, there would be a need to be vigilant about the risk profile of financial intermediaries and their vulnerability to abrupt market price shocks. This underlines the need for appropriate risk management strategies as also greater coordination and information sharing among central banks to prevent the transmission of adverse developments abroad to the domestic economy and markets.
VI. SUMMING UP
8.76 Domestic financial market integration in India has been largely facilitated by wide-ranging financial sector reforms introduced since the early 1990s. Financial markets in India have acquired greater depth and liquidity. In the process, various market segments have also become better integrated over the years. A high degree of correlation between the long-term government bond yield and the short-term Treasury Bills rate indicates the significance of the term-structure of interest rates in financial markets. Integration of the foreign exchange market with the money and the government securities markets has facilitated liquidity management by the Reserve Bank. However, the equity market has relatively low correlation with other market segments. A sharp improvement in correlation between the reverse repo rate and money market rates in recent years implies enhanced effectiveness of the monetary policy transmission mechanism.
8.77 A key feature of global financial integration during the past three decades has reflected in the shift in the composition of capital flows to developing and emerging market economies, especially from official to private flows. Regional integration has served as a major catalyst to the global integration process during the past two decades. East and South East Asian economies, in particular, have achieved substantial integration. Apart from Asia’s growing integration with the rest of the world, increasing integration within Asia also reflects the growing intra-regional trade and financial flows. Evidence from price-based measures suggests that financial market integration in Asia has been increasing. The stock markets in Asia are more integrated than the money and the bond markets. In the region, Japan, Hong Kong and Singapore serve as the nodal centres for other stock markets.
8.78 There is evidence of India’s growing international integration through trade and cross border capital flows. India’s trade and financial links with Asia are also growing amidst recent initiatives taken to promote regional cooperation. Emerging Asia has become the ‘growth centre’ of the world due to shifting of production base to the region. This is likely to stimulate greater financial integration in the region. India’s financial integration within the region and with the international financial markets is likely to increase in future in view of its robust growth prospects. However, if benefits are to be maximised from a more integrated economy, the need is to pursue efforts towards a greater sophistication of financial markets and financial market instruments that allow risks to be shared more broadly and capital to flow into the most productive sectors. There would also be a need to constantly review the risk management practices so that financial institutions and financial markets continue to remain resilient to adverse external developments. |