by Abhyuday Harsh, Pallavi Pant, Nandini Jayakumar#, Rajnish Kumar Chandra and Brijesh P^ Non-banking Financial Companies (NBFCs) play a vital role in India’s economic growth. These institutions by providing finance for infrastructure, vehicles, housing, and consumer goods, improve aggregate demand, create jobs, and contribute to economic expansion. The growing contribution of NBFCs to credit, particularly to the industrial and retail sectors, is evident in their rising credit-to-GDP ratio. Furthermore, the financial health of the sector continued to be robust in terms of key indicators viz., return on assets, return on equity, net interest margin, capital to risk-weighted assets ratio and non-performing assets ratios. The increase in their share in overall credit along with inter-connectedness with banks and financial markets, have implications for monetary policy transmission. Introduction Non-Banking Financial Companies (NBFCs) represent a critical and dynamic segment of India’s financial system. Registered with the Reserve Bank under the RBI Act, 1934, NBFCs1 are engaged in a variety of financial activities, including, inter alia, provision of loans and advances, acquisition of shares and bonds, hire-purchase finance, and factoring. They play an important role in financing key economic sectors such as infrastructure development, vehicle purchases (both commercial and personal), housing, and consumer durables, thereby stimulating aggregate demand, fostering employment opportunities, and contributing to overall economic growth. The proliferation of NBFCs in India also points to their ability to adapt to market conditions through customised product offerings and quick service delivery to diverse and niche segments. Over time NBFCs have grown in size and significance, implying that any significant disruption in the sector could have repercussions on the financial system and the real economy. The growing systemic significance of NBFCs is underscored by the vigilant and nuanced regulatory oversight adopted by the Reserve Bank. A landmark development in this regard was the implementation of the Scale-Based Regulation (SBR) framework since October 2022, which signified a shift to a more nuanced, risk-calibrated system that acknowledges the heterogeneity within the NBFC sector. This reflects a delicate balancing act by the Reserve Bank, between ensuring financial stability and facilitating innovation in the sector. The growing role of NBFCs in credit intermediation, along with their interconnectedness with banks and financial markets has highlighted their increasing significance in the transmission of monetary policy impulses to the real economy, even as banks continue to serve as the primary conduit. In this light, this article presents the recent performance of India’s NBFC sector. The subsequent article is organised into the following sections. Section II situates India’s non-banking sector in the global context. Section III examines NBFCs’ balance sheet, highlighting their growing significance within India’s financial system. Building on this, section IV explores the issue of the effectiveness of monetary policy transmission in this increasingly important segment. Section V details financial and prudential indicators of the NBFC sector followed by the last section which concludes and discusses key emerging challenges. II. NBFIs: A Global Perspective At the global level, the total financial assets of non-banking financial institutions2 (NBFI) sector demonstrated robust expansion, with a growth of 8.5 per cent outpacing the banking sector’s growth of 3.3 per cent, at end-December 2023. The share of NBFI in global financial assets stood at 49.1 per cent at end-December 2023. Lending by NBFIs across globe also increased by 4.1 per cent, compared to a 3.4 per cent rise in bank lending. Despite the prevailing high-interest rate environment, borrowings by NBFIs also remained strong. The narrow measure of Financial Stability Board (FSB) includes NBFI entities involved in credit intermediation activities that could give rise to banklike vulnerabilities. NBFI under the narrow measure constituted around 30 per cent of total NBFI assets. Narrow measure for advanced economies grew at 10.8 per cent whereas for emerging market economies, it expanded at 5.7 per cent. All economies except India and Saudi Arabia witnessed growth in narrow measure3. For India, this can be attributed to economic function (EF2) which accounts for the largest share in India and reported a contraction due to the merger of a large NBFI with a bank (Table 1). EF2 includes lending institutions dependent on short-term funding and is dominated by finance companies which specialise in areas such as consumer finance, auto finance, retail mortgage provision, commercial property finance, and equipment finance. The FSB conducted a survey on policy tools being utilised in jurisdictions where EF2 is present, such as India. The survey responses indicated that the primary policies adopted included prudential requirements akin to those for banks, capital requirements, leverage limits, restrictions on significant risk exposures among others. Moreover, majority of responding jurisdictions reported enforcing limits on liabilities that NBFI entities can take on from banks and risky clients (Chart 1). Additional measures involved disclosure mandates, registration and authorization procedures, as well as constraints on the range of activities, including the issuance of credit cards. Table 1: Composition of Narrow Measure
(At end-December 2023) | | Economic Function (EF) | Entity Type | Share | Growth | | (Per cent) | | Global | India | Global | India | | EF1 | Collective investment vehicles with features that make them susceptible to runs (e.g., money market funds, real estate funds) | 74.1 | 19.1 | 10.1 | -10.5 | | EF2 | Lending dependent on short-term funding (e.g., consumer credit companies, leasing companies) | 8.5 | 79.7 | 7.6 | -2.3 | | EF3 | Market intermediation dependent on short-term funding (e.g., broker-dealers, custodial accounts) | 7.0 | 0.7 | 16.2 | 49.8 | | EF4 | Facilitation of credit intermediation (e.g., credit insurers, monoline insurers) | 0.2 | 0.0 | 0.2 | 96.1 | | EF5 | Securitisation-based credit intermediation (e.g., Securitisation vehicles, structured finance vehicles) | 7.5 | 0.4 | 3.8 | 7.4 | Note: “Share” denotes the proportion of a specific EF relative to the total, i.e., the sum of EF1, EF2, EF3, EF4, and EF5, for either Global or India, as applicable. Similarly, the growth of a specific EF refers to its Y-o-Y growth, comparing December to December.
Source: Global Monitoring Report on Non-Bank Financial Intermediation, 2024. | In India, NBFCs are the largest component of EF2. Given their systemic importance and diverse business models, NBFCs are regulated through SBR, which envisages a layer-wise progressive increase in regulatory intensity. Thus, NBFCs in the base layer are subject to less stringent regulation than those in middle and upper layers in view of their small size and limited interconnectedness. Apart from capital, prudential, governance and disclosure guidelines, RBI has concurrently emphasised on, enhanced customer protection, with recent measures mandating Key Fact Statements for loans, issuing guidelines on penal charges, ensuring fair practices in the charging of interest, and promoting responsible lending conduct. III. Performance of the NBFC Sector4 III.1. Balance Sheet The NBFC sector in terms of total assets/liabilities continued to register double-digit growth as of end-December 2024. The increase in risk-weights on select categories of retail loans5 by NBFCs in November 2023 contributed to the moderation in the growth of unsecured loans and advances across layers. Borrowings, which are the main source of funds and constitute about two-third of the total liabilities of NBFCs, grew at a higher rate at end-December 2024 than a year ago (Table 2). Assets Loans and advances grew by 15.4 per cent at end December 2024, at a slower rate than the preceding year (Chart 2). As at end-December 2024, unsecured loans constituted 24.0 per cent of gross loans and advances compared with 26.8 per cent a year ago. Unsecured loans of upper layer NBFCs recorded deceleration, broadly reflecting the impact of increased risk-weights. The share of unsecured loans in the credit portfolio of middle layer NBFCs declined from around 32 per cent at end-December 2022 to 25 per cent at end-December 2024 (Chart 3a). In terms of growth, NBF-CUL witnessed a sharp decline in growth of unsecured credit, in relation to the middle layer , which recorded a marginal uptick (Chart 3b). Table 2: Consolidated Balance Sheet of NBFCs
(At end-December) | | (₹ crore) | | Items | 2023 | 2024 | | NBFC | NBFC-UL | NBFC-ML | NBFC | NBFC-UL | NBFC-ML | | Share Capital | 1,37,265 | 4,552 | 1,32,714 | 1,38,288 | 2,807 | 1,35,481 | | | (18.2) | (-36.3) | (21.8) | (0.7) | (-38.3) | (2.1) | | Reserves and Surplus | 9,08,398 | 2,10,254 | 6,98,144 | 11,30,508 | 2,37,014 | 8,93,494 | | | (15.6) | (15.4) | (15.6) | (24.5) | (12.7) | (28.0) | | Public Deposits | 1,06,435 | 85,779 | 20,656 | 1,23,348 | 1,02,439 | 20,909 | | | (-8.1) | (28.4) | (-57.9) | (15.9) | (19.4) | (1.2) | | Borrowings | 31,78,623 | 7,97,075 | 23,81,549 | 36,96,651 | 9,20,520 | 27,76,131 | | | (14.6) | (13.9) | (14.9) | (16.3) | (15.5) | (16.6) | | Other Liabilities | 3,37,404 | 54,013 | 2,83,391 | 3,77,917 | 54,930 | 3,22,987 | | | (15.3) | (1.8) | (18.3) | (12.0) | (1.7) | (14.0) | | Total Liabilities/Assets | 46,68,126 | 11,51,673 | 35,16,453 | 54,66,712 | 13,17,710 | 41,49,002 | | | (14.3) | (14.2) | (14.4) | (17.1) | (14.4) | (18.0) | | Loans and Advances | 37,15,229 | 10,21,556 | 26,93,673 | 42,87,573 | 11,55,044 | 31,32,529 | | | (17.9) | (18.4) | (17.8) | (15.4) | (13.1) | (16.3) | | Investments | 5,15,402 | 61,122 | 4,54,280 | 7,27,957 | 75,128 | 6,52,830 | | | (0.3) | (-10.7) | (2.0) | (41.2) | (22.9) | (43.7) | | Cash and Bank Balances | 1,62,586 | 38,836 | 1,23,749 | 1,80,396 | 54,982 | 1,25,413 | | | (0.8) | (-13.4) | (6.2) | (11.0) | (41.6) | (1.3) | | Other Assets | 2,74,909 | 30,158 | 2,44,751 | 2,70,786 | 32,556 | 2,38,230 | | | (6.6) | (-7.5) | (8.7) | (-1.5) | (8.0) | ( -2.7) | Notes: 1. Data are provisional.
2. Figures in parentheses are y-o-y growth in per cent.
Sources: Supervisory returns; and authors’ calculations. | Liabilities NBFCs primarily raise funds from market and banks, which accounted for 38.7 per cent and 37.4 per cent of their total borrowings, respectively, at end-December 2024 (Chart 4). The sector witnessed considerable deceleration in growth of share capital, partly due to uncertainty in market conditions. NBFCs in the upper layer continued to experience decline in share capital at end-December 2024. Funds raised via issuance of debentures and inter-corporate borrowings grew at a higher rate, while growth in bank borrowing recorded moderation at end-December 2024 (Table 3). Apart from domestic market, NBFCs are taking recourse to external commercial borrowings (ECBs). ECBs also contributes to diversification of sources of funding. The share of NBFCs in total ECBs (registrations) has been rising over the years (Chart 5). III.2. Sectoral Credit Credit portfolio of NBFCs is dominated by loans to industry and retail segment, constituting around 72 per cent of total outstanding of the sector (Chart 6a). At end December 2024, credit to agriculture sector grew at a fast pace owing to robust kharif foodgrain production and good rabi prospects (RBIa, 2024). Retail loans have been resilient growing in double digit, but weakness in industry and services outlook has contributed to moderation of their credit growth (RBIb, 2024). However, credit growth in both segments continued to remain in double digits (Chart 6b). 
| Table 3: Sources of Borrowings of NBFCs | | (₹ crore) | | Items | End- December 2023 | End- December 2024 | Percentage Variation | | Dec-23 over Dec-22 | Dec-24 over Dec-23 | | 1. Debentures | 11,65,408 | 13,14,517 | 9.6 | 12.8 | | 2. Borrowings from Banks | 11,98,257 | 13,84,385 | 16.8 | 15.5 | | 3. Borrowings from FIs | 96,193 | 93,943 | 31.4 | -2.3 | | 4. Inter-corporate borrowings | 1,03,699 | 1,33,754 | 2.0 | 29.0 | | 5. Commercial paper | 1,05,903 | 1,14,820 | 37.1 | 8.4 | | 6. Borrowings from Government | 20,206 | 22,620 | -6.0 | 11.9 | | 7. Subordinated debts | 65,468 | 74,374 | -7.2 | 13.6 | | 8. Other borrowings | 4,23,489 | 5,58,237 | 24.6 | 31.8 | | Total borrowings | 31,78,623 | 36,96,651 | 14.6 | 16.3 | Note: Data are provisional.
Sources: Supervisory Returns; and authors’ calculations. |
 A layer wise analysis of the sector shows the dominance of credit to industry by NBFCs in the middle layer due to the presence of government owned NBFCs, followed by retail and services loans. Whereas upper layer is mainly concentrated in retail loans segment with a share of more than 60 per cent, followed by services (Chart 7). Vehicle and loans against gold are the largest segments in retail portfolio of NBFCs, comprising 34.9 per cent and 12.6 per cent of total retail loans respectively. Vehicle loans grew robustly in line with rising demand, growing population, and rising annual sales in passenger vehicle market in 2023-24 (SIAM, 2025). Gold loans which have a strong presence in rural and semi urban markets also grew at double digit catering to underserved sections of the society. Micro finance loans saw a sharp deceleration in growth (Table 4). Microfinance Industry Network (MFIN) has issued guardrails6, which capped loan outstanding per borrower. IV. Monetary Policy Transmission Owing to their substantial credit intermediation to crucial sectors of the economy and interlinkages with banks and other financial entities, NBFCs have gained salience in facilitating the transmission of monetary policy to the broader economy, even as banks continue to be the primary channel of transmission. NBFCs’ dependence on bank and market borrowings results in a transmission mechanism that is more indirect7 as compared to banks. A change in policy rate impacts NBFCs via their cost of funds, which moves when market and bank interest rates respond to monetary policy. 
 In this regard, an attempt has been made to examine whether NBFCs’ borrowing and lending rates respond to changes in relevant rates by a representative sample of top 100 NBFCs based on asset size. The methodology of loan pricing is not uniform across NBFCs. While some NBFCs adopt their own prime lending rates as interest rate benchmarks, others rely on base rates/MCLRs of banks as external benchmarks; a few do not have any interest rate benchmark for their loan pricing. The lack of transparency has resulted in difficulty in assessing transmission of monetary policy in this segment of financial market (RBI, 2021; Patra, 2022). A dynamic panel model is estimated using generalised method of moments (GMM) methodology on an unbalanced panel8, covering the period from March 2019 to December 2024 covering 86 per cent of the assets of NBFC sector (at end-March 2024). To understand transmission on the liabilities side of NBFCs’ balance sheet, weighted average borrowing rate (WABR) of NBFCs is considered as the dependent variable, which is calculated by using available instrument-wise borrowing rate of every NBFC, weighted by their respective outstanding amounts. Similarly, on the asset side, weighted average lending rate (WALR) is calculated by using available sectoral lending rates weighted by their respective outstanding amounts. Repo rate, weighted average call rate (WACR; operating target of monetary policy), and the 91day T-bill rate (benchmark rate representing broader financial conditions) are used as independent variables. Additionally, two other rates which are relevant to NBFCs are also considered: average bond yield of AAA and AA-rated NBFCs and the WALR of bank lending to NBFCs. This is because NBFCs are largely dependent on banks and markets for their funding requirements9. A change in these rates affects the cost of funds for NBFCs, in turn affecting their lending rates. | Table 4: Retail Loans of NBFCs | | (₹ crore) | | Items | End-December 2023 | End-December 2024 | Percentage Variation | | Dec-23 over Dec-22 | Dec-24 over Dec-23 | | 1. Housing Loans | 26,364 | 38,106 | -4.4 | 44.5 | | 2. Consumer Durables | 42,343 | 50,297 | 43.6 | 18.8 | | 3. Credit Card Receivables | 53,479 | 60,603 | 28.7 | 13.3 | | 4. Vehicle/Auto Loans | 4,28,654 | 5,18,408 | 25.6 | 20.9 | | 5. Education Loans | 39,500 | 62,572 | 75.6 | 58.4 | | 6. Advances against Fixed Deposits | 124 | 174 | -58.2 | 40.9 | | 7. Advances to Individuals against Shares, Bonds | 16,813 | 22,432 | 33.3 | 33.4 | | 8. Advances to Individuals against Gold | 1,43,745 | 1,87,350 | 20.0 | 30.3 | | 9. Micro finance loan/SHG Loan | 1,31,795 | 1,32,819 | 39.2 | 0.8 | | 10. Others | 3,13,740 | 4,11,962 | 27.0 | 31.3 | | Total Retail Loans | 11,96,557 | 14,84,724 | 27.7 | 24.1 | Note: Data are provisional.
Sources: Supervisory returns; and authors’ calculations. | NBFC-specific factors such as size (log of total assets), capital adequacy, (capital to risk-weighted assets) and profitability (return on assets, taken as a ratio of net profit to total assets) are used as controls. To control for the macroeconomic environment, real GDP growth rate and consumer price inflation are included. A dummy for the COVID-19 pandemic, which takes the value one during June-September 2020, and zero otherwise is also included. 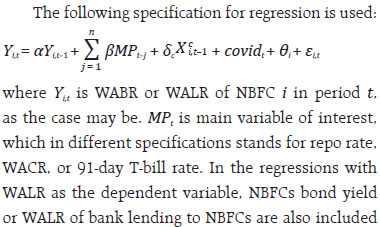  Results indicate that changes in the various aforementioned relevant rates have a positive and significant effect on NBFCs’ WABR and WALR, implying transmission albeit incomplete. The summed coefficient of repo rate, WACR, 91-day T bill rate, NBFC bond yield and WALR of banks to NBFCs is reported, which gives the cumulative impact of change in the relevant interest rate on the WABR/ WALR of NBFCs over three quarters. On the borrowing side, a one percentage point change in repo rate is associated with a 0.24 percentage point change in WABR of NBFCs over three quarters. Similar results with WACR (0.21) and 91-day T bill rate (0.19) are reported as well. In all specifications, the coefficient of the lagged dependent variable is positive and highly significant, indicating persistence. Among controls, the coefficient for the size and return on assets variables are negative and significant, indicating that larger and more profitable NBFCs can borrow at lower rates (Table 5). On the lending side, a one percentage point change in repo rate is associated with a 0.33 percentage point change in WALR of NBFCs over three quarters (0.36 percentage point change when WALR of Banks to NBFCs is considered). Similarly, WALR of NBFCs is found to be positively associated with WACR (0.22), 91-day T-bill rate (0.24) and NBFC bond yield (0.17) as well (Table 6). On the borrowing side, a key impediment to transmission could be the higher cost of funds faced by NBFCs. NBFCs rely on bank and market borrowings for their funding requirements and unlike banks, do not have direct access to the liquidity adjustment facility (LAF) window. Consequently, reductions in the repo rate may not immediately translate into reduced cost of funding. Further, bank and market funding to NBFCs may also be dependent on liquidity conditions and perceived levels of riskiness, which may further dampen transmission. On the lending side, since NBFCs cater relatively to riskier borrower segments, they charge higher interest rates to account for potential defaults, which may further dampen adjustment of lending rates to changes in relevant rates. V. Financial and Prudential Indicators Profitability as indicated by return on assets (RoA), return on equity (RoE) and net interest margin (NIM) remained at healthy levels across the layers at end-December 2024 (Chart 8). The Reserve Bank has been closely monitoring key indicators, viz, Capital to Risk-weighted Assets Ratio (CRAR), Tier-1 capital ratio and net NPA ratio (NNPA) under the prompt corrective action (PCA) framework, which has been effective for NBFCs10 since October 2022. So far, no NBFC has been placed under the PCA framework by the Bank. Asset quality of the NBFC sector has continued to improve in the recent years as reflected in consistent decline in NPA ratios. At end-December 2024, GNPA and NNPA ratios stood at 3.4 and 1.2 per cent, respectively. While asset quality of middle layer is in alignment with the overall sectoral trend, the upper layer witnessed a mild uptick in NPA ratios at end- December 2024 (Chart 9). At end-December 2024, NBFCs’ credit portfolio has stayed healthy, with moderation in GNPA ratios across sectors, except agriculture and allied activities (Chart 10). After a significant improvement in the asset quality at end-December 2023, MSME credit portfolio of NBFCs has continued to remain strong with stable level of GNPA ratio at end-December 2024 (Chart 11). Asset quality of retail loans continue to remain stable despite the strong growth in retail loans. However, GNPA with regard to microfinance loans increased at end-December 2024 (Chart 12). NBFCs along with SROs in the microlending space should remain vigilant to ensure responsible lending practices and credit discipline among market participants. NBFCs have consistently maintained capital buffers on their balance sheet, even beyond the regulatory requirement. At end-December 2024, at an aggregate level, the upper layer and the middle layer kept CRAR of 20.6 per cent and 28.6 per cent, respectively (Chart 13). The disparity in the level of CRAR between the upper layer and the middle layer is mainly due to difference in ownership structure. Large government-owned NBFCs - which are placed in the middle layer by regulatory design have periodic capital infusion, resulting in higher CRAR. In contrast the upper layer, which comprises, private NBFCs are driven by profit and growth, often run with leverage and riskier loan books. 
  In November 2019, the Reserve Bank introduced Liquidity Coverage Ratio (LCR) framework for NBFCs to strengthen their liquidity risk management. By mandating a buffer of High-Quality Liquid Assets11 (HQLAs) sufficient to cover net cash outflows over a 30-day stress scenario, the LCR enhances the short-term resilience of NBFCs. To ensure a smooth transition, the LCR requirement was implemented in a phased manner from December 1, 2020. All non-deposit taking NBFCs with assets of ₹10,000 crore and above, and all deposit-taking NBFCs, had to maintain a minimum LCR starting at 50 per cent on December 1, 2020, and reach 100 per cent by December 1, 2024. All non-deposit taking NBFCs with assets between ₹5,000 crore and ₹10,000 crore followed a similar trajectory starting at 30 per cent. This calibrated approach allowed NBFCs to gradually align with the new norms while preserving sectoral liquidity and credit flow.  As on December 2024, the sector has been maintaining LCR beyond the regulatory requirement (Chart 14). This cautious approach may be due to the sector’s reliance on short-term funding for long-term assets, which exposes them to liquidity mismatches and systemic risk. The LCR mitigates such vulnerabilities, promoting stability and market confidence.
VI. Conclusion FSB in its report noted that, globally NBFI sector’s growth outpaced growth of the traditional banking sector. In India, NBFCs continued to record double-digit credit growth as of end-December 2024. This expansion is evident from a rising NBFC credit to GDP ratio sustained by lending to industry and retail sector, which continue to dominate their portfolio. NBFC sector remains robust in terms of various profitability and prudential indicators such as return on assets, return on equity, net interest margin, capital to risk weighted assets and non-performing assets. The spike in growth rate of unsecured loans was contained through increase in risk weights in November 2023. With regards to sources of finance, NBFCs continue to rely largely on bank borrowings and debentures. NBFCs’ role in credit intermediation and interlinkages with banks and other financial institutions have implications for transmission of monetary policy impulses to the financial sector and real economy. Empirical analysis points to the fact that there is monetary policy transmission to NBFCs’ borrowing and lending rates, albeit, incomplete. The prospects for segments like vehicle loans and loans against gold appear robust, buoyed by improvements in vehicle sales and rising gold prices. The introduction of LCR is set to further bolster NBFCs’ short-term resilience. As the financial sector increasingly adopts artificial intelligence and machine learning, NBFCs must remain vigilant and proactively address cyber challenges by leveraging these new opportunities effectively. References FSB. (2024). Global Monitoring Report on Non-Bank Financial Intermediation. Patra, M. D. (2022). Lost in Transmission? Financial Markets and Monetary Policy. Speech by Dr Michael Debabrata Patra, Deputy Governor, Reserve Bank of India. RBI. (2021). Report on Currency and Finance. RBIa. (2024). Minutes of the Monetary Policy Committee Meeting, December 4-6. RBIb. (2024). Report on Trend and Progress of Banking in India. SIAM. (2025). Performance of Indian Auto Industry in 2023-24. Retrieved from https://www.siam.in/statistics.aspx?mpgid=8&pgidtrail=9
|