This article addresses some structural risks inherent in open-ended debt mutual funds in India, stemming from correlated redemption pressures in the context of COVID-19. The article proposes some modifications in the extant policy framework to help mitigate the spillover risks from the debt mutual fund sector. Introduction COVID-19 has led to a widespread and synchronised retreat from credit risk exposures in both advanced and emerging market economies, leading to large asset price corrections in debt markets amidst amplified volatility. In its trail a rush for liquid cash and safe assets has sparked a simultaneous selloff across market segments. It has also exposed the financial channels of contagion, mutually reinforcing interactions across such segments. In recent times, the dramatic growth in resources flowing to mutual funds suggests a discernible shift in the pattern of deployment of financial savings in India. Net assets under management (AUM) of debt/income oriented mutual fund schemes have grown from ₹6.94 trillion as at end-March, 2015 to ₹11.97 trillion as at end-March, 2020, an increase by about 70 per cent in a span of 5 years. In this milieu, the recent episode of a debt portfolio manager halting withdrawals has brought the spotlight to bear on the functioning of open-ended mutual funds in times of crisis. This article highlights the dominance of institutional investors in debt mutual funds, ineffective diversification and the lack of a robust valuation framework as factors that play an important role in accentuating the withdrawals from such funds in a stress situation. Lack of credible counterparties in a shallow secondary bond market leads to large swings in prices, accentuating risk aversion. Furthermore, there is a significant short-term clustering of liabilities of non-banking financial companies (NBFCs)/housing finance companies (HFCs), raising concerns regarding the ability of these entities to service such liabilities, in the context of the moratorium on repayments. The possibility of adverse feedback loops developing in the financial system through mutual funds, which hold a significant share of these assets in their portfolios, has heightened the risks to overall financial stability. The article is structured into five sections. Section II sets out the broad categorisation of the open-ended debt mutual funds used in the analysis. Section III outlines some recent international developments in the debt mutual funds sector. Section IV discusses some issues relating to debt mutual funds in India and Section V provides some policy suggestions and concluding observations. II. Open-ended Debt Mutual Funds Mutual fund (MF) schemes can be classified into four categories, keeping in mind guidelines of the Securities and Exchange Board of India (SEBI) on categorisation and rationalisation of mutual fund schemes. Schemes allowed overnight exposure only are grouped under overnight funds. Second, there are schemes that are allowed exposure to instruments with a tenor upto 1 year, they include liquid funds, ultra short duration funds, low duration funds and money market funds. Third, duration funds, which are categorised based on Macaulay duration of the portfolio (greater than 1 year), i.e., short duration funds, medium to long duration funds and funds allowed to invest across duration. Fourth, those funds that predominantly invest in corporate bonds such as credit risk fund and corporate bond funds (Chart 1). III. Recent International Developments Market-based finance complements the banking system in providing finance and other intermediation services, and has been growing across the globe. Around half of the financial sector assets, both in the UK and globally (FSR, Bank of England, 2019) are accounted for by the non-bank financial system. The total assets managed by regulated open-ended funds world-wide have increased to around USD 59.2 trillion by Q4:20191. Liquidity risk management in the asset management sector has attracted considerable attention over the past few years2, 3. In the wake of the global financial crisis, regulators across jurisdictions have started adopting redemption gates4, swing pricing5 or side pocketing6 to deal with these concerns. Regulators’ apprehensions have been renewed in the wake of the suspension of the LF Woodford Equity Fund in June 2019. Following the suspension, steps have been announced by sector-specific regulators such as the European Securities and Markets Authority (ESMA) publishing guidance on liquidity stress tests for investment funds, which is to be used as a tool to mitigate this risk. In India, the SEBI introduced a risk management framework for liquid and overnight funds which posits that liquid funds will hold atleast 20 per cent of their net assets in liquid assets. Nonetheless, there are specific features of Indian markets, which make open-ended debt funds particularly susceptible to a “run risk”. IV. Investor Profile of Debt Mutual Funds in India The December 2018 edition of the Financial Stability Report (FSR) (in the wake of IL&FS crisis) highlighted the role of non-retail investor dominance in debt funds (Chart 2). Corporates and high net-worth individuals (HNIs)comprise more than 90 per cent of the aggregate assets under management (AUM) of debt funds; in sharp contrast, their share in equity funds is 48 per cent. HNIs and corporate investors are generally cost conscious. While expense ratios are capped through regulations, large fund houses enjoy an advantage in being able to spread fixed costs over a large AUM and be cost competitive. Hence, corporate dominance in investment may lead to concentration in fund management as smaller fund houses are unable to compete on expense ratios. Moreover, a large fund size is also incentive compatible from an investor point of view – such funds have significant systemic spillovers, potentially improving bailout possibilities.7 In theory, the risk of stampedes due to corporate fleet footedness can be mitigated by ensuring that no single investor contributes a disproportionate share of any scheme of an asset management company (AMC). The extant regulations specify single investor concentration norms to diversify the investor base. However, when the investor profile is as dominated by risk averse investors as is the case in money market/debt mutual funds, there still is a strong possibility of a few corporates distributing their surplus over four/five fund houses, and hence stress time exits could still be concerted. 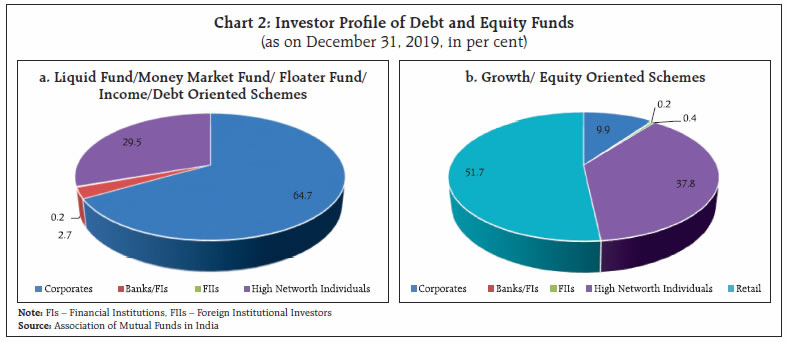 Recent portfolio performance plays a disproportionate role in incremental inflows, typically masking illiquidity premium as (short-run) excess returns. Since illiquidity in the portfolio is not internalised by the AMCs (owing to pass through nature of the funds) while the (short-run) excess returns arising out of such illiquidity have significant near-term upsides for portfolio managers in terms of excess corporate flows - debt mutual funds show significant pro-cyclical behaviour by loading of spread risk when interest rate views are not benign and the resultant illiquidity of the portfolios is sought to be (partially) resolved through bank credit lines. Such arrangements have inbuilt spillover of liquidity risk from the corporate bond market to inter-bank funding market. Valuation framework and implications The dislocation arising out of the IL&FS incident-induced risk aversion and the valuation framework for corporate bond has already been highlighted (FSR, RBI-2018). However, the general view in the MF industry seems to have been that enough safeguards in the valuation framework are present to contain the credit risk of mutual fund portfolios8, even as open ended debt funds are less liquid than they are supposed to be (given their open-ended nature) as the underlying assets themselves turn more and more illiquid. Some of the deficiencies in valuation and risk management framework of debt securities have been addressed (SEBI, 2019)9, 10. However, valuation of securities across the credit risk spectrum under correlated withdrawals amidst extreme risk aversion remains a challenge. COVID-19 disruption and secondary market liquidity The issue of secondary market liquidity in corporate bonds has been highlighted in the context of recent COVID-19 induced debt market disruption globally11.12. Even in the US, the most liquid market of all, significant divergences in corporate bond exchange traded funds (ETFs) and the underlying bond values have been observed (occasionally the discounts in ETFs exceeded 5 per cent compared to the valuation based on debt). In the Indian scenario, the issue becomes more acute as the structural aspects discussed earlier tend to accentuate effects due to redemptions during stress times. In the case of a significant withdrawal across mutual funds, counterparties of a MF corporate bond sale may not be forthcoming. Banks and other institutional investors are typically ruled out of market activities in times of turbulence, largely on account of risk aversion and/or on account of the fact that they already have significant loan-related exposures to the underlying obligors and regulatory/risk exposure limits constrain their behaviour during times of market volatility. Hence, two design features of MF industry micro structure stand out. First, debt MFs’ investor profile makes them particularly more susceptible to a run. Second, in case of large correlated withdrawals specifically during stressed times, when credible counterparties are absent to provide liquidity, markets witness large swings in prices accentuating risk aversion. Spillovers The financial sector leads the debt holding pattern of mutual funds, with banking/term lending, financial services/investments and HFCs accounting for about 69.3 per cent of the total corporate bond holdings as on March 31, 2020 (Chart 3.a). This is also true of money market instruments (Chart 3.b). Redemption pressures are clearly evident from the dip in the AUM of open-ended debt mutual funds (in which corporates and HNIs are the biggest investors) post January 2020. The moratorium extended by NBFCs/HFCs on their assets has given rise to concerns about their ability to service the interest/maturing liabilities, with potential spillovers to mutual funds. 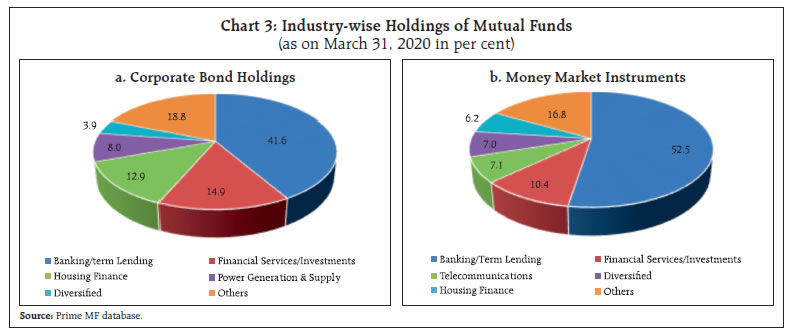 The portfolio composition of MF debt funds shows that the emphasis is on private entities, largely on account of the fact that financial instruments of public sector undertaking (PSU) NBFCs/HFCs are generally more amenable to generate funds, compared to most private sector (Non-PSU) NBFCs, irrespective of the underlying ratings (Chart 4). In this regard, the significant holdings of commercial paper (CP) liabilities of Non-PSU NBFCs highlight the importance of the MF sector in funding needs of private NBFCs – a possible spillover route through which stress in this particular segment of the financial sector may affect funding to the real sector. Tracking the maturity profile of private entities, a significant bunching of maturities of CPs for private NBFCs upto 90 days is being observed (Chart 5 and 6). There is significant bunching of maturity proceeds across top two rating grades upto 90 days for private NBFCs. As regards corporate debt for private NBFCs/HFCs some clustering from the 61-90 day bucket is observed, although maturity proceeds are typically dominated by ‘AAA’ rated NBFC/HFCs (Charts 7 to 9). Composition of corporate bond funds Delving into the composition of corporate bond funds, the two constituent fund categories, viz., corporate bond funds and credit risk funds have very different compositions/characteristics. Based on March 31, 2020 data, about 97.3 per cent of the corporate bond holdings of the corporate bond funds are rated ‘AA’ and above (Chart 10). Large PSUs and diversified private sector corporates largely form a significant proportion of the Non-convertible debentures (NCD) corpus. In sharp contrast, about 53.5 per cent of the corporate bond holdings of the credit risk funds are rated ‘AA’ and above. Furthermore, credit risk funds have sizeable exposure to cyclical assets such as commodity companies or industries severely impacted by the COVID-19 pandemic such as automobiles. While such a contrast in composition is certainly driven by the regulatory mandates (minimum 80 per cent investment in highest rated instruments for corporate bond funds vis-à-vis minimum 65 per cent investment in below highest rated instruments for credit risk funds), it may be difficult to generate liquidity out of the credit risk fund in case of a severe market dislocation. 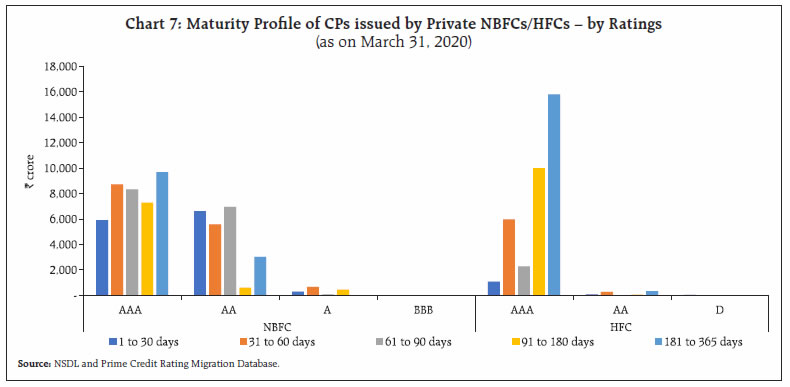 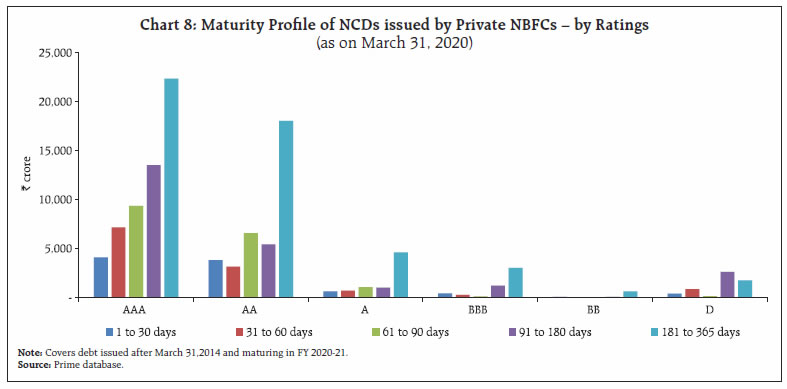 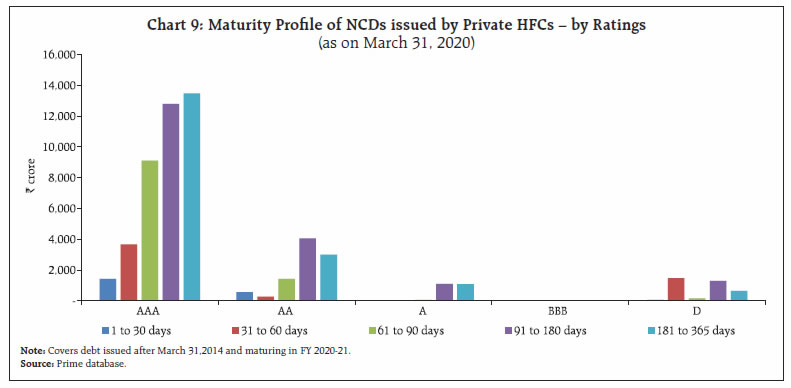 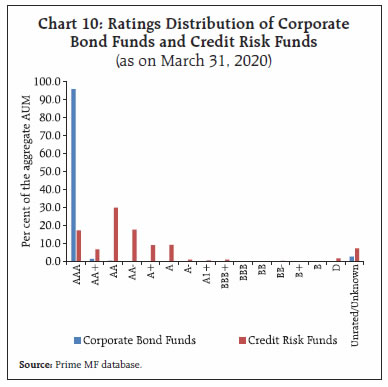 V. Conclusion: Policy Responses and the Way Forward Vulnerabilities of the open-ended debt mutual fund model in India get accentuated by the shallow secondary corporate debt markets. After the recent instance of suspension of withdrawal from a specific scheme of an AMC, the Reserve Bank of India had stepped in with a Special Liquidity Facility for Mutual funds amounting to ₹50,000 crore to address the possible spillovers to other parts of the financial market and to safeguard financial stability. This decision has helped to reduce the liquidity stress and restore confidence in the financial markets. Sound policy frameworks should be supported by credible and effective financial safety nets, reinforced by short-term liquidity support from central banks. However, any amount of liquidity support cannot address solvency issues, weaknesses in investment design and incentives thereof for fund managers, and a widespread risk aversion. Offering Mutual Fund units repayable on demand where the net asset value (NAV) impact is passed through to the investor is akin to offering deposits repayable on demand as in banks but without the cushion of high quality liquid assets (HQLAs)/ reserve requirements / lender of last resort and hence amounts to significant regulatory advantage. The issue is particularly relevant for jurisdictions where the investor base is narrow/concentrated and secondary debt markets are illiquid. Given the issues of incentive compatibility through bail-out mechanisms and attendant moral hazard issues brought in by size, there is clearly a need to balance the growth in AUM with additional liquidity buffers to moderate risk and spillovers. One particular way to address the same may be through stipulating that the ratio of government securities in incremental holding should increase as the size of a debt scheme increases. References Financial Stability Board & IOSCO (2015), “Assessment Methodologies for Identifying Non-Bank Non-Insurer Globally Systemically Important Financial Institutions”, Financial Stability Board. Bank of England (2019), “Tackling vulnerabilities in open-ended funds”, Financial Stability Report, No.45. Nicola Cetorelli, Fernando M. Duarte, and Thomas M. Eisenbach (2016), “Are Asset Managers Vulnerable to Fire Sales”, Liberty Street Economics Blog, Federal Reserve Bank of New York. RBI (2018) Financial Stability Report, June, Mumbai. RBI (2018) Financial Stability Report, December, Mumbai.
|