India is a major producer of several agricultural/food items in the world but only less than 10 per cent of that is processed. Demand for processed food items is set to increase in India in the coming years providing opportunities for greater value addition, lower wastages and alternative employment opportunities. Analysis of corporate data shows that food processing firms have been profitable, but the value addition component needs to increase significantly. Introduction India has made vast progress overtime in providing food security for its people and has become largely self-reliant in agriculture. Accordingly, the policy focus has shifted from attaining self-sufficiency to generating higher and stable income for the farming population. Food processing industry (FPI) is one area which has the potential to add value to farm output, create alternate employment opportunities, improve exports and strengthen the domestic supply chain. India, with about 11.2 per cent of total arable land in the world, is ranked first in the production of milk, pulses and jute, second in fruits and vegetables and third in cereals (Government of India, 2019). It is also the sixth largest food and grocery market in the world (Law, et al., 2019). In 2017-18, the food processing industry accounted for 7.9 per cent of manufacturing GVA and 9.5 per cent in agricultural value added. It is also a major employment provider, contributing to 11.4 per cent of organised manufacturing employment. Recognising the immense potential of FPI in promoting inclusive growth, it has been identified as one of the key thrust areas under the ‘Make in India’ Programme. This article examines the scope for higher growth in this sector in the medium run, notwithstanding the challenges. Limited availability of granular data, particularly at sectoral level has been a major impediment to robust analytical research on the subject. This article tries to present information available from multiple sources at one place. For overall analysis, National Account Statistics is used. Sectoral analysis is based on data sourced from the Annual Survey of Industries (ASI), which captured 65.7 per cent of value added generated in the sector in 2016-17. For data on trade, the World Integrated Trade Solution (WITS) database is used. International Standard Industrial Classification is used to make industry level comparison with trade data. For the analysis of financial parameters, we have used data from annual company finance studies by the Reserve Bank of India. Set against this context, this article is divided into five sections. Section II provides a global perspective on the food processing sector. Section III elaborates the current status of FPI in India and presents inferences drawn on the basis of relevant statistical analysis. Government initiatives for harnessing the potential of the sector are discussed in Section IV. Section V sums up the paper. II. Evolution and Cross-Country Experience Food processing is defined as transforming agricultural products into food that are in consumable form or transforming one food item into another by adding value to it (Government of India, 2019). Based on physical properties of the final product, the Ministry of Food Processing Industries categorises food processing under two sub-categories, viz., (i) manufactured processes, whereby the original physical properties of the product undergo a change through a process [involving employees, power, machines or money] and the transformed product is edible and has a commercial value and (ii) other value-added processes where the product does not undergo any manufacturing process, but gains significant value addition like increased shelf life, shelled and ready for consumption, etc. Depending on the type and extent of value addition, it is categorised as primary and secondary processing. Primary processing relates to conversion of raw commodity to one that is fit for consumption. It involves steps such as drying, threshing, cleaning, grading, sorting, packing, etc. Secondary processing involves creation of value added products like bread, wine, sausages, etc. The large scale commercial production of ready to eat food items has brought in another category to food processing, viz., tertiary processing (Government of India, 2019). The importance of processed food items in the consumer basket has increased globally over time. With higher income, urbanisation, demographic shifts, improved transportation and changed consumer perceptions regarding quality and safety, food consumption patterns have changed over the years (Regmi, 2001; and Wilkinson & Rocha, 2008). Further, advertising through mass media/social media is also found to have led to higher demand-led food processing industry (FPI) growth in India, Malaysia, China, Philippines and Thailand (Regmi and Gehlhar, 2005). Global retail sales of processed food items were more than three times higher than sales of fresh food in 2002 (Regmi and Gehlhar, 2005). In the case of India, overall per capita sales of packaged and processed foods nearly doubled from USD 31.3 in 2012 to USD 57.7 in 2018 (Law et al., 2019). Table 1 shows the evolution of food industry in the different parts of the world. Estimates reveal that 30 per cent of food in China is processed as against 60-80 per cent in western countries (Liu, Taylor and Zhang, 2007). In the case of fruits and vegetables, KPMG (2007) reported that 65.0 per cent of total output in USA is processed, 78.0 per cent in the Philippines and 23.0 per cent in China. Similarly, overall processing of agricultural produce is around 30.0 per cent in Thailand, 70.0 per cent in Brazil, 78 .0 per cent in the Philippines and 80.0 per cent in Malaysia. As per the same report, processing level in India is very low at 2.2 per cent for fruits and vegetables, 35.0 per cent for milk, 21.0 per cent for meat and 6.0 per cent for poultry products. In 2010-11, share of raw food entering the processing channel has been estimated at 6.8 per cent in 2010-11 (Ghosh, 2014). | Table 1: Evolution of Global Food Demand | | Demand for food products→ | Diet, functional and organic foods | | North America, Japan, Western Europe and Australia | | Convenience foods, snacks and prepared meals | | Eastern Europe | | | Dairy, meat, fresh fruits, fruit juices, beverages | | India, China and Latin America | | | Carbohydrate staples | Africa (Sub Saharan) | | | Indicators | Surviving | Mass Market | Convenience food service snacking and quality hygiene | High technology | | Industrial Development→ | | Source: Ministry of Food Processing industries (MOFPI), GoI. | The FPI in developing countries is at nascent stage as compared to the developed countries (Table 2). India’s share of FPI in manufacturing value added is low even among developing countries. As per the Food and Agriculture Organisation (FAO) data, items processed from crops accounted for more than half of total production of processed items in 2014 and its share has increased from 52.6 per cent in 1990 to 58.4 per cent in 20141. Meat products at the second place accounted for 26.0 per cent of total processed food production, followed by milk products. Beer from barley and sugar accounted for nearly half of total production of crop based processed items, while skimmed milk was the major item in the processed milk group. | Table 2: Share of Manufacturing of Processed Food, Beverage and Tobacco Products in Manufacturing GVA and Total GVA | | Country | Financial year | GVA | Manufacturing | | India | 2017* | 1.7 | 9.7 | | Indonesia | 2018 | 7.5 | 35.5 | | Australia | 2018 | 1.5 | 26.0 | | New Zealand | 2013 | 4.6 | 34.3 | | Canada | 2018 | 1.8 | 17.1 | | USA | 2018 | 1.3 | 11.4 | | Denmark | 2018 | 1.5 | 10.7 | | France | 2018 | 2.2 | 16.2 | | Switzerland | 2011 | 2.2 | 11.4 | *: April-March 2017-18
Source: CEIC Database and Authors’ Calculation. | International trade in processed food items also showed a similar pattern with products from crops accounting for a major share followed by meat and meat products, and fish and fish products in 2018 (Chart 1). The share of processed food in world exports in value terms has remained stable over the years. In 2018, it accounted for 6.5 per cent of total world processed exports and 5.7 per cent of total world exports. Exports of processed food mirrored agriculture exports, though registered higher growth than the latter resulting in higher value realisation (Chart 2). In 2018, export of processed food items were 1.6 times higher than that of total agricultural exports. With the increasing importance of processed food in consumers’ food basket, quality standards have also emerged as an important factor with new regulations. The food system is being regulated through a mix of private-public standards which provide the basis of competitive strategies while also proving to be entry barriers (Wilkinson & Rocha, 2008; and World Trade Organisation, 2012). The implementation of quality standards has been an issue of contention between developed and developing countries. III. Food Processing Industry in India The food processing industry in India is at a nascent stage, accounting for less than 10 per cent of total food in India (Government of India, 2016). It is expected that improvement in food processing would reduce wastages in agricultural produce. At present food wastages are very high. According to the report of Central Institute of Post-Harvest Engineering and Technology (CIPHET), wastages in major crops, in general, remained at high level during 2010-2015 (Table 3). 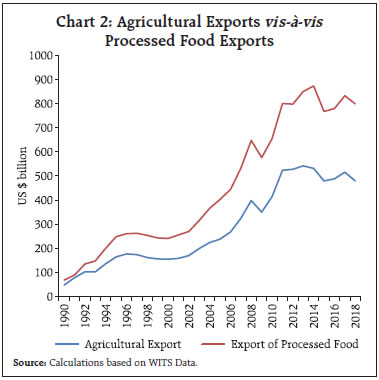
| Table 3: Wastages in Key Horticulture and Cereal Crops | | (As percentage of production) | | | As per CIPHET Report 2010 | As per CIPHET Report 2015 | | Cereals | 3.9 – 6.0 | 4.65 – 5.99 | | Pulses | 4.3 – 6.1 | 6.36 – 8.41 | | Oil seeds | 2.8 – 10.1 | 3.08 – 9.96 | | Fruits & Vegetables | 5.8 – 18.0 | 4.58 – 15.88 | | Milk | 0.8 | 0.92 | | Fisheries (Inland) | 6.9 | 5.23 | | Fisheries (Marine) | 2.9 | 10.52 | | Meat | 2.3 | 2.71 | | Poultry | 3.7 | 6.74 | | Horticultural Crops | | | | Guava | 18.0 | 15.9 | | Mango | 12.7 | 9.2 | | Apple | 12.3 | 10.4 | | Grapes | 8.3 | 8.6 | | Papaya | 7.4 | 6.7 | | Banana | 6.6 | 7.8 | | Cereal Crops | | | | Wheat | 6.0 | 4.9 | | Paddy | 5.2 | 5.5 | | Bajra | 4.8 | 5.2 | | Maize | 4.1 | 4.7 | | Source: Ministry of Food Processing Industries (MOFPI), GoI. | The FPI accounts for a prominent place among sectors in terms of share in employment in the manufacturing sector and because of its labour-intensive nature it has higher multiplier effect on the overall economy. As per ASI data, FPI has emerged as the highest employment provider among the industry groups2. However, its share in manufacturing and total GVA declined reflecting slower growth compared with other sectors of the economy (Table 4). The exports of processed food in proportion to exports of raw food, on the other hand, has significantly increased during this period. | Table 4: Status of Food Processing Sector | | (Per cent) | | Indicators | 1990-91 | 2000-01 | 2010-11 | 2016-17 | 2017-18 | | Share in Total Value Added | 1.5 | 1.5 | 1.3 | 1.4 | 1.4 | | Share in Manufacturing Value Added | 9.4 | 9.4 | 7.4 | 7.7 | 7.9 | | Share in Manufacturing Employment | 13.2 | 15.4 | 12.1 | 11.4 | 11.4 | | Share in Total Manufacturing Exports | 5.1 | 5.4 | 2.9 | 4.4 | 4.5 | | As Proportion to Agricultural Value Added | 4.1 | 5.6 | 7.2 | 9.2 | 9.5 | | As Proportion to Agricultural and Allied Exports | 56.0 | 97.2 | 70.8 | 91.4 | 101.0 | | Source: Authors’ calculations based on National Accounts Statistics, World Integrated Trade Solution and Annual Survey of Industries data. | There is no common data set available for comparing FPI units in organised and unorganised sectors. However, a comparison can be made using ASI data, which provide information on the organised sector and National Sample Survey Organisation’s Unincorporated Non-Agricultural Enterprises Survey data provide information on the unorganised sector. A comparison of these two data sets for 2016-17 and 2015-16, respectively, showed abysmally low percentage of FPI enterprises in organised sector, even though the organised sector accounts for more than 80 per cent of gross value added in overall FPI. As per ASI data, there were 39,748 food processing enterprises in the organised sector in 2016-17 while the number of unincorporated enterprises as per NSSO data stood at 24,59,929 in 2015-16. Nearly half of organised enterprises were in three states - Andhra Pradesh, Tamil Nadu and Telangana - while Uttar Pradesh and West Bengal had the highest number of unincorporated food processing units. In terms of employment also, the unorganised sector dominates. As per ASI 2017-18, total number of persons engaged in registered food processing entities was 17.7 lakhs accounting for 11.4 per cent of total employment generated in the registered manufacturing sector. The unorganised food processing sector, in turn, provided employment to 51.1 lakh workers in 2015-16 (as per the NSSO 73rd Round) constituting 14.2 per cent of employment in the unregistered manufacturing sector. In terms of value generated in the organised sector, three states, Maharashtra (17.3 per cent), Uttar Pradesh (11.6 per cent) and Karnataka (11.3 per cent) together contributed around 40 per cent (Chart 3). 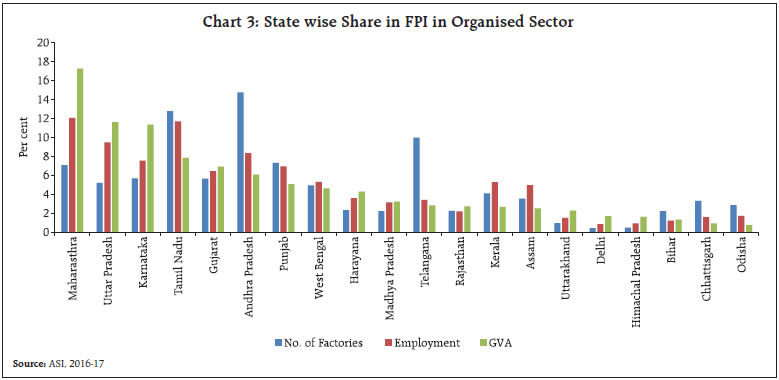 Annual growth in processed food GVA has been more volatile than agricultural GVA (Chart 4a). Inflation measured in terms of the year-on-year changes in Wholesale Price Index shows co-movement in processed food inflation and primary food inflation, though, in the recent period, former has remained higher than later (Chart 4b). The coefficient of variation of processed food inflation was higher than that of primary food inflation during the period April 2005 to January 2020. 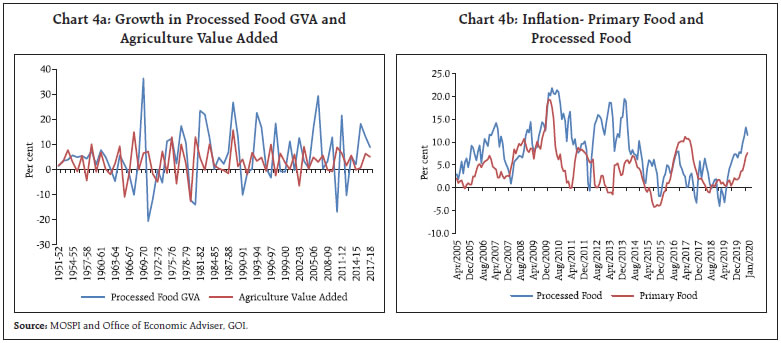
Table 5: Status of Food Processing Industry in India
(Average of 2000-01 to 2016-17) | | (Per cent) | | Item | Value added to output | Share in output | Share in employment | Share in exports | | Manufacture of macaroni, noodles, couscous and similar farinaceous products | 35.9 | 0.2 | 0.3 | 0.1 | | Manufacture of prepared meals and dishes | 30.1 | 0.4 | 0.6 | - | | Manufacture of cocoa, chocolate and sugar confectionery | 25.5 | 1.5 | 1.8 | 0.6 | | Processing and preserving of fruits and vegetables | 20.9 | 1.5 | 3.3 | 3.7 | | Manufacture of bakery products | 18.9 | 2.8 | 4.6 | 1.0 | | Manufacture of other food products n.e.c.* | 16.6 | 9.8 | 28.4 | 5.1 | | Manufacture of sugar | 16.1 | 14.1 | 18.1 | 6.4 | | Manufacture of starches and starch products | 16.0 | 1 | 1.4 | 0.6 | | Processing and Preserving of meat | 12.7 | 1.7 | 1.2 | 13.1 | | Manufacture of dairy products | 9.9 | 13.1 | 7.4 | 1.6 | | Manufacture of prepared animal feeds | 9.8 | 3.9 | 2.3 | 0.5 | | Processing and preserving of fish | 9.1 | 2.8 | 2.8 | 22.8 | | Manufacture of grain mill products | 7.4 | 22.8 | 21.0 | 26.2 | | Manufacture of vegetable and animal oils & fats | 5.7 | 24.6 | 6.7 | 17.2 | | Total | 10.7 | 100 | 100 | 100.0 | - : Not available.
* : Not elsewhere classified.
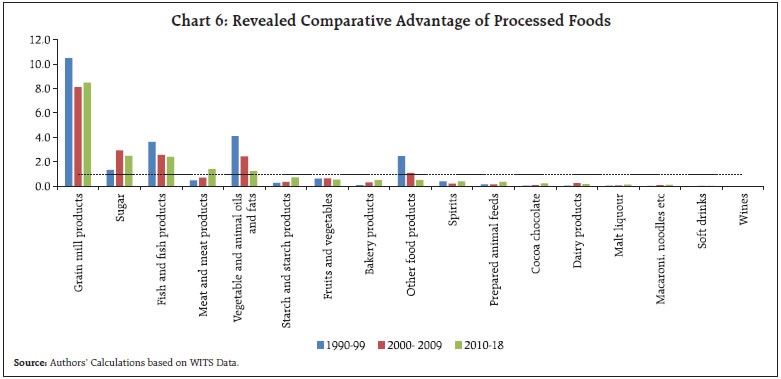
Source: Authors calculations based on Annual Survey of Industries data and WITS. | The value-added content in the FPI sector when compared with output is low (in 2016-17 at 10.2 per cent). The share of high value-added items like ready to eat items in total output of the sector is very low (Table 5). Grain mill products have emerged as the major export item in India’s processed food products in recent years. Among the various food products exported, processed fish and meat products had the highest per unit value. The analysis so far shows that the FPI has huge untapped potential as except for milk, meat and fish, the extent of processing in the other agri-food commodities remains low at less than 10 per cent. The overall share of processed food in total produce was 10 per cent in 2017-18. The Government has set the target for raising the share of processed food to 25 per cent of the total agricultural produce by 2025. FDI in Food Processing The food processing sector was opened to 100 per cent foreign direct investment in 2016 under the automatic route. Further, in 2017, 100 per cent FDI under the Government route for retail trading, including through e-commerce, is permitted in respect of food products manufactured and/or produced in India. While the flow of FDI to this sector has increased over the years, its share was still low at less than 2 per cent in 2018-19 (Table 6). Over the years, India has been able to attract investment from food and beverages companies like Nestle, Cargill, McCain, Mondelez, Pepsi, Coco cola etc., and also from retail trade companies like Amazon, Walmart, etc. (Government of India, 2017). In 2018, Mondolez International invested US$15 million in India for research after investing US $190 million in a green field project in Andhra Pradesh. Similarly, Cargill, agro-food company based in USA invested in various supply chain nodes like cold storage facility in Karnataka and aqua feed project in Andhra Pradesh. Further, Amazon and Walmart’s entry into Indian food retail sector is expected to bring in more investment in this sector. | Table 6: FDI Inflows in Indian Food Processing Industry | | (US $ million) | | Year | FDI to India | FDI in food processing | Share of FPI in FDI inflows (%) | | 2010-11 | 29,029 | 189 | 0.6 | | 2011-12 | 32,952 | 170 | 0.5 | | 2012-13 | 26,953 | 401 | 1.5 | | 2013-14 | 30,763 | 3,983 | 12.9 | | 2014-15 | 35,283 | 516 | 1.5 | | 2015-16 | 44,907 | 506 | 1.1 | | 2016-17 | 42,215 | 727 | 1.7 | | 2017-18 | 39,431 | 905 | 2.3 | | 2018-19 | 43,302 | 628 | 1.5 | | Source: Annual Report, Ministry of Food Processing Industries and Database on the Indian Economy. | External Trade The food processing Industry in India is largely domestic oriented, with exports accounting for only 12 per cent of its total output. Nevertheless, it is a net foreign exchange earner with a positive trade balance in recent years (Chart 5). Globally, India ranks first in the export of processed and preserved fish and fish products, grain mill products and fourth in the export of sugar. However, even in these products, only about one fourth of the product is exported reflecting high proportion of consumption in the domestic economy. In terms of destination of exports, traditionally the US and the EU were the major markets for India. However, of late Vietnam has overtaken the US and the EU as the major importer of manufactured food products from India mainly due to its increasing import of meat and fish products from India. Nevertheless, the US and EU continue to be prominent destinations for export of fish products and processed fruits and vegetables. To identify the major sectors in which India has comparative advantage in the food processing sector, a revealed comparative advantage (RCA) analysis in line with Balassa (1965) index is calculated.  Where Xij and Xit are the value of country i’s export of product j and its total exports while Xwj and Xwt refer to the world’s export of product j and total world exports, respectively. A value higher than unity implies that country i has revealed comparative advantage in that product and vice versa. Out of the total 17 sub-groups of processed food, India has revealed comparative advantage in 5 products, with grain mill products having the highest score (Chart 6). India ranked first in the export of grain mill products in 2018 and accounted for 18 per cent of total world exports. In case of vegetable and animal oils and fats, the RCA has come down over the years, though the decadal average still stood at 1.2. Further, strong domestic demand has made India a net importer of vegetable oils for which the RCA has come down to less than unity since 2015. On the other hand, India’s competitiveness has improved over the years in case of meat and meat products. 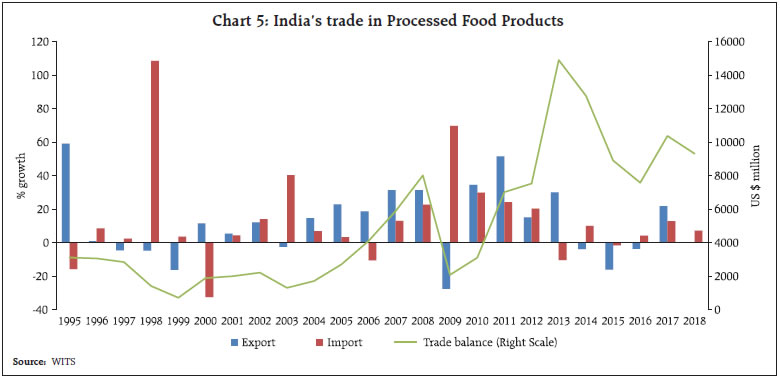
 Apart from price competitiveness, quality standards also affect the exportability of a product. With consumers becoming quality conscious, demand for these products are on the rise across the world but restrictive trade practices have also increased. Countries are increasingly using sanitary and phytosanitary (SPS) measures since the mid-1990s, with consumers demanding high food safety and health standards (World Trade Organisation, 2012). Increasingly, the quality standards under Sanitary and Phytosanitary Measures of the World Trade Organisation are used by developed countries in restricting imports from developing countries (Arathi, Kumar, Negi & Singh, 2012; Kumar, 2016; and Goyal, Mukherjee & Kapoor, 2017). While there are globally accepted quality standards such as the Codex Alimentarius standards, individual countries, as per WTO norms, have the right to set and implement food safety and health standards, provided they are based on scientific justification and are implemented to protect human, animal or plant life. Many developed countries have relatively stringent health standards than the internationally accepted ones with a view to protect their nations against possible health hazards from imports from developing countries (Goyal, Mukherjee and Kapoor, 2017). Corporate Data Analysis To understand the strength and weakness of the food processing sector relative to other sub sectors within the non-financial corporate sector, their financial accounts data are analysed. The relevance of such an analysis is supported by the fact that more than 80 per cent of output and value added in the FPI sector is generated from the organised sector. Further, in terms of ownership structure, firms are divided as public limited and private limited firms. Key aggregated performance indicators for food processing firms are compared with those of all non-government and non-financial firms (Annex I, Table A1). It can be observed that annual growth numbers for key parameters, viz., sales, profit before tax (PBT), gross value added and gross fixed assets, of FPI have been volatile. Private limited firms have displayed higher growth volatility as compared with public limited firms. This indicates that smaller firms face higher uncertainty. Nominal sales growth of public limited firms declined significantly after 2013-14 while that of private limited firms remained stable. Unlike sales growth, profit and GVA growth of FPI firms, however, remained buoyant, indicating that probably these firms would have benefitted from softening of global commodity prices after 2013-14. The average leverage of FPI firms, measured as debt to equity ratio, has increased significantly after 2012-13, specifically for private limited firms, possibly a sign of financial distress in medium and small enterprises. The ratio of exports to sales and the ratio of GVA to gross fixed assets of FPI firms are found to be generally lower than those for the overall non-financial corporate sector (Annex I, Table A2). This is a sign of weaker participation of the Indian FPI sector in the global value chains and their lower ability to make higher value addition to overall sectoral output. This is also not surprising as majority of FPI firms are involved in primary or secondary processing activity and largely cater to domestic demand. It may be added that the ratio of sales to assets, i.e., the asset turnover ratio [a measure of efficient exploitation of physical investment by firms] of FPI firms is significantly higher than that for the overall industry, which, nevertheless is more an indication of lower value addition in the sector than greater efficiency. Credit Ensuring availability of adequate credit to the food processing industries is given utmost importance by the Reserve Bank of India. Accordingly, the Reserve Bank has accorded priority sector status to food processing industry. Loans to food and agro-based processing units and cold chain have been classified under agricultural activities for priority sector lending. Loans for food and agro-processing up to an aggregate sanctioned limit of ₹100 crore per borrower from the banking system is considered as priority sector. Apart from this, credit for developing agricultural infrastructure is also categorised under priority sector lending. Accordingly, loans provided for construction of storage facilities (warehouse, market yards, godowns and silos), including cold storage units / cold storage chains designed to store agricultural produce/ products comes under the priority sector lending, as also loans to MSMEs involved in food processing. 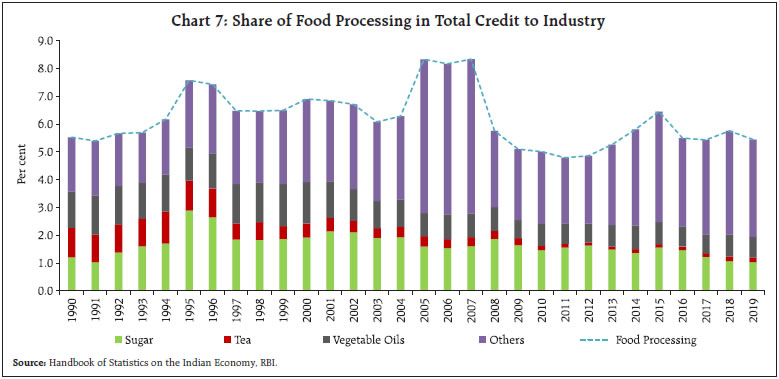 The share of the food processing sector in total credit to industry has moved in a narrow range, at less than 10 per cent since 1990 which is consistent with the share of FPI in manufacturing GVA (Chart 7). To examine the importance of credit in promoting investment and output in the food processing sector, we attempt a panel data analysis using ASI industry level data. ASI is the principal source of industrial statistics in India which provides industry wise annual data on major characteristics at various levels based on National Industrial Classification (NIC). In the present study, ASI data till level (4 digit) have been considered, which provide sufficient information regarding the major sub sectors of the food processing industries. The data are annual and correspond to the period 1993-94 to 2015-16. ASI provides industry level data on output, fixed investment, profit and credit outstanding. This provides an opportunity to assess, the impact of credit on gross output and capital expenditure controlling for urbanisation. Capital expenditure is taken as the one period difference in fixed investment. Panel unit root test reveals the variables to be I (1) (Table 7). Panel co-integration using Westerlund (2007) test is run for the following two equations separately to examine the effect of credit on output and capital expenditure:
| Table 7: Result of Im-Pesaran-Shin Panel Unit-root Test | | Variable | Number of panels | Level | First difference | | Gross output | 11 | 3.33 | -8.35*** | | Loan outstanding | 11 | 1.04 | -9.89*** | | Capital expenditure | 11 | 3.75 | -8.41*** | | *** : p<0.01. |
| Table 8: Variance Ratio of Panel Co-integration using Westerlund Test with All Panels Co-integrated (for 11 Industries) | | H0: No co-integration | | H1: All panels are co-integrated | | Gross output | Capital expenditure | | -2.41*** | -2.94*** | | *** : p<0.01. | The null hypothesis is that there exists no cointegration between the variables. The results validated the presence of long run relation between the variables (Table 8). To address endogeneity among the variables, Arellano and Bond (1991) Generalised Method of Moments is used for estimating long run relationship. The results showed credit has positive relationship with gross output, and capex growth, (Table 9). A one unit increase in credit will result in 17 per cent improvement in gross output and 22 per cent improvement in capital expenditure. This shows that a policy towards channelising credit can be beneficial for overall improvement of food processing sector. | Table 9: Estimation of Long-run Relationship | | Variables | Log of gross output | Log of capital expenditure | | Log of gross output[-1] | 0.825** | | | | (0.058) | | | Log of capital expenditure[-1] | | 0.723* | | | | (0.096) | | Log of loan outstanding | 0.173** | 0.224* | | | (0.050) | (0.095) | | Constant | 0.518 | 0.398 | | | (0.207) | (0.297) | | Observations | 223 | 226 | | Number of sectors | 11 | 11 | | Wald chi2 (2) | 10704*** | 862.6*** | | Sargan test of over-identifying restrictions chi2(172) | 197.75* | 246.16*** | Cluster robust standard errors in parentheses.
*** : p<0.01; ** : p<0.05; and * : p<0.1. | IV. Government Initiatives Recognising the role that FPI can play in promoting employment and income in the rural sector, the Government of India has identified it as a priority sector under the ‘Make in India’ Programme. FPI offers an opportunity to reduce dependence on agriculture in the rural areas as the main employment generating sector. Various initiatives have been taken by the Government to promote this sector considering the challenges faced by the sector. The Ministry of Food Processing Industries has identified six key challenges faced by the food processing industry: (i) gaps in supply chain infrastructure (i.e., lack of primary processing, storage and distribution facilities); (ii) inadequate link between production and processing; (iii) seasonality of operations and low capacity utilisations; (iv) institutional gaps in supply chain, viz., dependence on APMC markets, etc.; (v) inadequate focus on quality and safety standards; and (vi) lack of product development and innovation (Government of India, 2018). Accordingly, the focus has been to smoothen the supply chain by creating infrastructure, promoting exports, improving quality standards, expanding supply of formal credit, particularly to small and medium enterprises, and broadening skilled labour pool in the economy. Specifics of key policies are outlined in Annex II. V. Summing up Though India is a major producer and exporter of agricultural produce at raw material stage, only less than 10 per cent of them are processed and traded. One major reason for this is the large consumer base domestically and having preference for fresh produce over processed food. Slow pace of urbanisation and low labour force participation of women have resulted in the preference for fresh foods at the All-India level. Empirical literature suggests that as more women enter the workforce, consumption of processed food increases (Wang, et al., 2015). India has the potential to emerge as a major exporter of processed food by adhering to the quality standards. The Government initiatives for strengthening quality standards can provide impetus to the sector. An analysis of corporate data showed that profitability of food processing firms has been either higher or comparable with the levels of other firms. However, the value-added component in food processing firms was found to be lower than other firms operating in the industrial sector. The econometric analysis on credit reveals the importance of credit for growth in this sector. Relative to the share of the food processing sector in industrial GVA, sectoral credit data suggest adequate availability of credit for the sector. With the bourgeoning urban and young population, demand for processed food items is set to increase in the coming years. The food processing industry in India needs to gear up to meet the demand by investing in necessary infrastructure. The industry requires a steady flow of raw materials from the producers/farmers meeting specific quality standards and at stable prices. Farmer producer organisations, by bringing together small farmers and agricultural entrepreneurs, can enhance the opportunity to build more stable supply chain. Besides ensuring steady flow of income to the farmers, greater linkages with industry could also reduce wastages, particularly in perishables. References Arathi, L. R., Kumar, S., Negi, D. S., & Singh, D. R. (2012). Prevailing Standards and Dimensions Governing Sanitary and Phyto-Sanitary Compliance in Indian Black Pepper Supply Chain. Agricultural Economics Research Review, 25, 69-78. Arellano, M. & Bond, S. (1991). Some Tests of Specification for Panel Data : Monte Carlo Evidence and an Application to Employment Equations. The Review of Economic Studies, 58(2), 277-297. Balassa, B. (1965). Trade liberalisation and Revealed Comparative Advantage. The Manchester School, 33, 99-123. Ghosh, N. (2014). An assessment of the extent of food processing in various sub-sectors. Revised report submitted to Ministry of Agriculture, Institute of Economic Growth, New Delhi. Government of India. (2016). Government targets doubling food processing levels to 20 per cent World Food Summit to be held in New Delhi in March 2017, Ministry of Food Processing Industries. Press Information Bureau. Government of India. (2017). Make in India. Retrieved from http://www.makeinindia.com/sector/food-processing. Government of India. (2017). Annual Report-2016-17. New Delhi: Ministry of Food Processing Industries. Government of India. (2018). Annual Report-2017-18. New Delhi: Ministry of Food Processing Industries. Government of India. (2019). Annual Report-2018-19. New Delhi: Ministry of Food Processing Industries. Goyal, T. M., Mukherjee, A., & Kapoor, A. (2017). India’s Exports of Food Products: Food Safety Related Issues and Way Forward. New Delhi: Indian Council for Research on International Economic Relation. KPMG (2007). Processed Food and Agribusiness: Opportunities for Investment in India. Report prepared for MOFPI, New Delhi. Kumar, C. N. (2016). Sensitivity of India’s Agri-Food Exports to the European Union: An Institutional Perspective. Working Paper, Institute for Social and Economic Change, Bangalore. Law, C., Green, R., Kadiyala, S., Shankar, B., Knai, C., Brown, K. A. & Cornelsen, L. (2019). Purchase Trends of Processed Foods and Beverages in Urban India. Global food Security, 23, 191-204. Liu, E., Taylor, D., & Zhang, S. (2007). Peoples Republic of China Food Processing Ingredients Sector. GAIN Report. Foreign Agriculture Service, United States Department of Agriculture. Regmi, A. (2001). Changing Structure of Global Food Consumption and Trade. US Department of Agriculture. Regmi, A., & Gehlhar, M. (2005). New Directions in Global Food Markets. Agriculture Information Bulletin (February), USDA, p. 82. Wang, C. M., Naidoo, N., Ferzacca, S., Reddy, G., Van, D. R., & Wang et al.. (2015). The Role of Women in Food Provision and Food Choice Decision-Making in Singapore: A Case Study. Ecol Food Nutr. Westerlund, J. (2007). Testing for Error Correction in Panel Data. Oxford Bulletin of Economics and Statistics. 69(6): 709-748. Wilkinson, J., & Rocha, R. (2008). Agri Processing in Developing Countries. World Bank. World Trade Organisation. (2012). World Trade Report 2012-Trade and Public Policies: A closer look at non-tariff measures in the 21st Century. WTO.
Annex I | Table A1: Growth rate of select items of food processing companies | | (Per cent) | | Financial year | Food processing firms | Overall non-financial firms | | Number of Firms | Sales | Profit before tax | Gross value added | Gross fixed assets | Number of Firms | Sales | Profit before tax | Gross value added | Gross fixed assets | | Public Limited firms | | 2010-11 | 173 | 26.5 | -7.5 | 6.3 | 10.7 | 3,041 | 21.2 | 11.3 | 15.4 | 15.5 | | 2011-12 | 162 | 25.4 | 9.0 | 6.8 | 11.4 | 3,041 | 19.0 | -4.7 | 6.4 | 11.1 | | 2012-13 | 291 | 13.6 | 9.1 | 13.3 | 8.9 | 3,014 | 10.5 | 3.8 | 10.6 | 12.6 | | 2013-14 | 676 | 13.7 | 5.2 | 11.9 | 10.5 | 4,388 | 10.6 | 4.7 | 10.4 | 15.1 | | 2014-15 | 821 | 7.3 | 27.6 | 13.0 | -0.7 | 16,923 | 4.8 | 15.9 | 12.8 | 5.8 | | 2015-16 | 1,108 | 3.0 | 75.0 | -2.2 | 5.2 | 19,602 | 0.7 | 9.5 | 8.7 | 7.5 | | 2016-17 | 779 | 6.9 | 18.4 | 25.8 | 2.5 | 24,612 | 5.4 | 10.3 | 9.4 | 8.1 | | 2017-18 | 779 | 9.9 | 42.5 | 52.1 | 8.4 | 16,130 | 10.1 | 7.7 | 7.1 | 5.5 | | Private Limited firms | | 2010-11 | 95 | 20.5 | 31.2 | 33.9 | 18.2 | 1,741 | 17.9 | -14.8 | 13.3 | 10.4 | | 2011-12 | 63 | 23.5 | 70.2 | 27.1 | 13.9 | 1,628 | 24.1 | -0.3 | 19.4 | 14.7 | | 2012-13 | 5,610 | 23.5 | 30.0 | 24.7 | 23.9 | 2,55,426 | 13.3 | 14.6 | 16.3 | 21 | | 2013-14 | 5,436 | 8.3 | -8.8 | 9.8 | 10.4 | 2,37,398 | 8.7 | 19.9 | 20.1 | 12 | | 2014-15 | 6,931 | 10.2 | 9.3 | 14.6 | -1.1 | 2,92,308 | 13.2 | 18.0 | 18.1 | 4.3 | | 2015-16 | 9,988 | 10.6 | 57.0 | 22.3 | 25.6 | 4,06,739 | 5.9 | 16 | 15.1 | 17.2 | | 2016-17 | 5,946 | 45.3 | 140.8 | 58.9 | 22.4 | 2,45,333 | 9.1 | 17.3 | 15.3 | 6.2 | | 2017-18 | 5,946 | -15.9 | -51.1 | -17.3 | -6.8 | 2,45,333 | 10.6 | 18.7 | 14.7 | 10.7 | | Source: Database on the Indian Economy, RBI. |
| Table A2: Key financial ratios of food processing firms | | (per cent) | | Financial year | Food processing firms | Overall non financial firms | | Debt to equity | Sales to gross fixed assets | Exports to sales | Gross value added to gross fixed assets | Debt to equity | Sales to gross fixed assets | Exports to sales | Gross value added to gross fixed assets | | Public Limited Firms | | 2010-11 | 56.8 | 210.8 | 10.8 | 30.7 | 42.0 | 148.7 | 18.6 | 35.6 | | 2011-12 | 34.3 | 311.1 | 12.9 | 30.4 | 39.1 | 204.6 | 11.2 | 50.5 | | 2012-13 | 39.1 | 256.3 | 10.5 | 32.7 | 42.9 | 152.0 | 20.6 | 32.1 | | 2013-14 | 42.3 | 248.1 | 9.7 | 27.7 | 43.7 | 139.0 | 18.4 | 30.5 | | 2014-15 | 56.2 | – | 4.0 | 33.5 | 46.9 | 115.1 | 14.2 | 26.4 | | 2015-16 | 47.2 | – | 3.2 | 35.0 | 52.6 | 112.1 | 15.2 | 23.9 | | 2016-17 | 40.7 | – | 2.9 | 29.7 | 45.9 | 106.2 | 10.7 | 23.7 | | 2017-18 | 37.4 | – | 1.8 | 42.9 | 43.2 | 109.5 | 8.9 | 23.8 | | Private Limited firms | | 2010-11 | 26.8 | 466.4 | 9.1 | 42.2 | 33.1 | 213.7 | 10.0 | 50.3 | | 2011-12 | 15.5 | 413.1 | 4.3 | 42.0 | 39.1 | 204.6 | 11.2 | 50.5 | | 2012-13 | 12.2 | 431.0 | 11.6 | 43.9 | 40.6 | 208.1 | 10.6 | 50.8 | | 2013-14 | 39.9 | 349.5 | 5.3 | 28.2 | 47.2 | 242.0 | 5.6 | 36.8 | | 2014-15 | 41.8 | 340.0 | 3.7 | 30.2 | 49.5 | 234.2 | 6.3 | 37.2 | | 2015-16 | 57.2 | – | 3.6 | 34.0 | 59.4 | 282.1 | 2.9 | 44.8 | | 2016-17 | 65.7 | – | 2.6 | 39.7 | 56.0 | 292.6 | 2.3 | 45.2 | | 2017-18 | 56.3 | – | 3.9 | 30.9 | 56.6 | 298.4 | 2.1 | 47.8 | – : Not available.
Source: Database on the Indian Economy, RBI. |
Annex II Government Initiatives for Development of FPI in India Infrastructure: To address small size of enterprises involved in food processing, the Government promotes a cluster approach which brings together farmers and entrepreneurs through well-equipped supply chains and aims at development of modern infrastructure and common facilities to set up food processing units. Under the scheme, each agro-processing cluster will have two basic components, i.e., Basic Enabling Infrastructure (roads, water supply, power supply, drainage, effluent treatment plan, etc.), and Core Infrastructure/ Common facilities (warehouses, cold storages, individual quick freezing, tetra pack, sorting, grading, etc.) and at least 5 food processing units with a minimum investment of ₹25 crore (Government of India, 2017). Implementation of Mega Food Parks (MFP) scheme in 2008, Modern Terminal Markets (MTM) and bulk storage facilities as well as modernisation of markets, quality control laboratories are some of the efforts in this regard. Further, financial support and fiscal incentives are given for creation of common supply chain infrastructure, like cold chain, dry storage, packaging, logistics, back and front-end infrastructure, expansion of processing capacities, etc. to reduce cost of investment, enhance viability and ensure higher conformity to regulatory standards. Under project imports, all goods relating to food processing are charged a uniform customs duty of 5 per cent irrespective of their tariff classification. Standardisation of Food Safety Norms: Due to legacy issues and infrastructural challenges, the Indian states have different levels of implementation of food quality standards and procedures. Over time, awareness about food quality and safety standards have increased due to the growing middle-class population, globalisation and health awareness, etc. For uniform implementation of food quality standards, Food Safety and Standards Authority of India (FSSAI) launched “One Nation, One Food Law” initiative. Availability of credit: To boost credit disbursement at affordable rates to the food processing sector, a special fund of ₹ 2000 crore has been set up in National Bank for Agriculture and Rural Development (NABARD). Under this, loans are extended up to 95 per cent of the project cost for setting up, modernisation and expansion of food processing units and development of infrastructure in designated food parks. Human Resource and Skill Development: The Government has taken up the initiative to develop sector specific skills of the workers with support from the National Institute of Food Technology, Entrepreneurship and Management (NIFTEM) and the Indian Institute of Food Processing Technology (IIFPT). In 2017, merging seven major schemes under one umbrella scheme, i.e., the Pradhan Mantri Kisaan Sampada Yojana, has been implemented. This is expected to boost efficiency of infrastructure investment as well as of farmers.
|