This article analyses the trends of various indicators of the consumer confidence survey. The review reveals improvements in consumer confidence in last few rounds after a prolonged period of subdued sentiments, which is primarily due to sharp improvements in households' responses on general economic situation, employment scenario and price level. High co-movement in perceptions and expectations on general economic situation with employment scenario is observed compared to other indicators, viz., price level, households’ income and spending. Moreover, various occupation groups seem to have largely invariant opinions about general economic situation. Introduction Consumer sentiment is a closely watched indicator of households’ current sentiments and future expectations of economic conditions. Surveys assessing consumers’ opinions are quite popular across central banks. Prominent amongst them are the Conference Board and University of Michigan for US, and Joint Harmonized Programme for the EU. Consumer confidence indices are found to be key indicators of spending (Lemmon and Portniaguina, 2006; Dees and Brinca, 2013). Not surprisingly, therefore, consumer confidence is regarded as a leading indicator of the turning points of the state of an economy (OECD, 2019). The Reserve Bank of India has been conducting its consumer confidence surveys since June 2010, assessing households’ sentiments about the economy, in six cities, viz., Bengaluru, Chennai, Delhi, Hyderabad, Kolkata and Mumbai. From the September 2017 round, the survey has been expanded to 7 more cities viz., Ahmedabad, Bhopal, Guwahati, Jaipur, Lucknow, Patna and Thiruvananthapuram1. A brief description of the survey is provided in Annex A. This article delves into households’ perceptions and outlook on the general economic situation (GES) over the past three years, involving thirteen rounds of the survey. A significant area of interest is how various occupational categories of the respondents covered in the survey form their sentiments on the current and future GES. Coherence analysis suggests that the employment situation is the main driving factor for both perceptions and outlook. Furthermore, the article profiles the shift in consumer confidence that commenced in mid-2018 and has reached a high point in March 2019, the latest survey round conducted to inform the first bi-monthly monetary policy meeting of the monetary policy committee (MPC) of 2019-20. The rest of the article is structured into four sections. Section 2 briefly discusses the consumer confidence indices for major advanced and emerging economies. The key results of the survey rounds are presented in Section 3. The analysis of occupation groups and their perception/expectation about GES is carried out in Section 4. Section 5 concludes with some policy perspectives. 2. The Cross-Country Experience A consumer confidence index reflects future developments of households’ consumption patterns based upon responses regarding their expected financial situation, their sentiment about the general economic situation, unemployment and capability of savings. Accordingly, index values above 100 signal a boost in consumers’ confidence about the future economic situation. As a consequence, they are less prone to save, and more inclined to spend money in the next 12 months. Values below 100 indicate a pessimistic attitude towards future developments in the economy, possibly resulting in a tendency to save more and consume less (OECD, 2019). An overview of the parameters used for compilation of consumer confidence shows that consumer confidence indices in most countries combine respondents’ perceptions and expectations on the household’s financial situation, their outlook on the general economic situation and whether the respondents feel that now is a good time for buying major household goods like furniture, consumer durables and the like (Table 1). | Table 1: Consumer Confidence Indices in Different Major Economies | | | Parameter | Advanced Economies | Emerging Economies | | USA1 | EU#2 | Brazil@3 | Indonesia*4 | India5 | South Africa$6 | Current Assessment
(Present compared to 1 year ago) | General Economic Situation | | | | | ✓ | | | Employment Scenario | | | | ✓ | ✓ | | | Price Levels | | | | | ✓ | | | Household Income | | | | ✓ | ✓ | | | Household Spending | | ✓ | | | ✓ | | | Household Financial Situation | ✓ | ✓ | | | | | | Timing for purchase of durable goods | ✓ | | ✓ | ✓ | | ✓ | Future Expectations
(1 year ahead compared to present) | General Economic Situation | ✓ | ✓ | | ✓ | ✓ | ✓ | | Employment Scenario | | | ✓ | ✓ | ✓ | | | Price Levels | | | ✓ | | ✓ | | | Household Income | | | ✓ | ✓ | ✓ | | | Household Spending | | | | | ✓ | | | Household Financial Situation | ✓ | ✓ | | | | ✓ | | GES over next 5 years | ✓ | | | | | | 1. USA – Survey of Consumers, University of Michigan
2. EU – Joint Harmonized EU Programme of Business and Consumer Surveys
3. Brazil – Fecomercio SP’s Consumer Expectation Index used by Banco Central Do Brasil
4. Indonesia – Consumer Survey, Bank Indonesia (2016)
5. India – Consumer Confidence Survey, RBI
6. South Africa – Bureau of Economic Research (BER), 2018
#: The consumer confidence indicator for the European Commission (2016) countries combines 2 questions each for perception compared to 1 year ago and expectation for next 1 year to form a single index.
@: The Consumer Confidence Index of the Banco Central Do Brasil is a weighted average of Consumer Expectation Index formed by Fecomercio SP (Federaçao do comercio do Estado de São Paulo) and a Business Confidence Index. Here, only the components of Consumer Expectation Index have been indicated.2
*: For the consumer survey of Bank Indonesia, indices are based on assessments for past 6 months and expectations for next 6 months.
$: Consumer Confidence Index of BER combines 3 questions to form a single index. | Moving on to some recent developments in consumer confidence across the globe, the University of Michigan’s consumer sentiment for the US has been on a gradual rise since the global financial crisis of 2008. Persistent political influence is seen in the survey results, as there is a significant difference between indices for Republican and Democrat supporters (Curtin, 2019). Reeling under the cloud of uncertainty over Brexit, consumer confidence for the United Kingdom has been falling since it peaked around the beginning of 20153. Consumer confidence for the Euro Area is also on a downward trajectory since peaking around the end of 2017, though it is still higher than the levels seen during 2011-13, when it had plummeted in the wake of the Euro area sovereign debt crisis in the summer of 20114. Overall, however, consumer confidence levels are higher than during the 2008 global financial crisis for all major advanced economies. In the last few months, consumers in all major developing countries are more optimistic about the economy than in the recent past5. The trade wars with the US over the past year seem to have done little to dampen sentiments of consumers in China where consumer confidence is nearing an all-time high, last seen in 1993. After mellowed sentiments for the most parts of the three-year period from 2015 to 2017, Brazilian consumers seem to be exhibiting positive sentiments in recent months, with six consecutive increases since mid-2018. Consumer confidence in Brazil had hit an all-time low in 2015, a year in which its GDP contracted by 3.8 per cent and there were widespread protests in the country denouncing corruption and the government of President Dilma Rousseff6. After a prolonged period of pessimism from 2015 to 20177, consumer confidence in South Africa recorded a sharp uptick in the beginning of 2018 and has maintained optimism throughout 2018. 3. Survey Results The Reserve Bank survey of consumer confidence covers five parameters, i.e., General Economic Situation, Employment Scenario, Price Levels, Households’ income and overall spending. Furthermore, it polls current perceptions as well as expectations on the future one year ahead. 3.1. General Economic Situation Respondents were optimistic about the current economic situation during the major part of 2016-17. Thereafter, however, net responses plunged into the pessimistic zone post December 2016. Although there was a small one-off improvement in the perception of GES in December 2017, sentiments remained in the negative zone till December 2018. Since December 2018, however, consumer sentiment has been on an upward trajectory and the index entered optimistic territory during the March 2019 round of the survey, which is the latest in the series going back to June 2010. The outlook on the general economic situation a year ahead remained positive throughout this three-year period, albeit at a lower level than pre-December 2016 period. Directionally, respondents’ outlook on the future economic situation closely matched their current assessment, except around demonetisation in December 2016. Following in the steps of current perceptions, expectations on GES have shown an upward trajectory since December 2018, reaching the second highest level (48.6) in the survey’s history in the March 2019 round (Chart 1; Annex B Table 1). 3.2. Employment Scenario Households’ pessimism about the current economic situation broadly mirrored their assessment for the current employment scenario, net responses on which turned negative in December 2016 and persisted in pessimistic territory till December 2018. Respondents’ perceptions seem to have turned after September 2018, however, with gradual improvements taking them into positive territory in the March 2019 round. The outlook on the future employment scenario had peaked in December 2016, but it dropped thereafter as households were worried about the employment scenario in the one year ahead horizon. Nevertheless, their expectations about the outlook on employment have remained in the optimistic domain, rising in December 2018 after staying subdued for more than two years. Incidentally, similar upturns in expectations about GES and the employment scenario were seen in the results of the survey rounds prior to the 2014 general elections (Chart 2; Annex B Table 2). 3.3. Price Situation The recent softening of inflation is reflected in respondents’ assessment of the price levels over the last one year. Net responses relating to current perceptions turned in the June 2018 round, and since then, they have been on an upward trajectory. Interestingly, sentiments on price levels had softened in the December 2016 round in the aftermath of demonetisation, but this proved to be transient as current perceptions on prices deteriorated dramatically after the implementation of the Goods and Services Tax (GST) in July 2017, before bottoming out in December 2017. By contrast, expectations about the future price situation did not wane at a similar pace and this may indicate that households factored in improvements in the future due to reforms like GST (Chart 3; Annex B Table 3). Regarding inflation, net responses are broadly in tandem for both the current and future expectations, with an overwhelming majority expecting higher inflation. Net responses over both the horizons indicate improvement since June 2018 (Annex B Table 4). 3.4. Household Income Respondents’ sentiments about their current income have remained subdued since December 2016 but a gradual rise is observed from June 2018 onwards. Household income has been the only parameter on which the majority has polled no change in the last one year. On the other hand, the respondents have consistently been optimistic about their future incomes (Chart 4; Annex B Table 5).
3.5. Spending Despite gloomy sentiments on income for a fairly long period, the majority of the respondents reported higher spending, ascribing the same to rise in prices of goods and services (Chart 5; Annex B Table 6). With the recent softening of price situation, the net response on households’ overall spending has been on a downward trajectory since September 2018, which along with the improvements in responses on price levels given above indicates that respondents view prices and inflation as the major drivers of their household spending. On a similar note, the majority of the households expect their spending to rise in the next one-year period, though the net response is almost 10 percentage points lower than that for the March 2017 to June 2018 period. 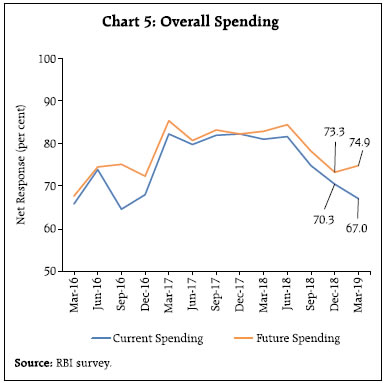 Respondents’ perceptions and expectations about spending on essential items followed a similar pattern with a marginal difference between the net responses (Annex B Table 7). In contrast, a persistent gap between current and future expectations on the spending on non-essential items is observed (Annex B Table 8). 3.6. Movement of Consumer Confidence Indices The Current Situation Index (CSI) summarizes the consumers’ current perception as compared to a year ago based on GES, the employment scenario, the price level, households’ income and spending. Broadly, the CSI started declining in September 2016 and entered the pessimistic zone in March 2017, where it persisted till December 2018 (Chart 6). On the contrary, respondents were optimistic about the future as reflected in the Future Expectations Index (FEI) during the same period. Post-demonetisation, both the CSI and FEI had remained below their earlier levels, but there has been a marked improvement since September 2018. In the March 2019 round, the CSI entered the optimistic zone after a span of two years while the FEI achieved its all-time high mark of 133.4. The results of the 99 per cent bootstrap confidence intervals for the CSI and FEI based on 10,000 draws selected through simple random sampling with replacement (SRSWR) indicate robustness of both the indices (Annex B Table 9). 3.7. Factors Associated with General Economic Situation Consumers’ responses on GES may encompass multiple underlying factors. In this context, it may be insightful to identify as to which survey parameter(s) influence the consumers’ sentiments on the GES the most, both for current assessment and future expectations. For this purpose, coherence coefficients8 for GES with other survey parameters are derived (Annex B Table 10). The assessment about the employment scenario seems to emerge as the most prominent factor determining current sentiments on GES followed by perceptions on the price situation and income. For the future GES, the coherence of expectations suggests that it is the outlook on employment scenario which is the main driver, followed by the outlook on households’ income (Annex B Table 11). 4. Does Occupation Influence Respondents’ Behaviour? Apart from the primary parameters enumerated earlier, the survey also captures demographic characteristics including the occupation of respondents. In order to examine if responses of different sections of respondents about the GES are independent, unit level survey data for the previous years have been utilised and statistical tests have been applied for the current and future responses of GES separately for different rounds of the survey. It is observed that households’ assessment and expectations about the GES is contingent on their occupation (Table 2). | Table 2: Pearson Chi-square Statistic: Test for Independence of Attributes | | Survey Round | Current General Economic Situation | Future General Economic Situation | | Mar-19 | 56.1 | 41.4 | | Dec-18 | 61.8 | 35.7 | | Sep-18 | 50.9 | 47.4 | | Jun-18 | 76.8 | 64.8 | | Mar-18 | 39.7 | 22.4 | | Dec-17 | 75.2 | 38.8 | | Sep-17 | 57.7 | 39.7 | | Jun-17 | 118.8 | 58.1 | | Note: All values are significant at 1 per cent level. | Ordered logistic regression9 is used to investigate the degree of optimism/ pessimism displayed by various occupation categories of respondents. The ordered logistic regression is useful when the response variable can be arranged in a specific sequence like exam grades, such as ‘poor’, ‘fair’, ‘good’, ‘excellent’. The purpose of this exercise is to study how well it can be predicted by other factors. The basic functional form of the regression equation is given below. Here, Yj denotes the probability of occurrence of the jth response, which are three in our case, i.e. optimism, remain same or pessimism. Xjs are occupation dummies viz., employed/salaried; housewife; retired persons/pensioners; self-employed/ business; and unemployed/students. The daily worker occupation category has been assumed to be the reference category10. βs are the coefficients of the occupation dummies. | Table 3: Ordered Logistic Regression Result: Significant Occupations | | Survey Round | Current General Economic Situation | Future General Economic Situation | | Optimistic | Pessimistic | Optimistic | Pessimistic | | Mar-19 | Employed/ Salaried
Self-employed/ Business
Unemployed/ Students | - | Employed/ Salaried
Unemployed/ Students | Retired/ Pensioners | | Dec-18 | Employed/ Salaried
Unemployed/ Students | Retired/ Pensioners | Unemployed/ Students | Retired/ Pensioners | | Sep-18 | Employed/ Salaried
Unemployed/ Students | - | Employed/ Salaried
Unemployed/ Students | Retired/ Pensioners | | Jun-18 | Self-employed/ Business
Unemployed/ Students | Retired/ Pensioners | Employed/ Salaried
Unemployed/ Students | Retired/ Pensioners | | Mar-18 | Unemployed/ Students | - | - | - | | Dec-17 | Unemployed/ Students | Housewife
Retired/ Pensioners
Self-employed/ Business | Unemployed/ Students | Retired/ Pensioners
Self-employed/ Business | | Sep-17 | Unemployed/ Students | Retired/ Pensioners
Self-employed/ Business | Unemployed/ Students | Retired/ Pensioners
Self-employed/ Business | | Jun-17 | Unemployed/ Students | Housewife
Retired/ Pensioners | Unemployed/ Students | - | Note: Occupations significant at 10 per cent level.
-: No occupation group was found to be statistically significant. | The results reveal that the assessment of retired persons/pensioners for the current GES has been significantly pessimistic for most rounds of the survey, followed by that of housewives and self-employed respondents (Table 3). On the contrary, unemployed respondents/students have consistently expressed statistically significant optimistic sentiments. Moving to the future GES, retired persons/ pensioners have persistently polled a gloomy outlook. Similar to sentiments on the current GES, unemployed/ students displayed optimism on the future GES. An upbeat outlook also emerges from employed/ salaried community in recent survey rounds. Broadly, the results reveal different behavioural patterns across population segments. On one side are students that persistently express expectations of bright prospects, whereas on the other side are retired and aged people that consistently assess and expect a grim situation11. 5. Conclusion Consumption demand has been the key driver of economic growth in India in the recent years. Survey based information on households’ perceptions and expectations about a range of key parameters that could impinge on their consumption decisions - income, employment and inflation - provide early indications about the current state of consumption demand, before hard data become available from the Central Statistics Office. Therefore, continuous assessment of households’ sentiment through regular surveys help provide useful inputs to policy making. As per the findings of the latest round of survey, the current situation index has moved into positive territory after a prolonged phase of pessimism. The elevated optimism in households’ expectations has resulted in the future expectations index reaching an all-time high. Importantly, the optimism largely reflects improvements in sentiments on general economic situation (GES), employment scenario and price level. Analytical results show that opinions on GES nevertheless vary across occupation categories for both the current and future periods. In general, the unemployed/students portray optimistic sentiments for both the current period and one year ahead. On the contrary, retired/pensioners represent the prominent group expressing pessimism on GES, both assessment and expectations. Overall, survey results over the past three years indicate that significant decline in inflation has enhanced the real purchasing power of income, boosting consumer confidence. Optimistic sentiment revealed through survey feedback on expectations also indicates that respondents believe the low inflation scenario to continue in the near term. Policy announcements targeting rural agrarian distress in the last 2-3 months and recent easing of monetary policy might have also contributed to these recent improvements. References Bank Indonesia (2016), Metadata, Consumer Expectation Survey, URL: https://www.bi.go.id/en/statistik/metadata/survei/Documents/1-Metadata-Consumer-Survey-2016.pdf (Accessed on 03 April 2019). Bureau of Economic Research (2018), “Changes to the BER consumer survey”, URL: https://www.ber.ac.za/Knowledge/pkDownloadDocument.aspx?docid=9331 (Accessed on 03 April 2019). Curtin, Richard (2019), “Persistent Political Influence on Expectations”, URL: https://data.sca.isr.umich.edu/fetchdoc.php?docid=62308 (Accessed on 04 April 2019) Dees, S. and Brinca, P.S. (2013), “Consumer confidence as a predictor of consumption spending: Evidence for the United States and the Euro area”, International Economics, 134, pp.1-14. European Commission (2016), “A User guide to the joint harmonised EU programme of business and consumer surveys”. Lemmon, M. and Portniaguina, E. (2006), “Consumer confidence and asset prices: Some empirical evidence”, The Review of Financial Studies, 19(4), pp.1499-1529. OECD (2019), Consumer confidence index (CCI) (indicator). doi: 10.1787/46434d78-en (Accessed on 03 April 2019).
Annex A 1. Sample Coverage and Survey Questionnaire The survey elicits households’ responses about five parameters viz., general economic situation, employment scenario, price level, household’s income and spending, with respect to the current situation as compared to a year ago and expectations one year ahead. Responses are solicited on a three-point scale (viz., improve/ will improve, worsened/ will worsen and remained/ will remain same). The survey is conducted in thirteen cities since September 2017, viz., Ahmedabad, Bengaluru, Bhopal, Chennai, Delhi, Guwahati, Hyderabad, Jaipur, Kolkata, Lucknow, Mumbai, Patna and Thiruvananthapuram. In each round of the survey, around 5,400 respondents are selected, using a hybrid two stage sampling design. At the first stage in a city, the polling booths are selected by systematic random sampling after arranging all polling booths according to their constituencies. In second stage, 15 respondents are selected from each selected polling booth area, following the right-hand rule. 2. Current Situation Index and Future Expectations Index In standard opinion surveys, respondents generally have three reply options such as up/same/down; or above-normal/normal/ below-normal; or increase/ remain-same/decrease. Because of the difficulty of interpreting all three percentages, the survey results are normally converted into a single quantitative number. One of the most common way of doing this is to use ‘Net-Responses’ (also called ‘Balances’ or ‘Net Balances’). It is defined as the percentage of the respondents reporting a decrease (negative), subtracted from the percentage reporting an increase (positive). Net Responses can take values from –100 to +100. In this survey, Net Response is used to analyse the Consumer Confidence Survey results. To combine the consumer confidence perceptions on various factors, two indices are worked out. These are Current Situation Index (CSI) for reflecting current situation as compared to one year ago and Future Expectations Index (FEI) to reflect the expectations one year ahead. For calculating the index, the following formula has been used. Overall Index = 100 + Average (Net Response of selected factors) Where Net Response = Positive perceptions (%) – Negative perception (%) The average net responses on the current perception on various factors, viz. economic conditions, employment, price level, income and spending are used for the calculation of the Current Situation Index. The average net responses on the future perceptions on various factors, viz. economic conditions, employment, price level, income and spending are used for the calculation of the Future Expectations Index. The range of CSI and the FEI lies between 0 to 200. An index value below 100 represents pessimism whereas a figure above 100 signals optimism.
Annex B: Data and Results | Table 1: Perceptions and Expectations on General Economic Situation | | (Percentage responses) | | Survey Round | Current Perception | One Year Ahead Expectation | | Improved | Remained Same | Worsened | Net Response | Will Improve | Will Remain Same | Will Worsen | Net Response | | Mar-16 | 39.9 | 30.3 | 29.8 | 10.1 | 54.6 | 27.2 | 18.2 | 36.4 | | Jun-16 | 40.2 | 27.9 | 31.9 | 8.2 | 54.2 | 25.5 | 20.4 | 33.8 | | Sep-16 | 44.6 | 30.1 | 25.3 | 19.4 | 57.7 | 24.3 | 18.0 | 39.6 | | Dec-16 | 45.7 | 24.1 | 30.3 | 15.4 | 66.3 | 16.6 | 17.1 | 49.2 | | Mar-17 | 35.6 | 24.4 | 40.0 | -4.5 | 52.1 | 21.4 | 26.5 | 25.6 | | Jun-17 | 32.4 | 27.7 | 39.9 | -7.5 | 48.6 | 25.9 | 25.5 | 23.1 | | Sep-17 | 35.8 | 23.8 | 40.4 | -4.6 | 52.6 | 21.5 | 25.9 | 26.6 | | Dec-17 | 38.5 | 24.0 | 37.5 | 1.0 | 55.6 | 21.8 | 22.6 | 33.0 | | Mar-18 | 34.9 | 23.4 | 41.7 | -6.8 | 49.7 | 22.8 | 27.5 | 22.2 | | Jun-18 | 36.4 | 21.9 | 41.8 | -5.4 | 50.4 | 23.0 | 26.6 | 23.8 | | Sep-18 | 33.7 | 22.1 | 44.3 | -10.6 | 53.2 | 16.7 | 30.2 | 23.0 | | Dec-18 | 36.7 | 20.2 | 43.1 | -6.4 | 59.9 | 15.8 | 24.3 | 35.6 | | Mar-19 | 46.2 | 21.3 | 32.5 | 13.7 | 66.4 | 15.8 | 17.8 | 48.6 |
| Table 2: Perceptions and Expectations on Employment Scenario | | (Percentage responses) | | Survey Round | Current Perception | One Year Ahead Expectation | | Improved | Remained Same | Worsened | Net Response | Will Improve | Will Remain Same | Will Worsen | Net Response | | Mar-16 | 34.3 | 31.1 | 34.6 | -0.3 | 50.4 | 31.4 | 18.1 | 32.3 | | Jun-16 | 35.6 | 28.7 | 35.7 | -0.2 | 51.1 | 29.6 | 19.3 | 31.8 | | Sep-16 | 31.7 | 36.4 | 31.9 | -0.2 | 50.5 | 30.5 | 19.0 | 31.5 | | Dec-16 | 31.0 | 29.8 | 39.2 | -8.3 | 57.3 | 24.1 | 18.6 | 38.7 | | Mar-17 | 32.6 | 28.4 | 39.0 | -6.4 | 52.8 | 24.5 | 22.7 | 30.1 | | Jun-17 | 30.8 | 30.3 | 38.9 | -8.1 | 49.6 | 29.3 | 21.2 | 28.4 | | Sep-17 | 31.1 | 25.9 | 43.0 | -12.0 | 51.9 | 22.8 | 25.3 | 26.6 | | Dec-17 | 31.6 | 27.4 | 41.0 | -9.4 | 54.4 | 24.7 | 20.9 | 33.6 | | Mar-18 | 31.2 | 26.0 | 42.8 | -11.6 | 50.8 | 24.3 | 24.9 | 26.0 | | Jun-18 | 34.7 | 26.4 | 38.9 | -4.1 | 50.9 | 25.8 | 23.4 | 27.5 | | Sep-18 | 35.2 | 19.3 | 45.5 | -10.3 | 54.1 | 17.0 | 29.0 | 25.1 | | Dec-18 | 35.6 | 20.1 | 44.3 | -8.7 | 60.3 | 17.1 | 22.7 | 37.6 | | Mar-19 | 41.1 | 21.7 | 37.2 | 3.9 | 65.3 | 15.9 | 18.9 | 46.4 |
| Table 3: Perceptions and Expectations on Price Level | | (Percentage responses) | | Survey Round | Current Perception | One Year Ahead Expectation | | Increased | Remained Same | Decreased | Net Response | Will Increase | Will Remain Same | Will Decrease | Net Response | | Mar-16 | 77.3 | 12.4 | 10.4 | -66.9 | 78.6 | 11.7 | 9.7 | -68.8 | | Jun-16 | 78.1 | 12.5 | 9.4 | -68.7 | 80.5 | 11.5 | 8.0 | -72.6 | | Sep-16 | 78.2 | 17.2 | 4.6 | -73.6 | 77.8 | 15.3 | 6.9 | -70.9 | | Dec-16 | 73.9 | 18.3 | 7.7 | -66.2 | 69.5 | 16.0 | 14.5 | -55.0 | | Mar-17 | 85.8 | 9.1 | 5.1 | -80.7 | 81.0 | 10.4 | 8.6 | -72.4 | | Jun-17 | 85.2 | 11.4 | 3.4 | -81.8 | 76.1 | 13.8 | 10.1 | -66.0 | | Sep-17 | 87.9 | 8.6 | 3.5 | -84.4 | 80.2 | 12.4 | 7.4 | -72.9 | | Dec-17 | 90.2 | 6.9 | 2.9 | -87.3 | 79.8 | 12.4 | 7.8 | -72.0 | | Mar-18 | 87.1 | 9.2 | 3.7 | -83.5 | 81.9 | 11.0 | 7.1 | -74.8 | | Jun-18 | 89.1 | 7.9 | 3.0 | -86.0 | 82.8 | 11.8 | 5.4 | -77.4 | | Sep-18 | 88.3 | 8.5 | 3.2 | -85.1 | 80.1 | 12.0 | 7.9 | -72.2 | | Dec-18 | 84.3 | 10.9 | 4.8 | -79.5 | 71.6 | 15.9 | 12.5 | -59.1 | | Mar-19 | 77.8 | 16.4 | 5.8 | -72.0 | 68.7 | 20.5 | 10.9 | -57.8 |
| Table 4: Perceptions and Expectations on Rate of Change in Price Level (Inflation)* | | (Percentage responses) | | Survey Round | Current Perception | One Year Ahead Expectation | | Increased | Remained Same | Decreased | Net Response | Will Increase | Will Remain Same | Will Decrease | Net Response | | Mar-16 | 82.7 | 13.9 | 3.4 | -79.3 | 82.4 | 13.2 | 4.4 | -78.0 | | Jun-16 | 85.3 | 12.4 | 2.3 | -83.0 | 83.3 | 13.0 | 3.7 | -79.6 | | Sep-16 | 61.8 | 22.4 | 15.8 | -45.9 | 64.3 | 22.4 | 13.3 | -51.0 | | Dec-16 | 57.8 | 18.0 | 24.2 | -33.5 | 62.4 | 17.1 | 20.6 | -41.8 | | Mar-17 | 80.5 | 12.5 | 7.0 | -73.5 | 79.9 | 13.8 | 6.3 | -73.6 | | Jun-17 | 79.9 | 11.5 | 8.5 | -71.4 | 78.7 | 13.5 | 7.9 | -70.8 | | Sep-17 | 81.2 | 10.8 | 8.0 | -73.2 | 79.1 | 14.2 | 6.7 | -72.5 | | Dec-17 | 80.9 | 12.7 | 6.4 | -74.5 | 77.9 | 16.2 | 5.9 | -72.0 | | Mar-18 | 81.0 | 12.4 | 6.6 | -74.4 | 81.5 | 12.5 | 6.1 | -75.4 | | Jun-18 | 81.8 | 10.5 | 7.7 | -74.2 | 79.4 | 13.7 | 6.9 | -72.5 | | Sep-18 | 80.8 | 13.2 | 6.1 | -74.7 | 79.8 | 14.2 | 6.1 | -73.7 | | Dec-18 | 77.9 | 15.2 | 6.9 | -71.0 | 76.3 | 17.3 | 6.4 | -69.9 | | Mar-19 | 72.5 | 20.0 | 7.6 | -64.9 | 72.9 | 20.8 | 6.3 | -66.6 | | *Applicable only for those respondents who felt price has increased/price will increase. |
| Table 5: Perceptions and Expectations on Household Income | | (Percentage responses) | | Survey Round | Current Perception | One Year Ahead Expectation | | Increased | Remained Same | Decreased | Net Response | Will Increase | Will Remain Same | Will Decrease | Net Response | | Mar-16 | 31.3 | 48.9 | 19.8 | 11.6 | 52.1 | 39.3 | 8.6 | 43.5 | | Jun-16 | 29.9 | 51.8 | 18.4 | 11.5 | 51.2 | 39.9 | 8.9 | 42.3 | | Sep-16 | 31.2 | 48.6 | 20.2 | 11.1 | 52.3 | 36.4 | 11.3 | 41.1 | | Dec-16 | 27.1 | 47.1 | 25.8 | 1.3 | 54.8 | 33.5 | 11.7 | 43.1 | | Mar-17 | 27.7 | 47.3 | 25.0 | 2.7 | 51.8 | 36.5 | 11.7 | 40.1 | | Jun-17 | 23.8 | 53.8 | 22.4 | 1.4 | 47.1 | 43.5 | 9.4 | 37.7 | | Sep-17 | 27.4 | 46.3 | 26.3 | 1.1 | 49.7 | 38.0 | 12.3 | 37.4 | | Dec-17 | 26.1 | 49.4 | 24.5 | 1.6 | 51.1 | 38.3 | 10.6 | 40.5 | | Mar-18 | 24.5 | 50.1 | 25.4 | -0.9 | 48.6 | 39.6 | 11.9 | 36.8 | | Jun-18 | 27.1 | 50.8 | 22.1 | 5.0 | 51.3 | 38.0 | 10.7 | 40.5 | | Sep-18 | 28.3 | 48.3 | 23.4 | 4.9 | 59.1 | 33.1 | 7.8 | 51.3 | | Dec-18 | 29.8 | 48.2 | 22.0 | 7.8 | 63.5 | 30.4 | 6.2 | 57.3 | | Mar-19 | 30.1 | 50.0 | 19.9 | 10.2 | 60.8 | 33.4 | 5.7 | 55.1 |
| Table 6: Perceptions and Expectations on Households’ Overall Spending | | (Percentage responses) | | Survey Round | Current Perception | One Year Ahead Expectation | | Increased | Remained Same | Decreased | Net Response | Will Increase | Will Remain Same | Will Decrease | Net Response | | Mar-16 | 78.0 | 9.9 | 12.1 | 65.9 | 78.5 | 10.6 | 11.0 | 67.5 | | Jun-16 | 82.7 | 8.4 | 8.8 | 73.9 | 82.2 | 10.2 | 7.6 | 74.6 | | Sep-16 | 70.3 | 24.1 | 5.7 | 64.6 | 79.1 | 17.0 | 3.9 | 75.2 | | Dec-16 | 73.5 | 20.8 | 5.6 | 67.9 | 78.3 | 15.8 | 5.9 | 72.4 | | Mar-17 | 84.4 | 13.4 | 2.1 | 82.3 | 88.5 | 8.3 | 3.1 | 85.4 | | Jun-17 | 81.3 | 17.2 | 1.5 | 79.8 | 83.5 | 13.7 | 2.8 | 80.7 | | Sep-17 | 83.6 | 14.8 | 1.7 | 81.9 | 85.4 | 12.4 | 2.2 | 83.2 | | Dec-17 | 84.2 | 14.0 | 1.8 | 82.4 | 85.2 | 12.0 | 2.8 | 82.4 | | Mar-18 | 83.1 | 14.9 | 2.1 | 81.0 | 85.2 | 12.3 | 2.5 | 82.8 | | Jun-18 | 83.8 | 14.1 | 2.0 | 81.8 | 86.5 | 11.3 | 2.2 | 84.4 | | Sep-18 | 78.4 | 18.2 | 3.5 | 74.9 | 81.2 | 15.7 | 3.1 | 78.1 | | Dec-18 | 73.8 | 22.7 | 3.5 | 70.3 | 77.3 | 18.7 | 4.0 | 73.3 | | Mar-19 | 70.1 | 26.8 | 3.1 | 67.0 | 77.5 | 19.9 | 2.6 | 74.9 |
| Table 7: Perceptions and Expectations on Spending on Essential Items | | (Percentage responses) | | Survey Round | Current Perception | One Year Ahead Expectation | | Increased | Remained Same | Decreased | Net Response | Will Increase | Will Remain Same | Will Decrease | Net Response | | Mar-16 | 79.6 | 9.3 | 11.1 | 68.5 | 78.6 | 11.9 | 9.6 | 69.0 | | Jun-16 | 83.0 | 8.2 | 8.8 | 74.3 | 81.1 | 10.6 | 8.3 | 72.8 | | Sep-16 | 79.1 | 16.9 | 4.0 | 75.1 | 82.5 | 12.7 | 4.8 | 77.6 | | Dec-16 | 76.9 | 18.4 | 4.7 | 72.2 | 77.5 | 14.9 | 7.7 | 69.8 | | Mar-17 | 85.8 | 11.1 | 3.1 | 82.7 | 87.0 | 9.2 | 3.8 | 83.2 | | Jun-17 | 82.2 | 15.3 | 2.5 | 79.7 | 81.9 | 13.5 | 4.6 | 77.2 | | Sep-17 | 85.4 | 12.3 | 2.4 | 83.0 | 85.8 | 10.8 | 3.4 | 82.4 | | Dec-17 | 85.7 | 12.4 | 1.9 | 83.8 | 85.4 | 10.5 | 4.0 | 81.4 | | Mar-18 | 83.8 | 13.7 | 2.5 | 81.3 | 85.2 | 11.6 | 3.2 | 82.0 | | Jun-18 | 86.6 | 11.1 | 2.3 | 84.3 | 87.5 | 10.0 | 2.5 | 85.0 | | Sep-18 | 83.6 | 13.1 | 3.4 | 80.2 | 84.2 | 13.1 | 2.7 | 81.5 | | Dec-18 | 82.4 | 14.5 | 3.1 | 79.3 | 83.5 | 13.0 | 3.4 | 80.1 | | Mar-19 | 78.6 | 18.2 | 3.2 | 75.4 | 83.4 | 14.3 | 2.3 | 81.1 |
| Table 8: Perceptions and Expectations on Spending on Non-Essential Items | | (Percentage responses) | | Survey Round | Current Perception | One Year Ahead Expectation | | Increased | Remained Same | Decreased | Net Response | Will Increase | Will Remain Same | Will Decrease | Net Response | | Mar-16 | 37.7 | 31.7 | 30.6 | 7.1 | 44.7 | 33.2 | 22.1 | 22.6 | | Jun-16 | 43.9 | 32.3 | 23.8 | 20.1 | 51.2 | 30.3 | 18.5 | 32.7 | | Sep-16 | 50.2 | 37.6 | 12.2 | 38.0 | 60.6 | 29.5 | 9.9 | 50.7 | | Dec-16 | 37.3 | 44.7 | 18.1 | 19.2 | 49.6 | 35.8 | 14.7 | 34.9 | | Mar-17 | 48.9 | 36.4 | 14.7 | 34.2 | 57.8 | 30.3 | 11.8 | 46.0 | | Jun-17 | 51.6 | 35.5 | 13.0 | 38.6 | 56.3 | 32.6 | 11.1 | 45.2 | | Sep-17 | 55.6 | 33.2 | 11.2 | 44.4 | 61.6 | 29.4 | 9.0 | 52.6 | | Dec-17 | 53.1 | 34.6 | 12.3 | 40.8 | 59.4 | 31.4 | 9.2 | 50.1 | | Mar-18 | 56.0 | 31.4 | 12.6 | 43.4 | 62.8 | 28.0 | 9.2 | 53.7 | | Jun-18 | 55.4 | 32.9 | 11.7 | 43.8 | 62.7 | 28.0 | 9.3 | 53.4 | | Sep-18 | 44.0 | 34.3 | 21.7 | 22.3 | 49.2 | 33.3 | 17.5 | 31.7 | | Dec-18 | 38.4 | 37.5 | 24.1 | 14.3 | 46.1 | 33.0 | 20.9 | 25.2 | | Mar-19 | 36.3 | 43.3 | 20.4 | 15.9 | 46.1 | 37.6 | 16.3 | 29.8 |
| Table 9: 99 per cent Bootstrap Confidence Intervals (BCI) Based on 10,000 Resamples | | | CSI | FEI | | Survey Round | CSI | 99 per cent BCI | Interval width | FEI | 99 per cent BCI | Interval width | | Mar-16 | 104.1 | (103.1, 105.0) | 1.9 | 122.2 | (121.3, 123.1) | 1.8 | | Jun-16 | 105.0 | (104.0, 105.9) | 1.9 | 122.0 | (121.0, 122.9) | 1.9 | | Sep-16 | 104.2 | (100.6, 103.5) | 2.9 | 123.3 | (128.3, 130.1) | 1.8 | | Dec-16 | 102.0 | (100.6, 103.5) | 2.9 | 129.7 | (128.3, 129.9) | 1.6 | | Mar-17 | 98.7 | (97.3, 100.1) | 2.8 | 121.7 | (120.3, 121.7) | 1.4 | | Jun-17 | 96.8 | (95.5, 98.1) | 2.6 | 120.8 | (119.4, 121.2) | 1.8 | | Sep-17 | 95.5 | (94.2, 96.8) | 2.6 | 118.8 | (117.7, 120.4) | 2.7 | | Dec-17 | 96.9 | (95.6, 98.3) | 2.7 | 122.6 | (121.2, 124.1) | 2.9 | | Mar-18 | 95.1 | (93.8, 96.4) | 2.6 | 117.4 | (116.0, 118.8) | 2.8 | | Jun-18 | 96.9 | (95.6, 98.3) | 2.8 | 117.8 | (116.5, 119.3) | 2.8 | | Sep-18 | 94.8 | (93.4, 96.1) | 2.8 | 121.1 | (119.5, 122.5) | 3.0 | | Dec-18 | 96.7 | (95.3, 98.1) | 2.8 | 128.9 | (127.5, 130.4) | 2.9 | | Mar-19 | 104.6 | (103.1, 106.0) | 2.9 | 133.4 | (132.0, 134.8) | 2.8 |
| Table 10: Coherence of Assessment on General Economic Situation vis-à-vis Other Indicators | | (Percentage of Respondents) | | Round | Employment | Price | Spending | Income | | Sep-2016 | 47.9 | 31.1 | 44.2 | 44.7 | | Dec-2016 | 48.2 | 33.7 | 41.9 | 44.4 | | Mar-2017 | 53.2 | 42.5 | 35.2 | 43.4 | | Jun-2017 | 54.6 | 43.7 | 34.0 | 42.8 | | Sep-2017 | 56.6 | 42.0 | 35.4 | 43.5 | | Dec-2017 | 40.7 | 39.2 | 36.8 | 44.2 | | Mar-2018 | 55.1 | 44.7 | 34.7 | 43.0 | | Jun-2018 | 56.5 | 44.0 | 35.2 | 43.0 | | Sep-2018 | 59.1 | 45.4 | 33.2 | 41.2 |
| Table 11: Coherence of Expectation on General Economic Situation vis-à-vis Other Indicators | | (Percentage of Respondents) | | Round | Employment | Price | Spending | Income | | Sep-2016 | 55.4 | 23.0 | 53.9 | 54.6 | | Dec-2016 | 59.6 | 27.6 | 57.5 | 57.6 | | Mar-2017 | 62.6 | 33.6 | 49.3 | 49.8 | | Jun-2017 | 64.8 | 36.9 | 47.7 | 51.5 | | Sep-2017 | 67.0 | 33.4 | 47.9 | 52.6 | | Dec-2017 | 66.0 | 29.8 | 51.0 | 53.0 | | Mar-2018 | 64.8 | 34.3 | 47.7 | 50.8 | | Jun-2018 | 64.6 | 32.6 | 48.3 | 52.4 | | Sep-2018 | 68.9 | 36.3 | 48.4 | 49.4 |
Annex C – Methodology 1. Measuring independence of attributes – Pearson’s chi-squared test (χ2) is a statistical test that is applied to sets of categorical data to evaluate how likely it is that any observed difference between the sets arose by chance. The test statistic is calculated as: where χ2 is a Pearson’s cumulative test statistic, which asymptotically approaches a χ2 distribution. Oi is the number of observations for type i. Ei is the expected count of type i. n is the number of cells in the table. 2. Ordered logit models – It is a class of models used to estimate relationships between an ordinal dependent variable and a set of independent variables. The ordinal variable is a categorical variable that is ordered. In ordered logit, an underlying score is estimated as a linear function of the independent variables and a set of cut points. The probability of observing outcome i corresponds to the probability that the estimated linear function, plus random error, is within the range of the cut points estimated for the outcome: yj denotes the outcome. β1, β2, …, βk are unknown coefficients corresponding to exogenous variables. uj is random error term assumed to be logistically distributed. ki–1, ki are the cut points.
|