Electronic goods have emerged as a major component in India’s merchandise imports and have been driven by telecom instruments. Within telecom instruments, the imports of mobile phone parts have been the major contributor from 2015-16 onwards and coincidentally mobile phone imports have trended down. This is corroborated by a close examination of component wise imports and domestic production of telecom instruments which point towards an increasingly higher domestic value addition in recent years. This move from essentially consumption driven imports to production induced imports has largely been conditioned by the policy impulses to increase domestic production which is a desirable outcome against the backdrop of high domestic demand. Introduction The advent of mobile telephony has catalysed a silent transformation in the Indian economy that is touching and revolutionalising the lives of its billion plus people. Providing interesting anecdotal evidence of these silent tectonic shifts, the on-ground impact of mobile phones on market efficiency (fish market price discovery) has been eloquently documented (Sanyal, 2008). Before the arrival of mobile phones, there was significant variation in fish prices within a district in Kerala and even between places which were only a few kilometers apart along the coast. However, with the advent of the mobile phones, fishermen while still at sea could take stock of onshore fish prices and head to the market with the best prices leading to an improvement in profits and a decline in consumer costs1. From fewer than 0.1 million telephones at the time of independence or around 300 phones per million people, exponential growth has taken their numbers to about 0.9 million phones per million people in 2018. With the second largest subscriber base in the world, mobile phones are much more than just a means of connectivity, they are proving to be a game-changer in sunrise sectors of the economy such as e-commerce, education, entertainment and healthcare, to name a few. Mobile phones increased productivity and brought about income enhancements in the small and medium enterprise (SME) sector (Uppal and Kathuria, 2009) and delivered productivity improvements in Indian agriculture (Mittal et al., 2010) including by enabling faster settlement of crop insurance claims of farmers by aiding in collection of reliable and timely data on crop yields (World Bank, 2013). It has been observed that a 10.0 per cent increase in mobile penetration leads to a 1.2 per cent increase in annual output in Indian states (Kathuria et al., 2009). In turn, mobile telephones are fundamentally changing the profile of India’s imports. The composition of India’s import basket has largely been dominated by gold and petroleum products. These two commodities, with a combined share of close to 40.0 per cent, have virtually defined the trajectory of India’s overall merchandise imports. In recent years, however, electronic goods imports increased from a little over US$ 0.9 billion in 1993-94 to US$ 51.5 billion in 2017-18, an annual growth rate of over 15.0 per cent. Consequently, the share of electronic goods increased from less than 4.0 per cent of India’s total merchandise imports to over 11.0 per cent during the same period. In fact, from 2013-14 onwards, electronic goods imports have had a higher share in merchandise imports than gold and currently constitute the second largest import item for India! This article undertakes an incisive examination of the phenomenon of India’s electronic imports and implications for the viability of India’s external balance. Specifically, the article studies the behavior of imports of mobile phones and parts thereof which lie at the heart of the surge in electronic goods imports. It seeks to highlight the role of policy initiatives in driving the phenomenon and its composition, with longer-term implications for domestic production. The rest of the article is divided into five sections. Section II briefly describes trade in the global electronics sector. An overview of the Indian electronic goods sector and the profile of India’s electronic goods imports is provided in Section III. Section IV discusses the impact on telecom instruments imports of the Phased Manufacturing Programme2. Concluding observations are presented in Section V along with some policy perspectives. II. The Global Electronics Environment The electronics industry is among the largest and fastest growing manufacturing industries globally with production estimated at $2.9 trillion in 20183. Concomitantly, trade in electronic goods has emerged as a significant engine of cross-border trade. The electronics industry can be divided into various segments, (viz., consumer electronics, electronic components, industrial electronics, office and telecom equipment and strategic electronics) of which office and telecom equipment is one of the biggest components4. Globally, exports of office and telecom equipment accounted for 10.5 per cent of total merchandise exports in 2017. With the ascent of China in global trade, its share in the export of office and telecom equipment has increased from less than 5.0 per cent of global office and telecom equipment exports in 2000 to 30.8 per cent in 2017. These goods formed about a quarter of China’s export basket in that year contributing a little more than a third of overall export growth in 2017 (Chart 1). 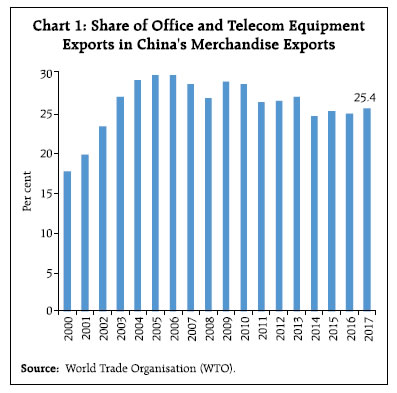 The USA, whose share in global office and telecom equipment exports was higher than that of China till 2002, has lost share from 15.9 per cent in 2000 to 7.8 per cent in 2017. The share of the other top exporters such as South Korea, Taiwan and Singapore was range bound through the 2000s. As a consequence of the rapid growth in Vietnam’s exports of office and telecom equipment, its share, which was less than 0.1 per cent in 2000, increased to 3.6 per cent in 2017. Among the top 10 exporters, South Korea witnessed the highest growth in the exports of office and telecom equipment in 2017 (Chart 2). Office and telecom equipment accounted for a share of 11.6 per cent of global merchandise imports in 2017 outpacing the growth in the latter during 2012-16. China is the world’s largest importer of office and telecom equipment with a share of 19.8 per cent in 2017, supplanting the US since 2011 with the latter’s share declining from 21.2 per cent in 2000 to 16.8 per cent in 2017. Other major importers, viz., Germany, Singapore and Japan have generally lost share while Vietnam and India have gained significantly (Chart 3). On a net basis, the US continues to be the largest importer of office and telecom equipment (Chart 4). The office and telecom equipment trade balance has worsened for the UK, Germany, and Canada during 2000-2017. A sharp increase in imports with exports remaining low through the 2000s caused India’s office and telecom equipment trade deficit to become the highest in the world after the US. III. India’s Electronic Goods Sector Electronic goods are being increasingly employed in all sectors of the Indian economy. With demand for electronic goods estimated to reach US$ 400 billion by 2025, electronics manufacturing is turning out to be a huge opportunity to generate employment and income. Domestic production of electronic goods has more than doubled in the last five years (Table 1). All components of electronic goods witnessed robust growth between 2013-18 with mobile phones, industrial electronics and consumer electronics accounting for over three-fourths of this growth during the last three years (Chart 5). Nevertheless, domestic production has been able to meet only about one-third of domestic demand, leaving a substantial portion to be met by imports. With India’s electronic goods exports growing at rates lower than electronic goods imports, the trade balance in this segment has deteriorated during the last two decades to over US$ 45.0 billion in 2017-18 (Chart 6). | Table 1: Production of Electronic Goods in India | | (US$ billion) | | S. No. | Item | 2013-14 | 2014-15 | 2015-16 | 2016-17 | 2017-18 | | 1 | Consumer Electronics | 7.9 | 9.1 | 8.5 | 9.7 | 11.4 | | 2 | Industrial Electronics | 5.6 | 6.4 | 6.9 | 9.3 | 10.7 | | 3 | Computer Hardware | 2.9 | 3.1 | 3.0 | 3.0 | 3.3 | | 4 | Mobile Phones | 4.4 | 3.1 | 8.2 | 13.4 | 20.5 | | 5 | Strategic Electronics | 2.3 | 2.6 | 2.8 | 3.1 | 3.7 | | 6 | Electronic Components | 5.3 | 6.5 | 6.9 | 7.8 | 9.1 | | 7 | Light Emitting Diodes | 0.3 | 0.4 | 0.8 | 1.1 | 1.5 | | | Total | 28.7 | 31.2 | 37.1 | 47.4 | 60.2 | Note: Average yearly USDINR rate used to convert figures to USD.
Source: Annual Report 2017-18, Ministry of Electronics & Information Technology (MeitY), Government of India (GoI). | Domestic manufacturing of electronic goods, particularly computer hardware, appears to have benefitted little from the boom in India’s software exports. As a result, India’s manufacturing base is concentrated in the last mile assembly of products and not production of components. Several factors such as lack of adequate infrastructure, supply chain and logistics; high cost of finance; inadequate availability of quality power; inadequate components manufacturing base; limited design capabilities and focus on R&D by the industry have led to limited value addition in the domestic electronics industry (GoI, 2019)5. This dichotomy can be largely traced to the policy environment (Francis, 2016). While a mandatory requirement to export for software companies pushed them towards becoming competitive, domestic manufacturing of computer hardware benefitted from quantitative restrictions, high import tariffs on these goods and reduction in tariffs on components and import of capital goods used in the manufacture of components in the 1980s. The domestic hardware industry was thus protected from foreign competition and in the process lost competitiveness. Incentives for the software industry in the form of duty-free import of computer hardware for 100 per cent export-oriented units generated headwinds for the growth of the nascent domestic manufacturing industry. The duty-free import of computer hardware also inhibited domestic firms from realising scale economies. In addition, with global trade being increasingly liberalised under the Information Technology Agreement (ITA-1) and various Free Trade Agreements (FTAs), electronic imports increased tremendously. As such, these developments reduced the attractiveness of India as a hub of electronics manufacturing (Francis, 2018). 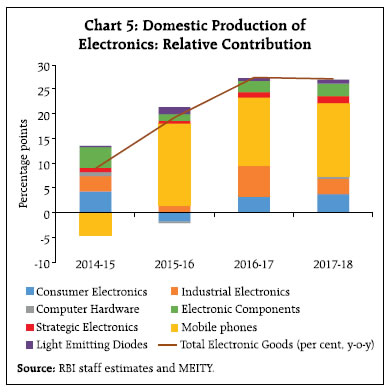 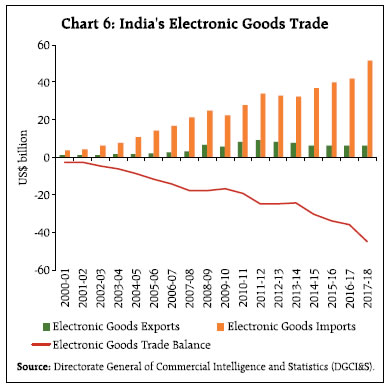 III.1 Recent Policy Initiatives Cognizant of the challenges facing electronics manufacturing, the Government has taken several measures to improve the competitiveness of Indian electronics manufacturers through tariff structure rationalisation, infrastructure upgradation, procedure simplification and provision of incentives. The National Policy on Electronics 2012 aimed at defining the trajectory of the Indian electronics sector. In July 2012, the Modified Special Incentive Package Scheme (M-SIPS) was announced to counter-balance heavy costs and attract investments in the Electronics System Design and Manufacturing (ESDM) sector by providing a capital subsidy of 20 per cent for units located in special economic zones (SEZs) and 25 per cent for units in non-SEZ areas. Furthermore, the Electronics Manufacturing Clusters (EMC) scheme was launched in October 2012 for the development/ upgradation of infrastructure and logistics. Electronics manufacturing is an important constituent of the ‘Make in India’ and ‘Digital India’ programmes of the Government. In fact, electronics manufacturing is one of the growth pillars under the ‘Digital India’ programme which envisages increasing production of electronic goods so as to achieve zero net imports by 2020 (GoI 2018)6. In addition, the Electronic Development Fund was created in February 2016 to provide risk capital to firms developing new technologies in the sphere of electronics and information technology (MeitY, 2018). An additional impetus to electronics manufacturing came in June 2017 via the Public Procurement Order which gave preference to domestic manufacturers in purchases of goods by the Government. Programmes to facilitate domestic manufacturing of electronics have been designed to encourage investment, foster innovation, protect intellectual property, and build best-in-class manufacturing infrastructure towards creating conducive environment for attracting investment in the electronics sector. 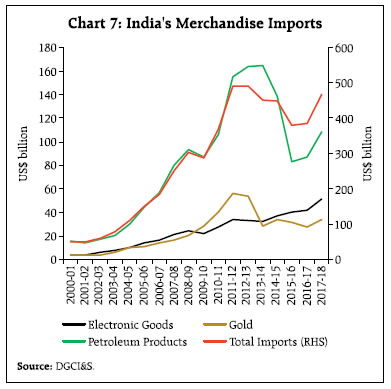 III.2 The Profile of Electronic Goods Imports Electronic goods imports have grown rapidly over the last two decades to reach US$ 51.5 billion in 2017-18 and are currently the second largest import item in India’s import basket with a share of over 11.0 per cent (Charts 7 and 8). Powering this increase has been the robust rise in the import of telecom instruments, with its share in electronic goods imports registering a 10 percentage points increase between 2011-18 (Chart 9). The share of all other components of electronic goods imports declined during the same period, making the rise in telecom instruments even more striking. On average, more than fifty per cent of the rise in electronic goods imports is explained by the increase in telecom instruments imports in the last five years (Chart 10). During April-December 2018, however, there has been a significant change in this growth profile. Electronic goods imports underwent a moderation in growth during April-December 2018 brought about by a 12.3 per cent (y-o-y) decline in telecom instruments imports (Chart 11). Electronic components imports, however, more than doubled between April- December 2016 and April-December 2018 to US$ 11.5 billion from US$ 5.7 billion. Beneath the aggregate data, interesting insights can be gleaned from more granular data, i.e., 4-digit, 6-digit and 8-digit level HS codes. Each constituent of electronic goods imports is itself composed of several items. In the next section, the movement in mobile phones is tracked and contrasted with the domestic production of mobile phones. IV. Policy Impulses: An Analytical Exploration This section attempts to analytically drill down into the stylised facts presented in previous sections with a focus on the role of policy initiatives. The limited objectives of the exercise undertaken here are to (1) check for structural shifts in the profile of imports of telecom instruments that are coincident or following in the train of specific policy measures, and (2) to explore the relationship between imports and domestic production. The period of the study is April 2012 – December 2018. Monthly data on imports are from the DGCI&S and on domestic production are from the Ministry of Electronics and Information Technology and Central Statistics Office (CSO), Ministry of Statistics and Programme Implementation (MoSPI). Telecom instruments are composed of 10 sub-items, out of which telephone sets constitute the largest component with a share of 96.4 per cent in 2017-187. Telephone sets comprise of 25 items at the 8-digit level (HS Code) but can be broadly clubbed into categories such as fixed line and other telephones, mobile phones and parts thereof, base stations, and machines for reception of multimedia data8. Mobile phones, on average, accounted for about 52.8 per cent of telephone set imports between 2011-12 – 2014-15, but this share has declined to 16.8 per cent in 2017-18. The vacated space has been largely taken up by parts of mobile phones (printed circuit boards among others) (Chart 12). The share of mobile phone parts more than doubled to 54.9 per cent from 19.8 per cent during 2014-18. Reflecting the declining share of mobile phones in telephone sets imports, their contribution to growth in telephone sets imports has been negative during 2015-18. These import dynamics can be traced back to policy impulses. Under the Make in India programme, announced in September 2014, mobile phone handsets and components manufacturing have emerged as a flagship sector and several domestic and foreign mobile phone brands now have a presence in India9. The decline in mobile phone imports began in October 2014 - the month after Make in India was announced. Further, the Government of India via the Union Budget 2015-16 introduced the Phased Manufacturing Programme (PMP) for mobile handsets and related sub-assemblies/ components manufacturing. The programme introduced a countervailing duty on mobile phone imports, a differential excise duty structure for domestic mobile phone manufacturing and it also exempted parts/components/accessories of mobile phones from basic customs duty (BCD) which encouraged domestic manufacturing of mobile phones (assembly, programming, testing and packaging or APTP). With the implementation of the PMP in stages and in line with its objective of progressively increasing domestic value addition and creating a robust mobile phone manufacturing eco-system in India, mobile phone imports began declining whereas imports of mobile phone parts increased (Table 2). 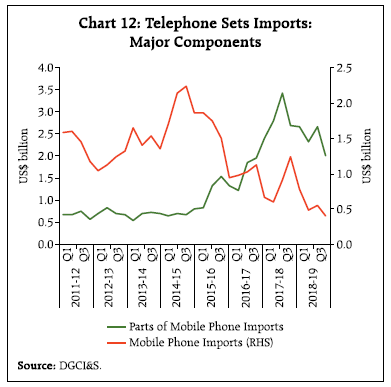
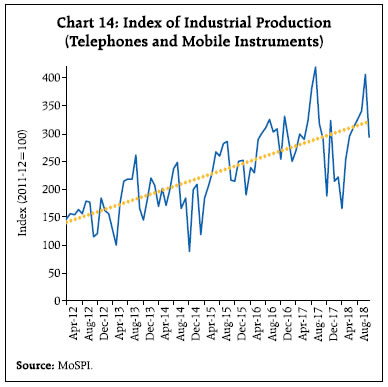
| Table 2: Implementation Status of PMP for Cellular Mobile Handsets and Parts | | Year | Sub-Assembly | Action Taken | | 2016-17 | 1. Charger/ Adapter | Implemented - BCD@15 per cent | | 2. Battery Pack | | 3. Wired Headset | | 2017-18 | 4. Mechanics | Implemented - BCD@15 per cent | | 5. Die Cut Parts | | 6. Microphone and Receiver | | 7. Key Pad | | 8. USB Cable | | 2018-19 | 9. Printed Circuit Board Assembly (PCBA) | Implemented - BCD@10 per cent | | 10. Camera Module | | 11. Connectors | | 2019-20 | 12. Display Assembly | - | | 13. Touch Panel/ Cover Glass Assembly | | 14. Vibrator Motor / Ringer | | Source: Ministry of Electronics & Information Technology. | Econometric evidence suggests that smartphone imports underwent a structural shift in Q2: 2015-16. The Quandt-Andrews unknown breakpoint test and the Bai-Perron test indicate the presence of a structural break in September 2015 after which smartphone imports have consistently declined (Table 3). The demand for mobile phones, as proxied by mobile phone subscribers, has increased during the period when mobile phone imports have declined (Chart 13). In addition, there has been a surge in imports of mobile phone parts which implies that there has been an increase in domestic production. With the phased indigenisation of sub-assemblies, the domestic value addition in the manufacture of mobile phones is expected to double by 2019-20. During the three years ending 2017-18, 120 manufacturing units (mobile handsets and components) had been set up in India and there has been an increase in domestic production of mobile phones as also reflected in the rising index of industrial production for telephones and mobile phones (Table 1 and chart 14). In addition, mobile phone imports are negatively correlated with the domestic production of mobile phones and imports of mobile phone parts, implying that decline in mobile phone imports has been accompanied by an increase in imports of mobile phone parts and domestic mobile phone production. | Table 3: Testing for Structural Breaks in Smartphone Imports | | Quandt-Andrews unknown breakpoint test (SMARTYOY) | Dependent Variable: SMARTYOY | | Null Hypothesis: No breakpoints within 15 per cent trimmed data | Method: Least Squares with Breaks | | Equation Sample: 2012M04 2018M12 | Sample (adjusted): 2012M04 2018M12 | | Test Sample: 2013M05 2017M12 | Break type: Bai-Perron tests of L+1 vs. L sequentially determined breaks | | Number of breaks compared: 56 | Break: 2015M09 | | Statistic | Value | Prob. | Variable | Coefficient | Std. Error | Prob. | | Maximum LR F-statistic (2015M09) | 125.2 | 0.00 | 2012M04 - 2015M08 -- 41 obs | 10.36 | 2.83 | 0.00 | | Exp LR F-statistic | 58.8 | 0.00 | 2015M09 - 2018M12 -- 40 obs | -45.16 | 6.40 | 0.00 | | Ave LR F-statistic | 53.3 | 0.00 | Durbin-Watson statistic | 1.35 | | | | Note: Probabilities calculated using Hansen’s (1997) method. | F-statistic | 125.18 | | | | | | | Prob(F-statistic) | 0.00 | | | | | | | Selection: Trimming 0.15, , Sig. level 0.05 | | | | | Note: SMARTYOY refers to month-wise year-on-year change in volume of smartphone imports. |
 Further, parts of mobile phone imports and domestic production have a linear positive relationship, which is statistically significant, indicating that the increases in domestic production and imports of mobile phone parts have been synchronous (Table 4). Furthermore, y-o-y changes in imports of mobile phone parts appear to be granger causing y-o-y changes in domestic production also indicating that mobile phone parts imports are enabling the expansion of domestic production of mobile phones (Table 5). Increases in the BCD on imports of mobile phones from nil to 10.0 per cent in July 2017 and further to 15.0 per cent in December 2017 and to 20.0 per cent in February 2018 have discouraged imports further while supporting domestic production. Meanwhile, the BCD on some parts of mobile phones has also been raised in multiple rounds to encourage the setting up of these industries in India. The import of printed circuit boards (PCBs) (an important component in the manufacture of electronics, including mobile phones) began increasing from June 2017 when the BCD was kept unchanged while the BCD on other components was increased. Nevertheless, the BCD on import of PCBs was increased to 10.0 per cent from nil, in April 2018 following which there has been a persistent decline in the import of this item. | Table 4: Correlations | | | Mobile Phone Imports (Volume) | Parts of Mobile Phone Imports (Volume) | IIP Mobile Phone | | Mobile Phone Imports (Volume) | 1.00 | - | - | | Parts of Mobile Phone Imports (Volume) | -0.64 | 1.00 | - | | IIP Mobile Phone | -0.72 | 0.65 | 1.00 | Sample period: April 2012 – December 2018.
Note: All correlations are significant at 1 per cent level. |
| Table 5: Pairwise Granger Causality Test Result | | Null Hypothesis: | F-Statistic | Prob. | | Mobile phone parts (y-o-y) does not Granger Cause IIP mobile phones (y-o-y) | 4.57286 | 0.0164 | | IIP mobile phones (y-o-y) does not Granger Cause mobile phone parts (y-o-y) | 0.60234 | 0.5525 | Observations: 44 (April 2015 – December 2018).
No of lags: 2. | On the other hand, electronic component imports have been pushed up by increases in imports of electronic integrated circuits, which do not attract duty currently. Integrated circuits are an input in making PCBs among other electronic goods; an increase in the import of this item is setting off a further increase in domestic value addition in the production of electronic goods/mobile phones. V. Conclusion and Policy Perspectives Electronic goods have emerged as a major component in India’s merchandise imports, driven by telecom instruments. Within telecom instruments, the imports of mobile phone parts have been the major contributor from 2015-16 onwards and coincidentally mobile phone imports have trended down. This article seeks to profile this phenomenon and attribute it to the implementation of the Phased Manufacturing Programme. This is corroborated by a close examination of component wise imports and domestic production of telecom instruments which point towards an increasingly higher domestic value addition in recent years. This move from essentially consumption driven imports to production induced imports has largely been conditioned by the policy impulses to increase domestic production which is a desirable outcome against the backdrop of high domestic demand. Tariffs are an import policy lever being used to nudge the electronic goods industry towards increasing domestic value added, a deft calibration of policy and rationalisation of import tariffs is underway. From a balance of payments perspective, surging imports can potentially increase external vulnerability. However, the switching of electronics imports from final consumption to intermediate goods offers some counter-balance in terms of higher investment, higher domestic value addition and more domestic employment. Moreover, with an improvement in export capacity, outward shipments of smartphones have increased from US$ 104.2 million during April-December 2017 to US$ 955.7 million during April-December 2018. The UAE, Russia, South Africa and China are emerging as important export destinations. Notably, smartphone exports to the UAE have surged with an eight fold increase during April-December 2018-19 over the relevant period of the previous year. Incentives under the Merchandise Exports of India Scheme (MEIS) and duty free import of specified capital goods for the manufacture of mobile phones will further encourage domestic production. As a robust domestic manufacturing ecosystem forms and matures, the pace of increase in electronic goods imports could slow, setting India on a path to becoming a net electronic goods exporter with a non-trivial share in the global market. References Francis, S. (2016), “Impact of Trade Liberalisation on the Indian Electronics Industry: Some Aspects of the Industrial Policy Dynamics of Global Value Chain Engagement”, Working Paper 192, Institute for Studies in Industrial Development, July. Francis, S. (2018), “India’s Electronics Manufacturing Sector- Getting the Diagnosis Right”, Economic and Political Weekly, Vol LIII no 34, August. Government of India (2019), “National Policy on Electronics 2019”, The Gazette of India, New Delhi, February. Jensen, R. (2007), “The Digital Provide: Information (Technology), Market Performance, and Welfare in the South Indian Fisheries Sector”, The Quarterly Journal of Economics, 122(3), 879-924. Kathuria, R., M. Uppal and Mamta (2009), “An Econometric Analysis of the Impact of Mobile”, The Policy Paper Series, Number 9, January. MeitY (2018), “Electronics and Information Technology”, Annual Report 2017-18, Government of India. Mittal, S., S. Gandhi and G. Tripathi (2010), “Socio- Economic Impact of Mobile Phones on Indian Agriculture”, ICRIER Working Paper, No 246, February. Sanyal, S. (2008), “The Indian Renaissance: India’s Rise After a Thousand Years of Decline”, Penguin Books India. Uppal, M. and R. Kathuria (2009), “The Impact of Mobiles in the SME Sector”, The Policy Paper Series, Number 9, January. World Bank (2013), “India: Mobile Phone App Helps Farmers Get Timely Crop Insurance Claims” available at http://www.worldbank.org/en/results/2013/04/12/india-mobile-phone-app-helps-farmers-get-timelycrop-insurance-claims [accessed on February 17, 2019].
|