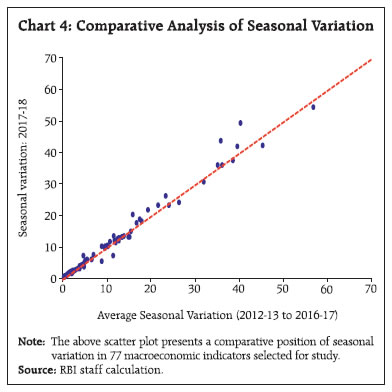
Noting that most production-related variables seasonally peak around March while price-related variables record a seasonal trough around the same time, this article finds that seasonal variations in the prices of food products such as tomatoes, pulses and primary articles have become accentuated over the last decade. As regards payment modes, instruments related to bulk transactions tend to peak during March, whereas, in the case of retail payment instruments, seasonality peaks during festivals. Introduction Seasonal variations in the form of recurring and, therefore, predictable weekly, monthly or quarterly patterns constitute a behavioural component in any economic series intertwined with other time series components, viz., trend, cyclical variations and random fluctuations. The presence of seasonality tends to obscure the true underlying characteristics of the economic variable and its data generating process as well as the inter-relationships between variables. At the same time, correctly understanding seasonal variations helps to accurately foresee behavioural changes. In this context, identification and segregation of seasonal factors (SF), which quantify extent of seasonal variations in an economic variable, is a first step to appropriately using information for purposes such as modeling and forecasting. Measuring seasonality and undertaking seasonal adjustments has been established as a best practice in the country experience. For instance, the US measures GDP growth in terms of quarter-on-quarter annualised rates of change after adjusting for seasonality. The Inflation Report of the Bank of England generally uses seasonally adjusted data. The Quarterly Financial Report of the Bank of Canada (2018) publishes assessment of seasonal demand for bank notes. The International Monetary Fund (2016) has advised member countries to report seasonally adjusted broad money data in their ‘Standardised Report Form for Money Aggregates’ in its International Financial and Monetary Statistics. The Reserve Bank has been publishing monthly seasonal factors for important macroeconomic variables since 19801. This article carries forward this endeavour by computing and updating seasonal factors upto 2017-18. The rest of the article is organised as follows. A review of the literature relating to evolution of methodology and global usage of seasonal factors is presented in Section II. The economic variables selected for study and choice of technique for extracting seasonal factors are explained in Section III. Section IV brings out the seasonality patterns for various groups of macroeconomic variables based on average monthly seasonal factors in the light of data upto 2017-18. Section V presents the results on temporal shifts in seasonality patterns buttressed by empirical evaluation of changing volatility in seasonality. Section VI concludes the article with some policy perspectives. II. Review of the Literature Representation of a time series in terms of its four basic components; trend, cycles, seasonal factors and irregular fluctuations, has two alternative forms: multiplicative if a time series is assumed to be the product of four components, and additive if it is postulated that the time series is the sum of these components. For a multiplicative representation of monthly data, for example, the absence of seasonal variations would mean that the seasonal factor takes value of 100 in each month, thus adding to 1200 in a year. Deviation of the seasonal factor from 100 at any time point indicates the presence of seasonality. For an additive model, on the other hand, seasonal factors add to zero in a year and positive/ negative seasonal factors at any time point signal that the series is deviating from trend. The literature refers to unmasking relevant short and long-term movements of economic time series by accounting for the behavioural nature of seasonality (Manna, et al., 2003; HCSO, 2017). Estimates of seasonal factors are observed to have improved trend-based forecasts of economic variables (Lembke, 2015). Seasonal adjustment has been employed along with various smoothening and filtering techniques to extract the persistent component in economic variables, notably core inflation (Samanta, et al., 2000). The literature on estimation of seasonal factors has a long history, starting from ratio-to-moving-average method (Macaulay, 1931), further refined as Census Methods by the US Census Bureau in 1954-55. Extensive research on the explicit functional specification of seasonal and trend/cycle components led to development of various versions of seasonal adjustment methods. The X-11 method (US Census Bureau, 1965) provided functional flexibility such as multiplicative as well as additive representation of components, treatment for extreme values and various tests for seasonality (Shiskin, et al., 1967). A major limitation of X-11 method, which is based on moving average or linear smoothing filter, however, was the lack of reliability of estimates for the most recent year because of inability to apply symmetric weights to end points as against central observations. This led to frequent revisions of estimates of most recent observations as more data points get added (Dagum, 1980). Statistics Canada’s X-11-ARIMA method incorporated an Autoregressive Integrated Moving Average (ARIMA) model into the X-11 method to extrapolate original time series data for one year at both ends of the series. This helped to deal with the ‘end points’ problem and to obtain robust estimates of seasonal factors in a scenario when seasonality is moving rapidly in a stochastic way. The US Census Bureau developed X-12-ARIMA as an enhanced version of X-11 and added a feature called RegARIMA which has an option of built-in or user-defined regressors that enable estimation of stock trading day and holiday effects as well as disruptions in the series such as sudden changes in levels (US Census Bureau, 2011). US Census Bureau’s latest X-13 ARIMA-SEATS (Signal Extraction in ARIMA Time Series) is an enhanced version of the X-11 variant with two additional options, viz., TRAMO (Time series Regression with ARIMA Noise, Missing Values and Outliers) for automatic model selection and SEATS for conducting the seasonal adjustment procedure (Gomez, et al., 1996; 2001a; 2001b; US Census Bureau, 2011). III. Data and Methodology In keeping with best country practices and upholding standards set in the past in the RBI, the macroeconomic indicators covered here are monetary, banking, price statistics, production data, service sector indicators and merchandise trade. In recognition of the rapid proliferation of alternate modes of payment in India, real time gross settlements (RTGS), paper clearing, retail electronic clearing (REC) and card payment are also subjected to seasonality analyses. Specifically, 77 monthly macroeconomic variables disaggregated by sector includes 13 monetary and banking indicators, 21 categories of indices relating to consumer prices, seven relating to wholesale prices, 23 on industrial production, six on service sector indicators, three on merchandise trade and four series on alternative payment indicators. Seasonal factors are mostly derived from time series dating back to April 1994 (Annex Table 1). Seasonal factors have been estimated under multiplicative model by using the X13-ARIMA-SEATS software of the US Census Bureau, after configuring it to suit Indian conditions, e.g., incorporating Diwali and Indian trading day effects. Seasonal adjustment can be done in two ways; i) direct approach - applying the seasonal adjustment procedure directly to the aggregate series; and ii) indirect approach – first seasonally adjusting each components of the composite series and then summing (aggregating) the components to get seasonally adjusted composite series (Manna, et al., 2003). The article follows the direct approach. IV. Analysis of Results All the macroeconomic variables that are considered here do not exhibit similar seasonality (Annex Tables 2 and 3)2. Of the 13 major monetary and banking indicators considered, 10 recorded seasonal peaks during March or April (around the financial year closure), whereas seasonal troughs for the majority of these series can be located either in August or in December. Bank loans registered a seasonal peak in March, whereas banks’ investments register a seasonal trough in that month. Demand deposits of scheduled commercial banks (SCBs) exhibited the highest seasonal variation (average seasonal factor (SF) range3 at 8.4) followed by reserve money (average SF range at 6.1) and currency in circulation (average SF range at 5.5). On the other hand, time deposits of SCBs, exhibited the smallest seasonal variation (average SF range at 1.4) indicating preference to banks’ deposits as a savings avenue for fixed return and low risk (Annex Table 4). The analysis of alternate payment modes which is an innovation in this article, shows that RTGS and retail electronic clearance (REC) record high seasonal variations and peak during March, indicating heightened usage of online transfers on annual financial year closing, whereas the seasonal peak of usage of card payments was found to be during October, corroborating elevated consumption demand around the festival season (Chart 1). Turning to prices, the CPI headline experiences seasonal upside pressure between July and November, which is largely due to prices of food and beverages. CPI-food is driven by the seasonal patterns of prices of vegetables. Prices of fruits peak during the summer (April - August) and those of vegetables around the monsoon (July - November) due to lower availability and persistent demand (Chart 2). CPI-vegetables showed the highest seasonal variation (seven-year average SF range at 23.1). Among vegetables, prices of tomatoes, onions and potatoes recorded average SF range of 67.8, 43.5 and 35.9, respectively. Seasonal variation in fruits prices was found to be lower than those of vegetables. Further, seasonal variations in the prices of cereals and products were found to be lower (average SF range at 0.7) than that of pulses and products (average SF range at 3.7), where mismatches in supply and demand, in the context of diet shifts linked to the economic development induced the price volatility. Seasonality in the aggregate CPI series [CPI-Combined, CPI for Industrial Workers (CPI-IW), CPI for Agricultural Labourers (CPI-AL) and CPI for Rural Labourers (CPI-RL)] is low while it is pronounced in some of the components, mainly food items. Out of 18 series, 15 registered a seasonal trough around February to May, aligned with the rabi harvest (Annex Table 3). Seasonal troughs in WPI series were concentrated in only two months relative to the distribution of seasonal peaks. Seasonal fluctuations in the WPI-all commodities were largely driven by prices of primary articles, especially food, which have a seasonal pattern similar to CPI-food and beverages. Prices of the manufactured products group showed the lowest seasonal variation (Annex Tables 3 and 4). As regards seasonality in output, industrial production is highly seasonal - the index of industrial production (IIP) showed an average SF range of 12.7. Among the major sectors, mining had the highest seasonal variation (average SF range at 29.5); under the use-based classification, capital goods had the highest seasonal fluctuation (average SF range at 39.9). Seasonal peaks in the IIP series mostly occurred in the last month of the financial year, which could be due to achieving annual targets; seasonal troughs, on the other hand, were scattered. A seasonal moderation in cement production was observed between July to November, which is the monsoon season in major parts of India. Fertiliser production registered a seasonal decline between February to June, which is the harvesting time of rabi crops and a lean season for agricultural activity. 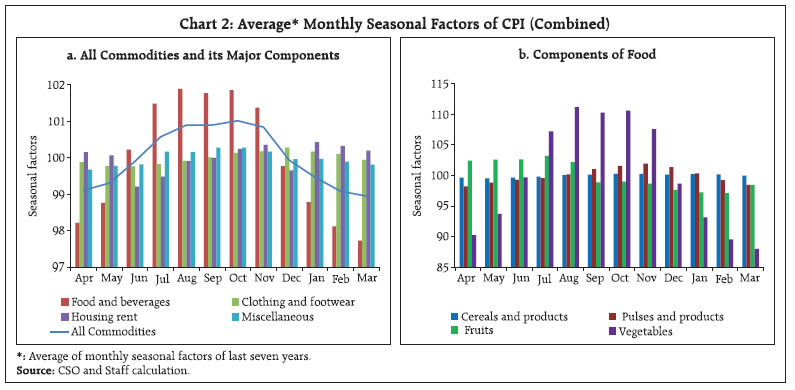 Four of the six services sector indicators recorded seasonal peaks in March. In the case of domestic and international passenger traffic, the seasonal peak coincided with the holiday seasons in May and January, respectively. Merchandise exports recorded a seasonal peak in March, coinciding with the peak in the industrial production. Imports registered a seasonal peak in October, evidently to fulfill higher demand during the festival season (Annex Table 3). V. Has Seasonality Changed? A simple way of identifying change in seasonality patterns in 2017-18 would be to compare the outcomes for 2017-18 with the average seasonal factors for the last five years (2012-13 to 2016-17). Out of the 77 selected series, the peak and the trough for 47 series remained unchanged whereas six series recorded shifts in both peaks and troughs. This change in seasonality was noticed mainly in the case of CPI and industrial production (Chart 3). The seasonal peak in CPI-all commodities advanced to August in 2017-18 from October earlier, mainly reflecting change in the prices of food and beverages. The latter have now aligned with the seasonal peak in the prices of food articles in the wholesale market. Seasonal peaks in the prices of clothing and footwear also shifted to October - the festival season in the country - from December earlier. Further, greater convergence in the seasonal peaks of the components of industrial production was found in 2017-18 (Annex Table 5). In order to explore ‘moving seasonality’- changes in seasonal factors over time - detecting the presence of secular trend is critical. A downward (upward) trend in the seasonal fluctuation of a series shows decline (increase) in seasonal variation in the series over time. While in majority of the cases, seasonal variation/ fluctuations (difference between the maximum and the minimum monthly seasonal factors) in 2017-18 remained similar to the previous five years’ average (Chart 4 and Annex Table 6), empirical evidence indicates that seasonal fluctuations moderated for 31 series over a longer time horizon of last 10 years4. On the other hand, seasonality became more pronounced in another 17 series (Annex Table 7). 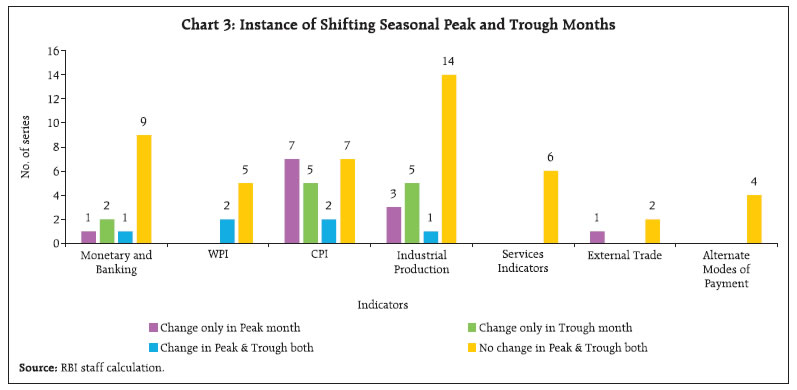
 Seasonal fluctuations in monetary and banking aggregates either moderated or remained broadly unchanged during last 10 years, arguably reflecting better availability of banking services. Mining and electricity recorded rise in seasonal variation. The mining activity, especially coal, is adversely affected due to rain and slowdown in railway transport during the monsoon season. Hence, supposedly the higher production during active season to meet rising demand of coal and other minerals explains the rise in seasonal fluctuation over time. Round the year demand possibly may be yielding a moderation in seasonal variation over time for manufacturing sector. Although seasonal variation remained unchanged for the majority of CPI-combined elements, retail prices of pulses exhibited higher seasonality; likely on account of evolving demand from generalised diet shifts across population groups. Tomatoes also witnessed a large variation in retail prices. In the wholesale market, prices of primary articles showed more seasonal variation than prices of manufactured products (Chart 5 and Annex Table 7). 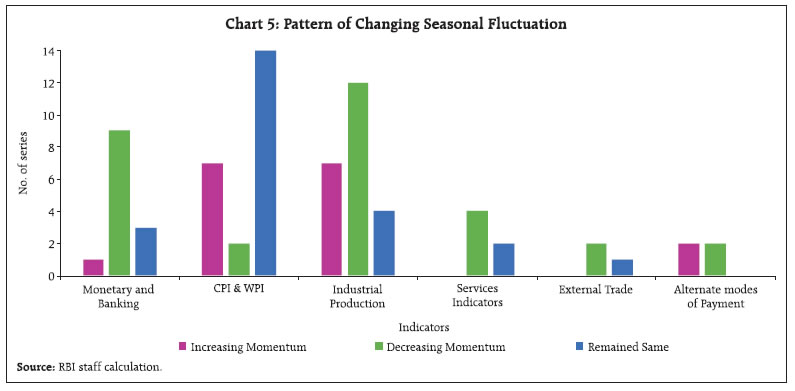 VI. Conclusion Central banks entrusted with macroeconomic and financial stability, constantly assess the economy through available macroeconomic indicators. However, their vision is often clouded by transient variations which may conceal underlying movements that mirror the current state of the economy. As this article brings out, seasonal adjustment has a crucial role to play in an accurate reading of the economy and hence fashioning economic policies. Estimation of seasonal effects and correcting for these also enables an understanding of the inter-play among variables which, in turn, contributes to credible model building and forecasting. Future research in this area needs to focus on the role of seasonal factors in improving forward looking assessment. In this regard, identifying shifts in seasonality patterns of macro-variables over time, offers rich potential for empirical research. As noted in the article, the heightened seasonal demand for currency in circulation around financial year-end and beginning of agricultural season, viz., March and June gives a cue for an efficient currency management in the country, whereas, seasonal pattern in banks’ deposits can guide in putting to optimal use the banks’ resources, especially human resources. Driven by the prices of vegetables, CPI headline inflation exhibit price pressures during the monsoon season, i.e., July to November. The seasonal peak for general retail prices has advanced to August in 2017-18 from October earlier, aligning with the wholesale market. This calls for establishment of robust and outreaching supply networks in general and specially for perishable items. The seasonal peak in the prices of clothing and footwear has advanced to October, the festival season in the country, from December earlier. Most items in industrial production peak in March whereas the production of consumer durables peaks in October. Imports, especially non-oil non-gold imports experience a peak during the same period. This indicates a possibility of capacity building of industrial sector to fulfill the heightened unwavering demand through domestic production rather than imports. Further, bank credit peaks in March, apparently to fulfill the year-end pressure of target achievements. Well strategising credit availability by the credit institutions to MSME sector, keeping in mind the demand around festivals, will impart stimulus to the manufacturing sector. References Bank of Canada (2018), “Quarterly Financial Report”, June 30. Bank of England (2019), “Inflation Report”, February. Dagum, E. B. (1980). “The X-11-ARIMA Seasonal Adjustment Method”, Statistics Canada. Deutsche Bundesbank (2018), “Monthly Report”, Vol. 70, No.9, September. Gomez, V. and Maravall, A. (1996), “Programs TRAMO and SEATS: Instructions for the User”, Bank of Spain. Gomez, V. and Maravall, A. (2001a), “Automatic modeling methods for univariate series”. In D. Pena, G. C. Tiao, and R. S. Tsay (Eds.), A Course in Time Series Analysis. New York, NY: J. Wiley and Sons. Gomez, V. and Maravall, A. (2001b), “Seasonal adjustment and signal extraction in economic time series”. In D. Pena, G. C. Tiao, and R. S. Tsay (Eds.), A Course in Time Series Analysis. New York, NY: J. Wiley and Sons. HCSO (2007), “Seasonal Adjustments – Methods and Practices”, Budapest, July, Hungarian Central Statistics Office. IMF (2016), “Monetary and Financial Statistics Manual and Compilation Guide”, International Monetary Fund. Lembke, R. (2015), “Forecasting with Seasonality”, http://business.unr.edu/faculty/ronlembke/handouts/Seasonality%20Final17.pdf. Macaulay, F. R. (1931), “The Smoothing of Time Series”, National Bureau of Economic Research, Inc. Manna, M. and Peronaci, R. (2003), “Seasonal Adjustment”, European Central Bank. Reserve Bank of India (2017), “Monthly Seasonal Factors of Selected Economic Time Series, 2016-17”, Reserve Bank of India Bulletin, September, Vol. LXXI, No. 9. Samanta, G.P. and Bhattarjee, M. (2000), “Are Seasonal Adjustment and HP-Filter Useful in Estimating Core Inflation in India?”, International Journal of Development Banking, Vol. 18, No. 2, July, pp. 61-75. Shiskin, J., Young, A.H. and Musgrave, J.C. (1967), “The X-11 Variant of Census Method II Seasonal Adjustment Programme”, Technical Paper No. 15, Bureau of the Census, U.S. Department of Commerce. US Census Bureau (1965), “Estimating Trading-Day Seasonal Variation in Monthly Economic Time Series”, US Bureau of the Census Technical Paper No. 12. U.S. Census Bureau (2011), “X-12-ARIMA Reference Manual”, Version 0.3, Time Series Research Staff, Statistical Research Division (https://www.census.gov/ts/x12a/v03/x12adocV03.pdf). U.S. Census Bureau (2017), “X-13-ARIMA-SEATS Reference Manual”, Version 1.1, Time Series Research Staff, Center for Statistical Research and Methodology (https://www.census.gov/ts/x13as/docX13AS.pdf).
Annex | Table 1: Time Period Used for Estimating Seasonal Factors | | Name of Sectors/Variables | Time Period | Name of Sectors/Variables | Time Period | | Monetary and Banking Indicators (13 series) | Index of Industrial Production (23 series) | A.1.1 Broad Money (M3)
A.1.1.1 Net Bank Credit to Government
A.1.1.2 Bank Credit to Commercial Sector
A.1.2 Narrow Money (M1)
A.1.3 Reserve Money (RM)
A.1.3.1 Currency in Circulation
A.2.1 Aggregate Deposits (SCBs)
A.2.1.1 Demand Deposits (SCBs)
A.2.1.2 Time Deposits (SCBs)
A.3.1 Bank Credit (SCBs)
A.3.1.1 Loans, Cash Credits and Overdrafts (SCBs)
A.3.1.2 Non-Food Credit (SCBs)
A.3.2 Investments (SCBs) | April 1994 to March 2018 | E. IIP (Base 2011-12 = 100) General Index | April 1994 to March 2018 | E.1.1 IIP - Primary goods
E.1.2 IIP - Capital goods
E.1.3 IIP - Intermediate goods
E.1.4 IIP - Infrastructure/ construction goods
E.1.5 IIP - Consumer goods
E.1.5.1 IIP - Consumer durables
E.1.5.2 IIP - Consumer non-durables | April 2012 to March 2018 | E.2.1 IIP - Mining
E.2.2 IIP - Manufacturing | April 1994 to March 2018 | E.2.2.1 IIP - Manufacture of food products
E.2.2.2 IIP - Manufacture of beverages
E.2.2.3 IIP - Manufacture of textiles
E.2.2.4 IIP - Manufacture of chemicals and chemical products
E.2.2.5 IIP - Manufacture of motor vehicles, trailers and semi-trailers | April 2012 to March 2018 | | Price Indices[CPI: 21 series and WPI: 7 series] | B. CPI (Base: 2012 = 100) All Commodities
B.1 CPI - Food and beverages
B.1.1 CPI - Cereals and products
B.1.2 CPI - Meat and fish
B.1.3 CPI – Egg
B.1.4 CPI - Milk and products
B.1.5 CPI – Fruits
B.1.6 CPI - Vegetables
B.1.6.1 CPI – Potato
B.1.6.2 CPI – Onion
B.1.6.3 CPI – Tomato
B.1.7 CPI - Pulses and products
B.1.8 CPI – Spices
B.1.9 CPI - Non-alcoholic beverages
B.1.10 CPI - Prepared meals, snacks, sweets etc.
B.2 CPI - Clothing and footwear
B.3 CPI – Housing
B.4 CPI - Miscellaneous | January 2011 to March 2018 | | E.2.3 IIP - Electricity | April 1994 to March 2018 | E.3 Cement Production
E.4 Steel Production
E.5 Coal Production
E.6 Crude Oil Production
E.7 Petroleum Refinery Production
E.8 Fertiliser Production
E.9 Natural Gas Production | April 2004 to March 2018 | | Service sector Indicators (6 series) | F.1 Production of Commercial Motor Vehicles
F.2 Cargo handled at Major Ports
F.3 Railway Freight Traffic
F.4 Sales of Commercial Motor Vehicles
F.5 Passenger flown (Km) - Domestic
F.6 Passenger flown (Km) - International | April 1994 to March 2018 | C.1 Consumer Price Index for Industrial Workers (Base: 2001=100)
C.2 Consumer Price Index for Agricultural Labourers (Base: 1986-87=100)
C.3 Consumer Price Index for Rural Labourers (Base: 1986-87=100) | January 2000 to March 2018 | | Merchandise Trade (3 series) | G.1 Exports
G.2 Imports
G.3 Non-Oil Non-Gold Imports | April 1994 to March 2018 | D. WPI (Base: 2011-12=100) All Commodities
D.1 WPI - Primary Articles
D.1.1 WPI - Food Articles
D.2 WPI - Manufactured Products
D.2.1 WPI - Manufacture of Food Products
D.2.2 WPI - Manufacture of Chemicals & Chemical Products
D.2.3 WPI - Manufacture of Basic Metals Alloys & Metals Products | April 1994 to March 2018 | | Alternate Modes of Payment (4 Series) | | H.1 Real Time Gross Settlement | April 2004 to March 2018 | | H.2 Paper Clearing | April 2005 to March 2018 | H.3 Retail Electronic Clearing
H.4 Cards | April 2004 to March 2018 | Note: 1. CPI-Combined data is available from January 2011 only.
2. CPI-IW, AL & RL data are broadly aligned with the latest base year of CPI-IW.
3. Data on IIP use-based and disaggregated sectors (NIC-2 digit level) was considered since Apr 2012 as back series could not be computed due to major changes in coverage from previous base year.
4. All the data being used for this study are publically available in the Database on India Economy, Reserve Bank of India. |
| Table 2: No. of Peaks and Trough Observed Over Different Months* | | Sectors/sub-sectors | | Apr | May | Jun | Jul | Aug | Sep | Oct | Nov | Dec | Jan | Feb | Mar | Total | | Monetary and Banking | Peak | 3 | 1 | | 1 | 1 | | | | | | | 7 | 13 | | Trough | | | | | 4 | 2 | | 1 | 4 | 1 | | 1 | 13 | | CPI | Peak | | | | 3 | 2 | 2 | 4 | 6 | 2 | 2 | | | 21 | | Trough | 3 | 4 | 2 | | | | | 1 | | | 3 | 8 | 21 | | WPI | Peak | 1 | 2 | | 1 | 1 | 1 | 1 | | | | | | 7 | | Trough | | | | | | | | | 2 | 1 | 1 | 3 | 7 | | Industrial Production | Peak | | 2 | | 1 | 1 | | 3 | | 2 | | | 14 | 23 | | Trough | 6 | | 1 | | 3 | 5 | | 2 | 1 | | 5 | | 23 | | Services Indicators | Peak | | 1 | | | | | | | | 1 | | 4 | 6 | | Trough | 1 | | 1 | | | 4 | | | | | | | 6 | | External Trade | Peak | | | | | | | 2 | | | | | 1 | 3 | | Trough | | | | | | | | 1 | | | 2 | | 3 | | Alternate Modes of Payment | Peak | | | | | | | 1 | | | | | 3 | 4 | | Trough | | | | | | | | 2 | | | 2 | | 4 | | Total | Peak | 4 | 6 | | 6 | 5 | 3 | 11 | 6 | 4 | 3 | | 29 | 77 | | Trough | 10 | 4 | 4 | | 7 | 11 | | 7 | 7 | 2 | 13 | 12 | 77 | *Note: 1. In general, seasonal peaks and troughs have been decided based on the average seasonal factors of last ten years.
2. Blank cells indicate no peak or trough observed. |
| Table 3: Average* Monthly Seasonal Factors of Selected Economic Time Series | | Series/Month | Apr | May | Jun | Jul | Aug | Sep | Oct | Nov | Dec | Jan | Feb | Mar | | 1 | 2 | 3 | 4 | 5 | 6 | 7 | 8 | 9 | 10 | 11 | 12 | 13 | | Monetary and Banking Indicators(13 series) | | A.1.1 Broad Money (M3) | 101.3 | 100.9 | 100.1 | 100.2 | 99.8 | 99.6 | 99.9 | 99.5 | 99.2 | 99.4 | 99.6 | 100.6 | | A.1.1.1 Net Bank Credit to Government | 101.4 | 101.2 | 100.9 | 101.8 | 101.1 | 99.6 | 99.7 | 99.7 | 97.6 | 98.7 | 98.8 | 99.5 | | A.1.1.2 Bank Credit to Commercial Sector | 101.0 | 100.4 | 100.2 | 99.4 | 99.0 | 99.3 | 99.3 | 99.2 | 99.7 | 100.2 | 100.5 | 101.9 | | A.1.2 Narrow Money (M1) | 102.4 | 101.9 | 101.3 | 100.0 | 99.6 | 100.1 | 98.8 | 98.0 | 98.1 | 97.6 | 99.0 | 102.5 | | A.1.3 Reserve Money (RM) | 102.1 | 101.7 | 101.0 | 99.7 | 98.9 | 98.3 | 98.6 | 99.2 | 98.7 | 98.6 | 99.0 | 104.3 | | A.1.3.1 Currency in Circulation | 102.7 | 103.2 | 101.7 | 99.4 | 98.7 | 97.8 | 98.3 | 99.0 | 99.1 | 99.4 | 100.0 | 100.4 | | A.2.1 Aggregate Deposits (SCBs) | 100.9 | 100.4 | 99.7 | 100.2 | 99.8 | 99.9 | 100.2 | 99.8 | 99.5 | 99.5 | 99.6 | 100.6 | | A.2.1.1 Demand Deposits (SCBs) | 100.9 | 99.4 | 98.9 | 98.2 | 98.1 | 101.1 | 99.5 | 99.0 | 100.6 | 98.4 | 98.9 | 106.5 | | A.2.1.2 Time Deposits (SCBs) | 100.8 | 100.5 | 99.8 | 100.4 | 99.9 | 99.6 | 100.4 | 100.0 | 99.4 | 99.7 | 99.6 | 100.0 | | A.3.1 Bank Credit (SCBs) | 101.1 | 100.3 | 100.2 | 99.5 | 99.0 | 99.2 | 99.2 | 99.2 | 100.0 | 99.8 | 100.2 | 102.2 | | A.3.1.1 Loans, Cash Credits and Overdrafts (SCBs) | 100.5 | 100.0 | 100.3 | 99.1 | 98.8 | 100.7 | 99.2 | 98.9 | 99.6 | 99.7 | 100.0 | 103.3 | | A.3.1.2 Non-Food Credit (SCBs) | 101.1 | 100.2 | 100.1 | 99.3 | 99.0 | 99.7 | 99.4 | 99.0 | 99.8 | 99.7 | 100.1 | 102.6 | | A.3.2 Investments (SCBs) | 100.2 | 100.4 | 100.1 | 101.0 | 101.7 | 101.0 | 100.8 | 100.5 | 98.9 | 99.0 | 99.0 | 97.4 | | Price Indices [ CPI: 21 series and WPI: 7 series ] | | B. CPI (Base: 2012 = 100) All Commodities | 99.1 | 99.3 | 99.9 | 100.6 | 100.9 | 100.9 | 101.0 | 100.8 | 99.9 | 99.5 | 99.1 | 99.0 | | B.1 CPI - Food and beverages | 98.2 | 98.8 | 100.2 | 101.5 | 101.9 | 101.8 | 101.9 | 101.4 | 99.8 | 98.8 | 98.1 | 97.7 | | B.1 .1 CPI - Cereals and products | 99.7 | 99.5 | 99.7 | 99.8 | 100.0 | 100.1 | 100.3 | 100.3 | 100.1 | 100.2 | 100.2 | 100.0 | | B.1 .2 CPI - Meat and fish | 99.7 | 100.3 | 101.9 | 101.9 | 101.0 | 100.1 | 99.5 | 98.7 | 98.7 | 99.4 | 99.3 | 99.4 | | B.1 .3 CPI - Egg | 96.8 | 96.7 | 98.2 | 99.8 | 98.9 | 98.9 | 99.3 | 101.8 | 103.7 | 104.3 | 101.7 | 99.7 | | B.1 .4 CPI - Milk and products | 99.6 | 99.9 | 100.0 | 100.2 | 100.2 | 100.2 | 100.2 | 100.3 | 100.0 | 99.9 | 99.8 | 99.6 | | B.1 .5 CPI - Fruits | 102.4 | 102.6 | 102.6 | 103.2 | 102.2 | 98.9 | 99.0 | 98.7 | 97.6 | 97.3 | 97.1 | 98.4 | | B.1 .6 CPI - Vegetables | 90.3 | 93.7 | 99.7 | 107.2 | 111.2 | 110.3 | 110.6 | 107.6 | 98.7 | 93.2 | 89.6 | 88.0 | | B.1 .6.1 CPI - Potato | 86.4 | 95.1 | 102.3 | 109.2 | 113.5 | 113.7 | 115.2 | 115.6 | 101.7 | 86.7 | 79.6 | 81.0 | | B.1 .6.2 CPI - Onion | 79.9 | 78.3 | 83.3 | 96.3 | 111.5 | 117.7 | 120.2 | 121.8 | 108.5 | 103.0 | 94.4 | 85.0 | | B.1 .6.3 CPI - Tomato | 79.4 | 90.6 | 109.5 | 139.4 | 121.6 | 109.8 | 108.9 | 122.5 | 93.3 | 80.1 | 71.7 | 73.1 | | B.1 .7 CPI - Pulses and products | 98.2 | 98.9 | 99.3 | 99.6 | 100.2 | 101.1 | 101.6 | 101.9 | 101.4 | 100.3 | 99.2 | 98.5 | | B.1 .8 CPI - Spices | 99.2 | 99.3 | 99.6 | 99.9 | 100.2 | 100.4 | 100.4 | 100.5 | 100.5 | 100.3 | 99.9 | 99.6 | | B.1 .9 CPI - Non-alcoholic beverages | 99.9 | 100.0 | 100.0 | 100.1 | 100.1 | 100.1 | 100.1 | 100.1 | 100.0 | 100.0 | 99.9 | 99.8 | | B.1 .10 CPI - Prepared meals, snacks, sweets etc. | 99.8 | 99.7 | 99.8 | 99.9 | 100.0 | 100.1 | 100.1 | 100.3 | 100.2 | 100.1 | 100.1 | 99.9 | | B.2 CPI - Clothing and footwear | 99.9 | 99.8 | 99.8 | 99.8 | 99.9 | 100.0 | 100.1 | 100.2 | 100.3 | 100.2 | 100.1 | 99.9 | | B.3 CPI - Housing | 100.2 | 100.1 | 99.2 | 99.5 | 99.9 | 100.0 | 100.2 | 100.4 | 99.7 | 100.4 | 100.3 | 100.2 | | B.4 CPI - Miscellaneous | 99.7 | 99.8 | 99.8 | 100.2 | 100.2 | 100.3 | 100.3 | 100.2 | 100.0 | 100.0 | 99.9 | 99.8 | | C.1 Consumer Price Index for Industrial Workers (Base: 2001=100) | 99.2 | 99.4 | 99.7 | 100.9 | 100.9 | 100.7 | 101.0 | 100.8 | 99.9 | 99.6 | 99.1 | 98.8 | | C.2 Consumer Price Index for Agricultural Labourers (Base: 1986-87=100) | 98.9 | 99.1 | 99.6 | 100.3 | 100.8 | 100.9 | 101.1 | 101.1 | 100.4 | 99.8 | 99.3 | 98.8 | | C.3 Consumer Price Index for Rural Labourers (Base: 198687=100) | 98.9 | 99.2 | 99.6 | 100.3 | 100.8 | 100.8 | 101.1 | 101.0 | 100.4 | 99.8 | 99.3 | 98.8 | | D. WPI (Base: 2011-12=100) All Commodities | 99.8 | 100.1 | 100.1 | 100.7 | 100.6 | 100.6 | 100.5 | 100.2 | 99.5 | 99.5 | 99.2 | 99.3 | | D.1 WPI - Primary Articles | 99.1 | 99.5 | 100.7 | 101.5 | 102.0 | 101.5 | 101.2 | 101.2 | 99.3 | 98.5 | 97.9 | 97.6 | | D.1.1 WPI - Food Articles | 98.5 | 99.1 | 100.5 | 101.8 | 102.0 | 101.9 | 102.5 | 102.2 | 99.1 | 98.6 | 96.9 | 96.6 | | D.2 WPI - Manufactured Products | 100.3 | 100.4 | 100.3 | 100.2 | 100.1 | 100.1 | 100.1 | 99.7 | 99.5 | 99.7 | 99.7 | 99.9 | | D.2.1 WPI - Manufacture of Food Products | 100.0 | 99.9 | 99.8 | 100.3 | 100.4 | 100.6 | 100.4 | 100.1 | 99.8 | 99.9 | 99.5 | 99.1 | | D.2.2 WPI - Manufacture of Chemicals & Chemical Products | 100.1 | 100.5 | 100.3 | 100.3 | 100.3 | 100.1 | 100.0 | 99.7 | 99.5 | 99.6 | 99.7 | 99.9 | | D.2.3 WPI - Manufacture of Basic Metals Alloys & Metals Products | 100.9 | 100.8 | 100.5 | 99.9 | 99.5 | 99.8 | 99.9 | 99.5 | 99.2 | 99.7 | 99.8 | 100.6 | | (Contd.) |
| Table 3: Average Monthly Seasonal Factors of Selected Economic Time Series | | Series/Month | Apr | May | Jun | Jul | Aug | Sep | Oct | Nov | Dec | Jan | Feb | Mar | | 1 | 2 | 3 | 4 | 5 | 6 | 7 | 8 | 9 | 10 | 11 | 12 | 13 | | Index of Industrial Production (23 series) | | E. IIP (Base 2011-12 = 100) General Index | 96.6 | 99.8 | 98.5 | 98.2 | 96.6 | 97.9 | 99.5 | 97.9 | 103.5 | 103.3 | 98.6 | 109.4 | | E.1.1 IIP - Primary goods | 97.3 | 102.1 | 98.5 | 97.6 | 97.8 | 95.1 | 100.5 | 98.4 | 104.2 | 104.2 | 96.3 | 108.3 | | E.1.2 IIP - Capital goods | 88.9 | 97.2 | 100.1 | 95.1 | 96.5 | 101.6 | 95.2 | 97.0 | 100.6 | 96.6 | 102.5 | 128.8 | | E.1.3 IIP - Intermediate goods | 97.4 | 100.4 | 98.8 | 101.0 | 100.3 | 100.2 | 98.9 | 97.5 | 100.8 | 100.7 | 97.0 | 107.2 | | E.1.4 IIP - Infrastructure/ construction goods | 99.9 | 104.8 | 101.6 | 100.7 | 97.7 | 96.6 | 97.5 | 93.0 | 99.9 | 103.5 | 98.7 | 106.5 | | E.1.5 IIP - Consumer goods | 95.3 | 98.9 | 96.7 | 97.1 | 96.8 | 101.0 | 101.9 | 99.9 | 103.7 | 102.9 | 100.0 | 105.4 | | E.1.5.1 IIP - Consumer durables | 95.4 | 98.3 | 97.0 | 98.1 | 97.4 | 105.3 | 108.4 | 100.1 | 98.1 | 99.2 | 97.0 | 105.1 | | E.1.5.2 IIP - Consumer non-durables | 95.0 | 100.4 | 96.8 | 97.0 | 96.2 | 95.6 | 96.8 | 99.2 | 107.7 | 106.1 | 102.6 | 106.1 | | E.2.1 IIP - Mining | 98.1 | 100.6 | 95.5 | 91.7 | 90.5 | 89.3 | 97.5 | 100.0 | 107.2 | 108.7 | 102.7 | 118.7 | | E.2.2 IIP - Manufacturing | 96.0 | 99.4 | 98.6 | 98.7 | 97.2 | 99.0 | 99.5 | 97.9 | 103.3 | 102.7 | 98.9 | 108.3 | | E.2.2.1 IIP - Manufacture of food products | 94.5 | 87.9 | 86.2 | 89.9 | 88.7 | 89.0 | 95.3 | 103.3 | 122.1 | 119.7 | 112.2 | 110.8 | | E.2.2.2 IIP - Manufacture of beverages | 120.5 | 132.3 | 106.2 | 88.2 | 84.5 | 89.1 | 91.3 | 85.2 | 89.8 | 96.1 | 99.1 | 119.5 | | E.2.2.3 IIP - Manufacture of textiles | 97.6 | 99.1 | 98.5 | 101.0 | 102.7 | 101.5 | 101.7 | 98.5 | 100.9 | 101.0 | 96.0 | 101.5 | | E.2.2.4 IIP - Manufacture of chemicals and chemical products | 93.8 | 100.6 | 100.0 | 103.9 | 102.6 | 101.6 | 101.1 | 98.4 | 100.9 | 100.4 | 93.8 | 103.3 | | E.2.2.5 IIP - Manufacture of motor vehicles, trailers and semi-trailers | 99.1 | 101.0 | 97.5 | 99.9 | 98.7 | 101.3 | 100.2 | 100.7 | 93.9 | 99.7 | 100.6 | 107.8 | | E.2.3 IIP - Electricity | 100.1 | 105.0 | 99.8 | 102.1 | 101.7 | 99.0 | 102.4 | 95.3 | 98.3 | 99.8 | 92.9 | 102.9 | | E.3 Cement Production | 103.8 | 103.5 | 100.1 | 97.1 | 90.7 | 92.0 | 98.8 | 92.2 | 101.9 | 105.8 | 101.0 | 112.7 | | E.4 Steel Production | 98.4 | 104.1 | 98.9 | 100.1 | 99.1 | 96.9 | 98.9 | 95.6 | 100.2 | 104.1 | 98.1 | 105.3 | | E.5 Coal Production | 91.2 | 93.3 | 88.8 | 83.2 | 82.7 | 82.2 | 97.0 | 104.6 | 113.3 | 116.8 | 111.1 | 136.3 | | E.6 Crude Oil Production | 98.7 | 101.6 | 99.4 | 101.6 | 101.4 | 97.9 | 101.9 | 99.0 | 102.0 | 101.6 | 92.4 | 102.5 | | E.7 Petroleum Refinery Production | 96.0 | 100.6 | 99.3 | 101.0 | 100.6 | 95.5 | 101.8 | 98.3 | 103.6 | 103.0 | 95.5 | 105.0 | | E.8 Fertiliser Production | 81.9 | 95.5 | 98.9 | 105.0 | 106.2 | 104.5 | 107.8 | 104.8 | 105.8 | 102.4 | 93.3 | 93.9 | | E.9 Natural Gas Production | 97.6 | 101.7 | 98.8 | 102.4 | 101.6 | 98.7 | 102.5 | 99.7 | 102.3 | 101.5 | 91.3 | 101.9 | | Service Sector Indicators (6 series) | | F.1 Production of Commercial Motor Vehicles | 94.6 | 95.7 | 91.6 | 96.1 | 97.8 | 98.6 | 100.7 | 100.2 | 93.9 | 106.6 | 106.7 | 117.5 | | F.2 Cargo handled at Major Ports | 100.0 | 104.1 | 96.9 | 99.2 | 98.2 | 92.9 | 98.6 | 99.0 | 102.7 | 104.5 | 95.0 | 108.4 | | F.3 Railway Freight Traffic | 97.0 | 100.7 | 96.8 | 98.0 | 95.5 | 93.6 | 98.6 | 98.5 | 103.8 | 106.6 | 97.8 | 112.8 | | F.4 Sales of Commercial Motor Vehicles | 86.1 | 90.9 | 96.3 | 94.2 | 95.5 | 106.5 | 99.9 | 94.3 | 98.4 | 104.2 | 104.5 | 128.9 | | F.5 Passenger flown (Km) - Domestic | 101.0 | 111.6 | 103.2 | 96.6 | 94.4 | 89.9 | 98.7 | 99.9 | 107.5 | 102.8 | 95.8 | 98.8 | | F.6 Passenger flown (Km) - International | 96.1 | 101.8 | 100.5 | 104.9 | 103.7 | 93.3 | 93.4 | 95.3 | 105.9 | 109.6 | 94.1 | 101.8 | | Merchandise Trade (3 series) | | G.1 Exports | 97.8 | 100.6 | 99.5 | 99.1 | 97.0 | 101.4 | 98.5 | 94.5 | 102.2 | 99.2 | 97.0 | 113.8 | | G.2 Imports | 99.7 | 104.2 | 98.9 | 102.7 | 98.2 | 101.8 | 105.5 | 99.0 | 100.0 | 97.5 | 92.0 | 102.1 | | G.3 Non-Oil Non-Gold Imports | 95.9 | 99.2 | 100.8 | 102.6 | 98.6 | 101.1 | 104.5 | 102.0 | 104.3 | 99.6 | 92.5 | 98.6 | | Alternate modes of Payment (4 series) | | H.1 RTGS | 98.1 | 94.2 | 106.7 | 96.8 | 90.7 | 104.3 | 99.9 | 92.4 | 103.0 | 99.8 | 90.0 | 124.3 | | H.2 Paper Clearing | 104.7 | 99.3 | 96.3 | 100.2 | 95.9 | 94.7 | 105.5 | 93.3 | 99.3 | 99.4 | 94.2 | 117.0 | | H.3 REC | 105.3 | 98.0 | 97.8 | 103.2 | 95.9 | 97.1 | 104.3 | 89.4 | 100.6 | 98.3 | 90.4 | 121.5 | | H.4 Cards | 99.6 | 101.6 | 98.2 | 99.5 | 99.5 | 95.7 | 105.1 | 100.9 | 103.6 | 102.1 | 92.8 | 101.2 | *: Average of last ten years’ monthly seasonal factors, in general.
Note: 1. Seasonal factors: Deviation from 100 indicates presence of seasonality. For instance, seasonal factor of IIP-General Index increases during March (109.4) and decreases during April (96.6) indicating that industrial production rises during March and declines during April due to seasonal fluctuations.
2. For all CPI-Combined indices, the average monthly seasonal factors have been computed on the basis of last 7 years (i.e., April 2011 to March 2018).
3. The average linking factor has been used to compute the back series of IIP (Overall, mining, manufacturing and electricity) and WPI series. The average linking factor was calculated based on IIP/ WPI series for the common period from Apr 2012 to Mar 2017. The back series of IIP, however, was not compiled at further disaggregated level (use based and NIC-2 digit level) due to major changes in coverage.
4. Numbers marked in ‘bold’ are peaks and troughs of respective series. |
| Table 4: Range (Difference Between Peak and Trough) of Seasonal Factors | | Series \ Year | 2008-09 | 2009-10 | 2010-11 | 2011-12 | 2012-13 | 2013-14 | 2014-15 | 2015-16 | 2016-17 | 2017-18 | Range of Average SF | | 1 | 2 | 3 | 4 | 5 | 6 | 7 | 8 | 9 | 10 | 11 | 12 | | Monetary and Banking Indicators(13 series) | | A.1.1 Broad Money (M3) | 3.0 | 2.7 | 2.4 | 2.1 | 2.0 | 1.9 | 1.8 | 1.9 | 2.0 | 2.1 | 2.1 | | A.1.1.1 Net Bank Credit to Government | 5.3 | 5.1 | 4.7 | 4.2 | 3.9 | 3.7 | 3.6 | 3.7 | 3.8 | 4.0 | 4.2 | | A.1.1.2 Bank Credit to Commercial Sector | 3.9 | 3.7 | 3.4 | 3.0 | 2.6 | 2.5 | 2.6 | 2.6 | 2.7 | 2.7 | 2.8 | | A.1.2 Narrow Money (M1) | 6.0 | 5.4 | 4.7 | 4.0 | 3.3 | 4.1 | 5.3 | 6.7 | 7.9 | 8.8 | 5.0 | | A.1.3 Reserve Money (RM) | 6.6 | 6.7 | 6.7 | 6.5 | 6.3 | 6.1 | 5.8 | 5.6 | 5.3 | 5.2 | 6.1 | | A.1.3.1 Currency in Circulation | 6.6 | 6.3 | 5.9 | 5.6 | 5.3 | 5.1 | 5.0 | 4.9 | 4.9 | 5.0 | 5.5 | | A.2.1 Aggregate Deposits (SCBs) | 2.5 | 2.2 | 2.1 | 1.9 | 1.7 | 1.6 | 1.4 | 1.2 | 1.1 | 1.2 | 1.4 | | A.2.1.1 Demand Deposits (SCBs) | 14.3 | 13.0 | 11.0 | 8.5 | 6.0 | 5.4 | 6.3 | 8.1 | 10.0 | 11.5 | 8.4 | | A.2.1.2 Time Deposits (SCBs) | 2.2 | 2.3 | 2.2 | 2.0 | 1.6 | 1.4 | 1.1 | 0.9 | 0.9 | 0.9 | 1.4 | | A.3.1 Bank Credit (SCBs) | 4.3 | 4.2 | 3.9 | 3.4 | 3.1 | 2.9 | 2.7 | 2.7 | 2.9 | 3.0 | 3.2 | | A.3.1.1 Loans, Cash Credits and Overdrafts (SCBs) | 4.5 | 4.3 | 4.3 | 4.3 | 4.3 | 4.4 | 4.5 | 4.7 | 4.8 | 4.9 | 4.5 | | A.3.1.2 Non-Food Credit (SCBs) | 4.6 | 4.4 | 4.0 | 3.6 | 3.1 | 2.9 | 3.0 | 3.4 | 4.0 | 4.4 | 3.6 | | A.3.2 Investments (SCBs) | 4.5 | 4.7 | 4.8 | 4.6 | 4.4 | 4.1 | 3.8 | 3.7 | 3.7 | 3.8 | 4.2 | | Price Indices [ CPI: 21 series and WPI: 7 series ] | | B. CPI (Base: 2012 = 100) All Commodities | | | | 2.3 | 2.2 | 2.2 | 2.1 | 2.0 | 1.9 | 1.8 | 2.1 | | B.1 CPI - Food and beverages | | | | 4.2 | 4.2 | 4.2 | 4.2 | 4.3 | 4.3 | 4.3 | 4.2 | | B.1 .1 CPI - Cereals and products | | | | 1.0 | 0.9 | 0.8 | 0.7 | 0.7 | 0.7 | 0.7 | 0.7 | | B.1 .2 CPI - Meat and fish | | | | 3.1 | 3.1 | 3.2 | 3.2 | 3.3 | 3.4 | 3.4 | 3.2 | | B.1 .3 CPI – Egg | | | | 8.4 | 8.3 | 7.9 | 7.4 | 7.3 | 7.1 | 7.0 | 7.6 | | B.1 .4 CPI - Milk and products | | | | 0.9 | 0.8 | 0.8 | 0.7 | 0.6 | 0.6 | 0.6 | 0.7 | | B.1 .5 CPI - Fruits | | | | 6.4 | 6.4 | 6.3 | 6.2 | 5.9 | 5.7 | 5.5 | 6.1 | | B.1 .6 CPI - Vegetables | | | | 22.6 | 22.6 | 22.9 | 23.2 | 23.3 | 23.8 | 24.1 | 23.1 | | B.1 .6.1 CPI - Potato | | | | 36.5 | 36.3 | 35.9 | 35.7 | 35.6 | 36.0 | 36.2 | 35.9 | | B.1 .6.2 CPI - Onion | | | | 49.4 | 48.6 | 46.6 | 44.5 | 41.0 | 38.3 | 35.9 | 43.5 | | B.1 .6.3 CPI - Tomato | | | | 62.6 | 63.7 | 66.1 | 68.7 | 69.1 | 71.4 | 73.3 | 67.8 | | B.1 .7 CPI - Pulses and products | | | | 2.8 | 3.0 | 3.3 | 3.7 | 4.1 | 4.6 | 4.8 | 3.7 | | B.1 .8 CPI - Spices | | | | 1.8 | 1.7 | 1.5 | 1.2 | 1.1 | 1.1 | 1.1 | 1.3 | | B.1 .9 CPI - Non-alcoholic beverages | | | | 0.4 | 0.4 | 0.4 | 0.3 | 0.3 | 0.3 | 0.3 | 0.3 | | B.1 .10 CPI - Prepared meals, snacks, sweets etc. | | | | 0.7 | 0.7 | 0.6 | 0.6 | 0.6 | 0.5 | 0.5 | 0.6 | | B.2 CPI - Clothing and footwear | | | | 0.7 | 0.7 | 0.6 | 0.5 | 0.4 | 0.4 | 0.4 | 0.5 | | B.3 CPI - Housing | | | | 1.3 | 1.3 | 1.2 | 1.1 | 1.2 | 1.3 | 1.3 | 1.2 | | B.4 CPI - Miscellaneous | | | | 0.8 | 0.8 | 0.7 | 0.6 | 0.5 | 0.4 | 0.4 | 0.6 | | C.1 Consumer Price Index for Industrial Workers (Base: 2001=100) | 2.1 | 2.1 | 2.1 | 2.1 | 2.2 | 2.2 | 2.3 | 2.4 | 2.4 | 2.4 | 2.1 | | C.2 Consumer Price Index for Agricultural Labourers (Base: 1986-87=100) | 2.2 | 2.2 | 2.2 | 2.2 | 2.3 | 2.5 | 2.6 | 2.5 | 2.5 | 2.5 | 2.3 | | C.3 Consumer Price Index for Rural Labourers (Base: 1986-87=100) | 2.2 | 2.2 | 2.2 | 2.2 | 2.3 | 2.4 | 2.4 | 2.4 | 2.4 | 2.3 | 2.3 | | D. WPI (Base: 2011-12=100) All Commodities | 1.9 | 1.6 | 1.4 | 1.3 | 1.5 | 1.6 | 1.6 | 1.5 | 1.4 | 1.3 | 1.4 | | D.1 WPI - Primary Articles | 4.1 | 3.7 | 3.6 | 3.9 | 4.3 | 4.7 | 4.9 | 5.1 | 5.0 | 4.8 | 4.4 | | D.1.1 WPI - Food Articles | 6.0 | 5.9 | 5.8 | 5.7 | 5.7 | 5.7 | 6.1 | 6.4 | 6.5 | 6.5 | 5.9 | | D.2 WPI - Manufactured Products | 1.4 | 1.3 | 1.1 | 1.0 | 0.9 | 0.8 | 0.8 | 0.7 | 0.7 | 0.6 | 0.9 | | D.2.1 WPI - Manufacture of Food Products | 1.2 | 1.3 | 1.4 | 1.7 | 1.8 | 1.9 | 1.8 | 1.6 | 1.5 | 1.5 | 1.5 | | D.2.2 WPI - Manufacture of Chemicals & Chemical Products | 0.9 | 1.0 | 1.0 | 1.0 | 0.9 | 0.9 | 0.9 | 0.9 | 0.9 | 0.9 | 0.9 | | D.2.3 WPI - Manufacture of Basic Metals Alloys & Metals Products | 2.4 | 1.9 | 1.4 | 1.1 | 1.1 | 1.4 | 1.7 | 2.0 | 2.2 | 2.2 | 1.7 | | (Contd.) |
| Table 4: Range (Difference Between Peak and Trough) of Seasonal Factors | | Series \ Year | 2008-09 | 2009-10 | 2010-11 | 2011-12 | 2012-13 | 2013-14 | 2014-15 | 2015-16 | 2016-17 | 2017-18 | Range of Average SF | | 1 | 2 | 3 | 4 | 5 | 6 | 7 | 8 | 9 | 10 | 11 | 12 | | Index of Industrial Production (23 series) | | E. IIP (Base 2011-12 = 100) General Index | 14.2 | 14.4 | 14.4 | 14.0 | 13.3 | 12.6 | 12.5 | 12.4 | 12.4 | 12.5 | 12.7 | | E.1.1 IIP - Primary goods | | | | | 12.9 | 13.0 | 13.1 | 13.2 | 13.3 | 13.5 | 13.2 | | E.1.2 IIP - Capital goods | | | | | 39.4 | 39.6 | 40.0 | 40.0 | 40.1 | 40.3 | 39.9 | | E.1.3 IIP - Intermediate goods | | | | | 10.5 | 10.4 | 10.3 | 10.2 | 10.2 | 10.4 | 10.2 | | E.1.4 IIP - Infrastructure/ construction goods | | | | | 12.1 | 12.6 | 13.2 | 13.8 | 14.4 | 14.9 | 13.5 | | E.1.5 IIP - Consumer goods | | | | | 11.2 | 10.9 | 10.3 | 9.7 | 9.1 | 8.9 | 10.0 | | E.1.5.1 IIP - Consumer durables | | | | | 14.2 | 14.0 | 13.6 | 12.9 | 12.1 | 11.6 | 13.1 | | E.1.5.2 IIP - Consumer non-durables | | | | | 14.2 | 13.8 | 12.9 | 12.6 | 12.4 | 12.7 | 12.7 | | E.2.1 IIP - Mining | 26.1 | 27.0 | 27.9 | 28.8 | 29.5 | 30.2 | 30.7 | 31.2 | 31.4 | 32.0 | 29.5 | | E.2.2 IIP - Manufacturing | 13.4 | 12.9 | 12.6 | 12.2 | 12.0 | 12.1 | 12.1 | 12.2 | 12.0 | 12.1 | 12.3 | | E.2.2.1 IIP - Manufacture of food products | | | | | 36.5 | 36.5 | 36.0 | 35.7 | 35.3 | 35.2 | 35.9 | | E.2.2.2 IIP - Manufacture of beverages | | | | | 53.9 | 52.7 | 50.2 | 46.6 | 43.0 | 40.4 | 47.8 | | E.2.2.3 IIP - Manufacture of textiles | | | | | 8.9 | 8.5 | 7.5 | 6.3 | 5.0 | 4.7 | 6.7 | | E.2.2.4 IIP - Manufacture of chemicals and chemical products | | | | | 11.1 | 10.9 | 10.6 | 10.0 | 10.0 | 10.1 | 10.1 | | E.2.2.5 IIP - Manufacture of motor vehicles, trailers and semi-trailers | | | | | 13.0 | 13.3 | 13.7 | 14.2 | 14.5 | 14.7 | 13.9 | | E.2.3 IIP - Electricity | 10.7 | 11.2 | 11.2 | 10.6 | 11.4 | 12.2 | 13.3 | 14.1 | 14.8 | 15.2 | 12.1 | | E.3 Cement Production | 22.0 | 22.9 | 23.3 | 23.9 | 23.6 | 23.2 | 21.9 | 20.8 | 19.8 | 19.4 | 22.0 | | E.4 Steel Production | 10.7 | 10.7 | 10.3 | 9.9 | 10.0 | 10.2 | 9.9 | 9.2 | 9.3 | 9.6 | 9.7 | | E.5 Coal Production | 51.5 | 53.3 | 54.5 | 55.0 | 54.8 | 54.1 | 54.1 | 54.7 | 55.9 | 56.8 | 54.0 | | E.6 Crude Oil Production | 10.1 | 10.2 | 10.2 | 10.3 | 10.2 | 10.2 | 10.1 | 10.1 | 9.9 | 9.9 | 10.1 | | E.7 Petroleum Refinery Production | 8.7 | 9.1 | 9.4 | 10.1 | 10.6 | 10.8 | 10.4 | 9.7 | 9.4 | 9.5 | 9.5 | | E.8 Fertiliser Production | 26.3 | 25.6 | 26.2 | 26.8 | 27.3 | 27.3 | 26.7 | 25.4 | 24.2 | 23.5 | 25.8 | | E.9 Natural Gas Production | 12.0 | 11.4 | 11.1 | 10.9 | 11.0 | 11.3 | 11.3 | 11.8 | 12.0 | 12.1 | 11.2 | | Service Sector Indicators (6 series) | | F.1 Production of Commercial Motor Vehicles | 28.9 | 29.2 | 28.8 | 27.5 | 25.8 | 24.5 | 23.9 | 25.2 | 25.8 | 26.4 | 25.8 | | F.2 Cargo handled at Major Ports | 17.2 | 16.6 | 15.9 | 15.2 | 14.8 | 14.6 | 14.8 | 15.2 | 15.4 | 15.4 | 15.5 | | F.3 Railway Freight Traffic | 21.4 | 21.1 | 20.6 | 20.1 | 19.3 | 18.6 | 18.0 | 17.8 | 17.7 | 18.0 | 19.3 | | F.4 Sales of Commercial Motor Vehicles | 45.2 | 43.3 | 41.9 | 40.9 | 40.7 | 41.3 | 42.0 | 43.0 | 44.2 | 45.4 | 42.8 | | F.5 Passenger flown (Km) - Domestic | 23.9 | 25.3 | 25.8 | 25.7 | 24.2 | 22.2 | 19.8 | 17.9 | 16.6 | 15.9 | 21.7 | | F.6 Passenger flown (Km) - International | 17.1 | 16.9 | 15.3 | 15.4 | 16.7 | 17.9 | 18.3 | 18.1 | 17.3 | 16.7 | 16.3 | | Merchandise Trade (3 series) | | G.1 Exports | 19.5 | 19.8 | 20.9 | 21.3 | 20.8 | 19.8 | 18.5 | 17.6 | 17.1 | 17.5 | 19.3 | | G.2 Imports | 20.5 | 17.5 | 14.9 | 13.2 | 12.0 | 11.9 | 12.6 | 13.0 | 12.7 | 11.8 | 13.6 | | G.3 Non-Oil Non-Gold Imports | 16.0 | 14.5 | 13.4 | 12.4 | 11.5 | 11.7 | 12.3 | 12.7 | 12.9 | 12.8 | 12.0 | | Alternate modes of Payment (4 series) | | H.1 RTGS | 16.8 | 20.9 | 27.3 | 35.1 | 40.2 | 42.4 | 43.6 | 43.5 | 41.3 | 39.6 | 34.3 | | H.2 Paper Clearing | 23.9 | 24.4 | 25.1 | 25.4 | 24.9 | 24.1 | 23.2 | 22.5 | 21.9 | 21.7 | 23.7 | | H.3 REC | 23.2 | 23.9 | 27.0 | 31.6 | 35.3 | 36.8 | 37.8 | 38.4 | 38.5 | 38.6 | 32.1 | | H.4 Cards | 12.0 | 13.5 | 14.3 | 13.8 | 13.0 | 12.0 | 11.5 | 11.2 | 10.9 | 10.8 | 12.3 | Note: 1. Seasonal adjustment for these series is based on 10 years’ data depending on availability. Guidelines of both the Office of National Statistics (ONS), UK, and the US Census Bureau, however, suggest using more than ten years’ data for estimating stable monthly seasonal factors.
2. Average seasonal factor range is the range of average seasonal factors for last ten years; range is calculated as the difference between maximum and minimum of monthly seasonal factors. |
| Table 5: Change in Seasonal Peaks and Troughs in 2017-18 vis-à-vis previous 5-years (2012-13 to 2016-17) | | Series | Based on SF of 2012-13 to 2016-17 | Based on SF of 2017-18 | | Peak Month | Peak Value | Trough Month | Trough Value | Peak Month | Peak Value | Trough Month | Trough Value | | Monetary and Banking Indicators(13 series) | | A.1.1 Broad Money (M3) | Apr | 101.2 | Sep | 99.3 | Apr | 101.3 | Jan | 99.1 | | A.1.1.1 Net Bank Credit to Government | Jul | 101.7 | Dec | 98.0 | Aug | 101.6 | Dec | 97.6 | | A.1.1.2 Bank Credit to Commercial Sector | Mar | 101.5 | Sep | 98.9 | Mar | 101.5 | Sep | 98.8 | | A.1.2 Narrow Money (M1) | Apr | 102.4 | Jan | 96.9 | Apr | 103.5 | Jan | 94.7 | | A.1.3 Reserve Money (RM) | Mar | 104.2 | Sep | 98.4 | Mar | 103.7 | Sep | 98.6 | | A.1.3.1 Currency in Circulation | May | 103.1 | Sep | 98.1 | May | 103.2 | Sep | 98.2 | | A.2.1 Aggregate Deposits (SCBs) | Apr | 101.0 | Jan | 99.3 | Apr | 101.0 | Jan | 99.1 | | A.2.1.1 Demand Deposits (SCBs) | Mar | 104.9 | Aug | 97.8 | Mar | 107.7 | Aug | 96.2 | | A.2.1.2 Time Deposits (SCBs) | Apr | 100.7 | Feb | 99.6 | Oct | 100.5 | Aug | 99.5 | | A.3.1 Bank Credit (SCBs) | Mar | 101.8 | Sep | 99.0 | Mar | 102.0 | Nov | 98.9 | | A.3.1.1 Loans, Cash Credits and Overdrafts (SCBs) | Mar | 103.3 | Nov | 98.8 | Mar | 103.5 | Nov | 98.6 | | A.3.1.2 Non-Food Credit (SCBs) | Mar | 102.0 | Nov | 98.9 | Mar | 102.5 | Nov | 98.7 | | A.3.3 Investments (SCBs) | Aug | 101.5 | Mar | 97.5 | Aug | 101.1 | Mar | 97.3 | | Price Indices [ CPI: 21 series and WPI: 7 series ] | | B. CPI (Base: 2012 = 100) All Commodities | Oct | 101.0 | Mar | 99.0 | Aug | 100.9 | Mar | 99.1 | | B.1 CPI - Food and beverages | Oct | 101.9 | Mar | 97.7 | Aug | 102.0 | Mar | 97.7 | | B.1 .1 CPI - Cereals and products | Nov | 100.3 | May | 99.5 | Jan | 100.3 | May | 99.6 | | B.1 .2 CPI - Meat and fish | Jul | 101.9 | Nov | 98.7 | Jul | 102.3 | Dec | 98.9 | | B.1 .3 CPI - Egg | Jan | 104.2 | May | 96.7 | Jan | 103.7 | Apr | 96.7 | | B.1 .4 CPI - Milk and products | Nov | 100.3 | Apr | 99.6 | Oct | 100.3 | Mar | 99.7 | | B.1 .5 CPI - Fruits | Jul | 103.2 | Feb | 97.1 | Jul | 102.6 | Feb | 97.1 | | B.1 .6 CPI - Vegetables | Aug | 111.1 | Mar | 88.0 | Aug | 111.8 | Mar | 87.7 | | B.1 .6.1 CPI - Potato | Nov | 115.5 | Feb | 79.7 | Nov | 115.8 | Feb | 79.7 | | B.1 .6.2 CPI - Onion | Nov | 121.8 | May | 78.0 | Nov | 118.1 | May | 82.1 | | B.1 .6.3 CPI - Tomato | Jul | 139.4 | Feb | 71.6 | Jul | 144.1 | Mar | 70.9 | | B.1 .7 CPI - Pulses and products | Nov | 101.9 | Apr | 98.2 | Nov | 102.4 | Apr | 97.6 | | B.1 .8 CPI - Spices | Dec | 100.5 | Apr | 99.2 | Dec | 100.6 | Jun | 99.5 | | B.1 .9 CPI - Non-alcoholic beverages | Sep | 100.1 | Mar | 99.8 | Sep | 100.2 | Apr | 99.9 | | B.1 .10 CPI - Prepared meals, snacks, sweets etc. | Nov | 100.3 | May | 99.7 | Nov | 100.3 | May | 99.7 | | B.2 CPI - Clothing and footwear | Dec | 100.3 | May | 99.8 | Oct | 100.2 | Jun | 99.8 | | B.3 CPI - Housing | Jan | 100.4 | Jun | 99.2 | Nov | 100.4 | Jun | 99.1 | | B.4 CPI - Miscellaneous | Sep | 100.3 | Apr | 99.7 | Oct | 100.2 | Apr | 99.8 | | C.1 Consumer Price Index for Industrial Workers (Base: 2001=100) | Jul | 101.1 | Mar | 98.8 | Jul | 101.2 | Mar | 98.8 | | C.2 Consumer Price Index for Agricultural Labourers (Base: 1986-87=100) | Oct | 101.2 | Mar | 98.7 | Nov | 101.2 | Mar | 98.7 | | C.3 Consumer Price Index for Rural Labourers (Base: 1986-87=100) | Oct | 101.1 | Mar | 98.7 | Nov | 101.1 | Mar | 98.7 | | D. WPI (Base: 2011-12=100) All Commodities | Sep | 100.7 | Feb | 99.2 | Jul | 100.7 | Mar | 99.4 | | D.1 WPI - PRIMARY ARTICLES | Aug | 102.3 | Mar | 97.5 | Aug | 102.1 | Mar | 97.3 | | D.1.1 WPI - Food Articles | Aug | 102.4 | Mar | 96.5 | Aug | 102.5 | Mar | 96.0 | | D.2 WPI - MANUFACTURED PRODUCTS | May | 100.3 | Dec | 99.5 | May | 100.3 | Dec | 99.6 | | D.2.1 WPI - Manufacture of Food Products | Sep | 100.7 | Mar | 99.0 | Sep | 100.7 | Mar | 99.2 | | D.2.2 WPI - Manufacture of Chemicals & Chemical Products | May | 100.4 | Dec | 99.6 | May | 100.5 | Dec | 99.6 | | D.2.3 WPI - Manufacture of Basic Metals Alloys & Metals Products | Apr | 100.8 | Dec | 99.2 | Mar | 101.2 | Aug | 99.1 | | (Contd.) |
| Table 5: Change in Seasonal Peaks and Troughs in 2017-18 vis-à-vis previous 5-years (2012-13 to 2016-17) | | Series | Based on SF of 2012-13 to 2016-17 | Based on SF of 2017-18 | | Peak Month | Peak Value | Trough Month | Trough Value | Peak Month | Peak Value | Trough Month | Trough Value | | Industrial Production (23 series) | | E. IIP (Base 2011-12 = 100) General Index | Mar | 109.1 | Apr | 96.6 | Mar | 108.7 | Apr | 96.2 | | E.1.1 IIP - Primary goods | Mar | 108.2 | Sep | 95.1 | Mar | 108.8 | Sep | 95.3 | | E.1.2 IIP - Capital goods | Mar | 128.7 | Apr | 88.9 | Mar | 129.3 | Apr | 89.0 | | E.1.3 IIP - Intermediate goods | Mar | 107.1 | Feb | 96.8 | Mar | 107.7 | Apr | 97.3 | | E.1.4 IIP - Infrastructure/ construction goods | Mar | 106.3 | Nov | 93.1 | Mar | 107.5 | Nov | 92.6 | | E.1.5 IIP - Consumer goods | Mar | 105.7 | Apr | 95.4 | Mar | 104.0 | Apr | 95.1 | | E.1.5.1 IIP - Consumer durables | Oct | 108.6 | Apr | 95.2 | Oct | 107.6 | Apr | 96.0 | | E.1.5.2 IIP - Consumer non-durables | Dec | 108.0 | Apr | 95.2 | Jan | 106.9 | Apr | 94.1 | | E.2.1 IIP - Mining | Mar | 119.6 | Sep | 89.0 | Mar | 121.0 | Aug | 89.0 | | E.2.2 IIP - Manufacturing | Mar | 108.1 | Apr | 96.0 | Mar | 107.6 | Apr | 95.6 | | E.2.2.1 IIP - Manufacture of food products | Dec | 122.1 | Jun | 86.1 | Dec | 121.9 | Jun | 86.7 | | E.2.2.2 IIP - Manufacture of beverages | May | 133.2 | Aug | 83.8 | May | 127.8 | Nov | 87.4 | | E.2.2.3 IIP - Manufacture of textiles | Aug | 103.0 | Feb | 95.7 | Mar | 101.7 | Feb | 97.0 | | E.2.2.4 IIP - Manufacture of chemicals and chemical products | Jul | 104.1 | Apr | 93.7 | Mar | 104.5 | Feb | 94.4 | | E.2.2.5 IIP - Manufacture of motor vehicles, trailers and semi-trailers | Mar | 107.7 | Dec | 94.0 | Mar | 108.6 | Dec | 93.9 | | E.2.3 IIP - Electricity | May | 105.5 | Feb | 92.3 | May | 106.1 | Feb | 90.9 | | E.3 Cement Production | Mar | 112.2 | Aug | 90.4 | Mar | 110.8 | Aug | 91.4 | | E.4 Steel Production | May | 105.5 | Nov | 96.0 | Mar | 105.8 | Nov | 96.2 | | E.5 Coal Production | Mar | 136.4 | Aug | 82.1 | Mar | 138.0 | Jul | 81.1 | | E.6 Crude Oil Production | Mar | 102.5 | Feb | 92.4 | Mar | 102.5 | Feb | 92.6 | | E.7 Petroleum Refinery Production | Mar | 105.0 | Sep | 94.8 | Mar | 104.7 | Feb | 95.1 | | E.8 Fertiliser Production | Oct | 108.2 | Apr | 82.0 | Oct | 106.9 | Apr | 83.5 | | E.9 Natural Gas Production | Oct | 102.5 | Feb | 91.3 | Oct | 103.2 | Feb | 91.1 | | Service Sector Indicators (6 series) | | F.1 Production of Commercial Motor Vehicles | Mar | 116.6 | Dec | 92.6 | Mar | 118.8 | Dec | 92.4 | | F.2 Cargo handled at Major Ports | Mar | 108.4 | Sep | 93.4 | Mar | 108.8 | Sep | 93.3 | | F.3 Railway Freight Traffic | Mar | 112.2 | Sep | 93.9 | Mar | 112.5 | Sep | 94.5 | | F.4 Sales of Commercial Motor Vehicles | Mar | 129.3 | Apr | 87.0 | Mar | 130.7 | Apr | 85.3 | | F.5 Passenger flown (Km) - Domestic | May | 110.7 | Sep | 90.6 | May | 109.3 | Sep | 93.4 | | F.6 Passenger flown (Km) - International | Jan | 110.5 | Sep | 92.9 | Jan | 110.4 | Sep | 93.7 | | Merchandise Trade (3 series) | | G.1 Exports | Mar | 113.5 | Nov | 94.7 | Mar | 113.9 | Nov | 96.4 | | G.2 Imports | Oct | 105.0 | Feb | 93.1 | Mar | 105.2 | Feb | 93.4 | | G.3 Non-Oil Non-Gold Imports | Dec | 104.5 | Feb | 92.5 | Dec | 104.9 | Feb | 92.2 | | Alternate modes of Payment (4 series) | | H.1 RTGS | Mar | 130.5 | Feb | 88.7 | Mar | 128.0 | Feb | 88.4 | | H.2 Paper Clearing | Mar | 116.6 | Nov | 93.3 | Mar | 115.3 | Nov | 93.6 | | H.3 REC | Mar | 126.4 | Nov | 89.1 | Mar | 129.4 | Nov | 90.8 | | H.4 Cards | Oct | 104.3 | Feb | 92.6 | Oct | 104.1 | Feb | 93.3 |
| Table 6: Change in Seasonal Variation in 2017-18 vis-à-vis previous 5-years (2012-13 to 2016-17) | | Name of Variable | 2017-18 | Average Range* | Change | | 1 | 2 | 3 | 4 | | Monetary and Banking Indicators (13 series) | | A.1.1 Broad Money (M3) | 2.1 | 1.8 | 0.3 | | A.1.1.1 Net Bank Credit to Government | 4.0 | 3.7 | 0.2 | | A.1.1.2 Bank Credit to Commercial Sector | 2.7 | 2.6 | 0.1 | | A.1.2 Narrow Money (M1) | 8.8 | 5.5 | 3.4 | | A.1.3 Reserve Money (RM) | 5.2 | 5.8 | -0.7 | | A.1.3.1 Currency in Circulation | 5.0 | 5.0 | -0.1 | | A.2.1 Aggregate Deposits (SCBs) | 1.2 | 1.4 | -0.2 | | A.2.1.1 Demand Deposits (SCBs) | 11.5 | 7.1 | 4.5 | | A.2.1.2 Time Deposits (SCBs) | 0.9 | 1.1 | -0.2 | | A.3.1 Bank Credit (SCBs) | 3.0 | 2.8 | 0.2 | | A.3.1.1 Loans, Cash Credits and Overdrafts (SCBs) | 4.9 | 4.5 | 0.4 | | A.3.1.2 Non-Food Credit (SCBs) | 4.4 | 3.3 | 1.2 | | A.3.2 Investments (SCBs) | 3.8 | 3.9 | -0.1 | | Price Indices[CPI: 21 series and WPI: 7 series] | | B.CPI (Base: 2012 = 100) All Commodities | 1.8 | 2.1 | -0.2 | | B.1 CPI - Food and beverages | 4.3 | 4.2 | 0.1 | | B.1 .1 CPI - Cereals and products | 0.7 | 0.7 | 0.0 | | B.1 .2 CPI - Meat and fish | 3.4 | 3.2 | 0.2 | | B.1 .3 CPI - Egg | 7.0 | 7.5 | -0.5 | | B.1 .4 CPI - Milk and products | 0.6 | 0.7 | -0.1 | | B.1 .5 CPI - Fruits | 5.5 | 6.1 | -0.6 | | B.1 .6 CPI - Vegetables | 24.1 | 23.2 | 0.9 | | B.1 .6.1 CPI - Potato | 36.2 | 35.8 | 0.3 | | B.1 .6.2 CPI - Onion | 35.9 | 43.8 | -7.9 | | B.1 .6.3 CPI - Tomato | 73.3 | 67.8 | 5.5 | | B.1 .7 CPI - Pulses and products | 4.8 | 3.7 | 1.1 | | B.1 .8 CPI - Spices | 1.1 | 1.3 | -0.2 | | B.1 .9 CPI - Non-alcoholic beverages | 0.3 | 0.3 | -0.1 | | B.1. 10 CPI - Prepared meals, snacks, sweets etc. | 0.5 | 0.6 | -0.1 | | B.2 CPI - Clothing and footwear | 0.4 | 0.5 | -0.1 | | B.3 CPI - Housing | 1.3 | 1.2 | 0.1 | | B.4 CPI - Miscellaneous | 0.4 | 0.6 | -0.3 | | C.1 Consumer Price Index for Industrial Workers(Base: 2001=100) | 2.4 | 2.3 | 0.1 | | C.2 Consumer Price Index for Agricultural Labourers (Base: 1986-87=100) | 2.5 | 2.5 | 0.0 | | C.3 Consumer Price Index for Rural Labourers (Base: 1986-87=100) | 2.3 | 2.4 | 0.0 | | D. WPI (Base: 2011-12=100) All Commodities | 1.3 | 1.5 | -0.2 | | D.1 WPI - Primary Articles | 4.8 | 4.8 | 0.1 | | D.1.1 WPI - Food Articles | 6.5 | 6.0 | 0.5 | | D.2 WPI - Manufactured Products | 0.6 | 0.7 | -0.1 | | D.2.1 WPI - Manufacture of Food Products | 1.5 | 1.7 | -0.2 | | D.2.2 WPI - Manufacture of Chemicals & Chemical Products | 0.9 | 0.9 | 0.0 | | D.2.3 WPI - Manufacture of Basic Metals Alloys & Metals Products | 2.2 | 1.7 | 0.5 | | *Average Range of Monthly Seasonal Factors of 5 year ending 2016-17 |
| Table 6: Change in Seasonal Variation in 2017-18 vis-à-vis previous 5-years (2012-13 to 2016-17) | | Name of Variable | 2017-18 | Average Range* | Change | | 1 | 2 | 3 | 4 | | Index of Industrial Production (23 series) | | E. IIP (Base 2011-12 = 100) General Index | 12.5 | 12.5 | 0.0 | | E.1.1 IIP - Primary goods | 13.5 | 13.1 | 0.4 | | E.1.2 IIP - Capital goods | 40.3 | 39.8 | 0.5 | | E.1.3 IIP - Intermediate goods | 10.4 | 10.3 | 0.1 | | E.1.4 IIP - Infrastructure/ construction goods | 14.9 | 13.2 | 1.7 | | E.1.5 IIP - Consumer goods | 8.9 | 10.3 | -1.4 | | E.1.5.1 IIP - Consumer durables | 11.6 | 13.4 | -1.8 | | E.1.5.2 IIP - Consumer non-durables | 12.7 | 12.8 | -0.1 | | E.2.1 IIP - Mining | 32.0 | 30.6 | 1.3 | | E.2.2 IIP - Manufacturing | 12.1 | 12.1 | 0.0 | | E.2.2.1 IIP - Manufacture of food products | 35.2 | 36.0 | -0.8 | | E.2.2.2 IIP - Manufacture of beverages | 40.4 | 49.3 | -8.9 | | E.2.2.3 IIP - Manufacture of textiles | 4.7 | 7.2 | -2.5 | | E.2.2.4 IIP - Manufacture of chemicals and chemical products | 10.1 | 10.4 | -0.3 | | E.2.2.5 IIP - Manufacture of motor vehicles, trailers and semi-trailers | 14.7 | 13.7 | 1.0 | | E.2.3 IIP - Electricity | 15.2 | 13.1 | 2.0 | | E.3 Cement Production | 19.4 | 21.9 | -2.5 | | E.4 Steel Production | 9.6 | 9.5 | 0.1 | | E.5 Coal Production | 56.8 | 54.4 | 2.5 | | E.6 Crude Oil Production | 9.9 | 10.1 | -0.2 | | E.7 Petroleum Refinery Production | 9.5 | 10.2 | -0.6 | | E.8 Fertiliser Production | 23.5 | 26.2 | -2.7 | | E.9 Natural Gas Production | 12.1 | 11.2 | 0.9 | | Service sector Indicators (6 series) | | F.1 Production of Commercial Motor Vehicles | 26.4 | 24.0 | 2.4 | | F.2 Cargo handled at Major Ports | 15.4 | 15.0 | 0.5 | | F.3 Railway Freight Traffic | 18.0 | 18.3 | -0.3 | | F.4 Sales of Commercial Motor Vehicles | 45.4 | 42.2 | 3.2 | | F.5 Passenger flown (Km) - Domestic | 15.9 | 20.1 | -4.2 | | F.6 Passenger flown (Km) - International | 16.7 | 17.7 | -0.9 | | Merchandise Trade (3 series) | | G.1 Exports | 17.5 | 18.7 | -1.2 | | G.2 Imports | 11.8 | 11.9 | -0.1 | | G.3 Non-Oil Non-Gold Imports | 12.8 | 12.1 | 0.7 | | Alternate modes of Payment (4 series) | | H.1 RTGS | 39.6 | 41.8 | -2.2 | | H.2 Paper Clearing | 21.7 | 23.3 | -1.6 | | H.3 REC | 38.6 | 37.3 | 1.2 | | H.4 Cards | 10.8 | 11.7 | -0.9 | | *Average Range of Monthly Seasonal Factors of 5 year ending 2016-17 |
| Table 7: Regression Estimates | | Name of Variable | Coefficient Estimate* | p-value$ | | Monetary and Banking Indicators (13 series) | | A.1.1 Broad Money (M3) | -0.092 | 0.008 | | A.1.1.1 Net Bank Credit to Government | -0.173 | 0.003 | | A.1.1.2 Bank Credit to Commercial Sector | -0.137 | 0.003 | | A.1.2 Narrow Money (M1) | 0.351 | 0.065 | | A.1.3 Reserve Money (RM) | -0.184 | 0.000 | | A.1.3.1 Currency in Circulation | -0.190 | 0.000 | | A.2.1 Aggregate Deposits (SCBs) | -0.065 | 0.025 | | A.2.1.1 Demand Deposits (SCBs) | -0.412 | 0.243 | | A.2.1.2 Time Deposits (SCBs) | -0.184 | 0.000 | | A.3.1 Bank Credit (SCBs) | -0.176 | 0.001 | | A.3.1.1 Loans, Cash Credits and Overdrafts (SCBs) | 0.058 | 0.010 | | A.3.1.2 Non-Food Credit (SCBs) | -0.117 | 0.080 | | A.3.2 Investments (SCBs) | -0.128 | 0.000 | | Price Indices[CPI: 21 series and WPI: 7 series] | | B. CPI (Base: 2012 = 100) All Commodities | 0.073 | 0.430 | | B.1 CPI - Food and beverages | 0.285 | 0.143 | | B.1.1 CPI - Cereals and products | 0.009 | 0.822 | | B.1.2 CPI - Meat and fish | 0.263 | 0.072 | | B.1.3 CPI - Egg | 0.074 | 0.713 | | B.1.4 CPI - Milk and products | -0.006 | 0.845 | | B.1.5 CPI - Fruits | 0.310 | 0.304 | | B.1.6 CPI - Vegetables | 1.706 | 0.087 | | B.1.6.1 CPI - Potato | 2.365 | 0.142 | | B.1.6.2 CPI - Onion | 0.084 | 0.955 | | B.1.6.3 CPI - Tomato | 6.126 | 0.050 | | B.1.7 CPI - Pulses and products | 0.453 | 0.000 | | B.1.8 CPI - Spices | -0.052 | 0.323 | | B.1.9 CPI - Non-alcoholic beverages | 0.001 | 0.899 | | B.1.10 CPI - Prepared meals, snacks, sweets etc. | -0.014 | 0.590 | | B.2 CPI - Clothing and footwear | -0.020 | 0.375 | | B.3 CPI - Housing | 0.060 | 0.170 | | B.4 CPI - Miscellaneous | -0.034 | 0.229 | | C.1 Consumer Price Index for Industrial Workers (Base: 2001=100) | 0.042 | 0.000 | | C.2 Consumer Price Index for Agricultural Labourers (Base: 1986-87=100) | 0.047 | 0.001 | | C.3 Consumer Price Index for Rural Labourers (Base: 1986-87=100) | 0.033 | 0.002 | | D. WPI (Base: 2011-12=100) All Commodities | -0.033 | 0.094 | | D.1 WPI - PRIMARY ARTICLES | 0.161 | 0.001 | | D.1.1 WPI - Food Articles | 0.078 | 0.017 | | D.2 WPI - MANUFACTURED PRODUCTS | -0.084 | 0.000 | | D.2.1 WPI - Manufacture of Food Products | 0.038 | 0.171 | | D.2.2 WPI - Manufacture of Chemicals & Chemical Products | -0.013 | 0.031 | | D.2.3 WPI - Manufacture of Basic Metals Alloys & Metals Products | 0.030 | 0.601 | *: A series is found to have moderation (rise) in seasonal fluctuation if the coefficient is statistically significant at 5 per cent level of significance with ‘-‘ve sign (‘+’ve sign). However, seasonal fluctuation of a series is unchanged if corresponding coefficient is not statistically significant at 5 per cent level of significance.
$: p-value is also known as observed level of significance. A coefficient is found to be statistically significant at 5 per cent level of significance if its p-value is less than or equal to 0.05. |
| Table 7: Regression Estimates | | Name of Variable | Coefficient Estimate* | p-value$ | | Index of Industrial Production (23 series) | | E. IIP (Base 2011-12 = 100) General Index | -0.266 | 0.000 | | E.1.1 IIP - Primary goods | 0.118 | 0.001 | | E.1.2 IIP - Capital goods | 0.175 | 0.001 | | E.1.3 IIP - Intermediate goods | -0.038 | 0.243 | | E.1.4 IIP - Infrastructure/ construction goods | 0.565 | 0.000 | | E.1.5 IIP - Consumer goods | -0.512 | 0.000 | | E.1.5.1 IIP - Consumer durables | -0.556 | 0.000 | | E.1.5.2 IIP - Consumer non-durables | -0.349 | 0.024 | | E.2.1 IIP - Mining | 0.648 | 0.000 | | E.2.2 IIP - Manufacturing | -0.126 | 0.005 | | E.2.2.1 IIP - Manufacture of food products | -0.301 | 0.000 | | E.2.2.2 IIP - Manufacture of beverages | -2.871 | 0.000 | | E.2.2.3 IIP - Manufacture of textiles | -0.923 | 0.000 | | E.2.2.4 IIP - Manufacture of chemicals and chemical products | -0.243 | 0.011 | | E.2.2.5 IIP - Manufacture of motor vehicles, trailers and semi-trailers | 0.367 | 0.000 | | E.2.3 IIP - Electricity | 0.536 | 0.000 | | E.3 Cement Production | -0.387 | 0.016 | | E.4 Steel Production | -0.156 | 0.001 | | E.5 Coal Production | 0.391 | 0.004 | | E.6 Crude Oil Production | -0.028 | 0.044 | | E.7 Petroleum Refinery Production | 0.076 | 0.348 | | E.8 Fertiliser Production | -0.240 | 0.089 | | E.9 Natural Gas Production | 0.061 | 0.227 | | Service sector Indicators (6 series) | | F.1 Production of Commercial Motor Vehicles | -0.466 | 0.014 | | F.2 Cargo handled at Major Ports | -0.180 | 0.041 | | F.3 Railway Freight Traffic | -0.465 | 0.000 | | F.4 Sales of Commercial Motor Vehicles | 0.104 | 0.613 | | F.5 Passenger flown (Km) - Domestic | -1.162 | 0.000 | | F.6 Passenger flown (Km) - International | 0.139 | 0.232 | | Merchandise Trade (3 series) | | G.1 Exports | -0.382 | 0.011 | | G.2 Imports | -0.748 | 0.007 | | G.3 Non-Oil Non-Gold Imports | -0.267 | 0.068 | | Alternate Modes of Payments ( 4 series) | | H.1 RTGS | 2.769 | 0.002 | | H.2 Paper Clearing | -0.356 | 0.005 | | H.3 REC | 1.927 | 0.000 | | H.4 Cards | -0.316 | 0.010 | *: A series is found to have moderation (rise) in seasonal fluctuation if the coefficient is statistically significant at 5 per cent level of significance with ‘-‘ve sign (‘+’ve sign). However, seasonal fluctuation of a series is unchanged if corresponding coefficient is not statistically significant at 5 per cent level of significance.
$: p-value is also known as observed level of significance. A coefficient is found to be statistically significant at 5 per cent level of significance if its p-value is less than or equal to 0.05. |
|