Recent releases in national accounts confirms a moderation of pace in the Indian economy during 2018-19. A marked deceleration in government expenditure and burgeoning imports appear to have weighed down on gross domestic product (GDP) growth during the year, despite green shoots of revival in fixed investment and continued robustness in private consumption. While manufacturing extended the recovery that commenced in the second half of 2017-18, agriculture and services shed some momentum. Introduction The Central Statistics Office (CSO) released its second advance estimates (SAE) of national income for 2018-19 on February 28, 20191. Earlier, i.e., on January 31, 2019, it had issued the first revised estimates (FRE) of national accounts aggregates for 2017-18. This article situates these new releases against the backdrop of the backcasted data that are now available. The motivation is to discern underlying performance of the Indian economy in the aftermath of the global financial crisis (GFC) from the heat and dust stirred up in public discourse at the time of release. It may be noted that SAE for 2018-19 are juxtaposed with FRE for 2017-18, second revised estimates (SRE) and third revised estimates (TRE), for 2016-17 and 2015-16, respectively, and final accounts for the preceding years (Annex I). Without pre-empting the rest of the article, the analysis presented in it reveals that ‘V shaped’ recovery post the GFC could not be sustained beyond 2010-11 as fiscal and monetary stimulus wore off. Although GDP growth plummeted in 2011-12, it regained poise and accelerated in each of the ensuing years up to 2016-17. More recently, however, growth appears to have lost momentum. The remainder of article is organised along the following lines. Section II presents the overall trends, followed by sector-wise supply side analysis in Section III and an assessment of components of aggregate demand in Section IV. The saving-investment balance is analysed in Section V. Cross country analysis is covered in Section VI. Section VII concludes the article with some policy perspectives. II. Broad Trends In the years following the infamous taper tantrum in the summer of 2013, India emerged as the fastest growing large economy in the world. With the SAE for 2018-19 placing real GDP growth at 7.0 per cent, the average growth of the economy in the last five years (2014-15 to 2018-19) rose to 7.5 per cent2 from 6.7 per cent in the immediately preceding quinquennium that coincided with recovery from the GFC (Chart 1). Correspondingly from the supply side, the quinquennial growth rate of real gross value added at basic prices (GVA) was 7.4 per cent and 6.3 per cent, respectively, taking into account the estimate for 2018-19 at 6.8 per cent. However, both GDP and GVA appear to have fallen off their recent peaks in 2016-17 of 8.2 per cent and 8.0 per cent in 2015-16, respectively (Table 1 and Table 2). A slowdown set in during 2017-18, reflecting the effects of demonetisation and initial disruptions from the implementation of the goods and services tax (GST). Although the economy steadied and regained some momentum from Q3:2017-18, this has been belied by estimated outcomes for Q2 and Q3 of 2018-19, and the likelihood of the slackening of pace extending into Q4:2018-19 appears to be growing. In the event, the average real GDP growth for the ensuing decade (2011-19) at 6.9 per cent is only marginally higher than the preceding one at 6.8 per cent (2001-11). 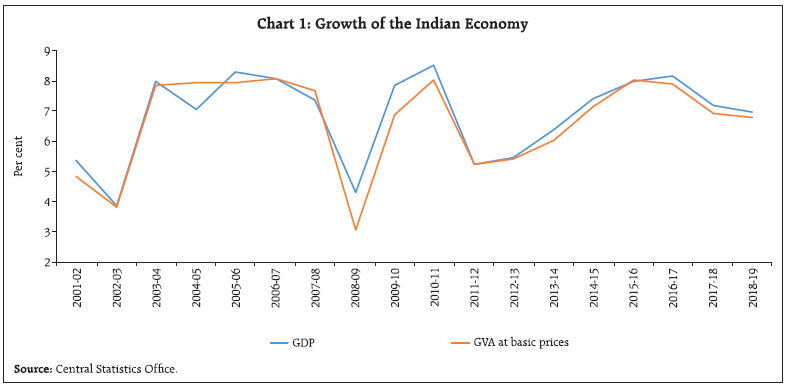 The recent slackening of pace in activity is revealed in stark profile when quarterly movements are tracked. The deceleration in GDP growth appears to have set in Q1:2016-17, much before the shock of demonetisation. It was caused largely by the slowdown in gross fixed capital formation (GFCF) and in private final consumption expenditure (PFCE). In fact, the growth of GFCF was at its lowest in Q1:2017-18, reflecting the uncertainty around the implementation of GST. GDP growth picked up from Q2:2017-18 as a turnaround occurred in the growth of GFCF as confidence gradually returned with rapid pace of remonetisation. The turnaround continued in Q3 and Q4 of 2017-18 and was propelled by government final consumption expenditure (GFCE) in the wake of the implementation of seventh Central Pay Commission (CPC) recommendations and one rank one pension (OROP) for defence personnel. Fixed investment strengthened further with the revival in construction activity which also got mirrored in coincident indicators – steel consumption and cement production. This momentum flattened in Q1 and Q2 of 2018-19 with visible deceleration in government consumption. The real GDP in Q3:2018-19 further decelerated due to falling GFCE and burgeoning imports, despite an uptick in PFCE (Table 3). Table 1: Component-wise Growth of GDP
(At 2011-12 Prices) | | (Per cent) | | Sector | Average from 2009-10 to 2013-14 | Average from 2014-15 to 2018-19 | 2016-17 (SRE) | 2017-18 (FRE) | 2018-19 (SAE) | | 1 | 2 | 3 | 4 | 5 | 6 | | PFCE | 6.4 | 7.6 | 8.2 | 7.4 | 8.3 | | GFCE | 5.4 | 8.9 | 5.8 | 15.0 | 8.9 | | Gross capital formation | 7.0 | 7.2 | 3.6 | 10.4 | 9.4 | | of which | | | | | | | (i) GFCF | 7.5 | 7.4 | 8.3 | 9.3 | 10.0 | | (ii) Change in stock | 6.1 | 15.5 | -48.2 | 21.2 | 5.3 | | (iii) Valuables | 11.3 | 6.9 | -18.9 | 27.4 | 0.6 | | Exports of goods and services | 8.9 | 3.9 | 5.1 | 4.7 | 13.4 | | Less Imports of goods and services | 6.4 | 6.5 | 4.4 | 17.6 | 15.7 | | GDP | 6.7 | 7.5 | 8.2 | 7.2 | 7.0 | | Source: Central Statistics Office. |
Table 2: Sectoral Growth of Gross Value Added at Basic Prices
(At 2011-12 Prices) | | Sector | Average from 2009-10 to 2013-14 | Average from 2014-15 to 2018-19 | 2016-17 (SRE) | 2017-18 (FRE) | 2018-19 (SAE) | | 1 | 2 | 3 | 4 | 5 | 6 | | I. Agriculture, forestry and fishing | 4.3 | 2.9 | 6.3 | 5.0 | 2.7 | | II. Industry | 5.4 | 8.3 | 8.3 | 6.1 | 7.2 | | (i) Mining and quarrying | 0.5 | 7.1 | 9.5 | 5.1 | 1.2 | | (ii) Manufacturing | 6.4 | 8.6 | 7.9 | 5.9 | 8.1 | | (iii) Electricity, gas, water supply and other utility services | 5.7 | 7.7 | 10.0 | 8.6 | 8.0 | | III. Services | 7.4 | 8.2 | 8.1 | 7.8 | 7.6 | | (i) Construction | 5.8 | 5.7 | 6.1 | 5.6 | 8.9 | | (ii) Trade, hotels, transport, communication and services related to broadcasting | 8.1 | 8.4 | 7.7 | 7.8 | 6.8 | | (iii) Financial, real estate and professional services | 7.3 | 8.8 | 8.7 | 6.2 | 7.3 | | (iv) Public administration, defence and other services | 7.8 | 8.8 | 9.2 | 11.9 | 8.5 | | IV. GVA at basic prices | 6.3 | 7.4 | 7.9 | 6.9 | 6.8 | | Source: Central Statistics Office. | On the supply side, the deceleration in GVA started much before demonetisation, i.e., from Q1:2016-17. Liquidity crunch in the system caused by demonetisation and uncertainty surrounding the implementation of GST led to a significant deceleration of cash-dependent construction activity in Q4:2016-17 and manufacturing in Q1:2017-18 (Table 4). There was a turnaround in both manufacturing and construction from Q2:2017-18 as the impact of demonetisation and GST implementation waned. Table 3: Component-wise Growth of GDP
(At 2011-12 Prices) | | (Per cent) | | Growth | 2016-17 | 2017-18 | 2018-19 | | Q1 | Q2 | Q3 | Q4 | Q1 | Q2 | Q3 | Q4 | Q1 | Q2 | Q3 | | PFCE | 6.7 | 9.6 | 11.2 | 5.4 | 10.1 | 6.0 | 5.0 | 8.8 | 6.9 | 9.8 | 8.4 | | GFCE | 2.2 | 2.1 | 6.0 | 15.6 | 21.9 | 7.6 | 10.8 | 21.1 | 6.5 | 10.8 | 6.5 | | Gross Capital formation | 8.5 | 3.0 | 2.1 | 1.2 | 6.7 | 10.3 | 12.5 | 11.8 | 9.5 | 9.9 | 10.5 | | of which | | | | | | | | | | | | | (i) GFCF | 13.6 | 8.1 | 6.6 | 5.5 | 3.9 | 9.3 | 12.2 | 11.8 | 11.7 | 10.2 | 10.6 | | (ii) Change in stock | -47.3 | -48.3 | -48.0 | -49.0 | 12.5 | 22.6 | 24.3 | 25.3 | 9.5 | 4.2 | 3.9 | | (iii) Valuables | -15.8 | -23.6 | -21.9 | -14.3 | 79.6 | 24.6 | 10.9 | 1.3 | -25.8 | 9.5 | 13.3 | | Exports of goods and services | 3.6 | 2.5 | 7.0 | 7.1 | 4.9 | 5.8 | 5.3 | 2.8 | 11.2 | 13.9 | 14.6 | | Less Imports of goods and services | 0.4 | -0.1 | 10.6 | 7.0 | 23.9 | 15.0 | 15.8 | 16.2 | 10.8 | 21.4 | 14.7 | | GDP | 9.4 | 8.9 | 7.5 | 7.0 | 6.0 | 6.8 | 7.7 | 8.1 | 8.0 | 7.0 | 6.6 | | Source: Central Statistics Office. |
Table 4: Sectoral Growth of Gross Value Added at Basic Prices
(At 2011-12 Prices) | | (Per cent) | | Sector | 2016-17 | 2017-18 | 2018-19 | | Q1 | Q2 | Q3 | Q4 | Q1 | Q2 | Q3 | Q4 | Q1 | Q2 | Q3 | | I. Agriculture, forestry and fishing | 4.6 | 6.0 | 6.7 | 7.4 | 4.2 | 4.5 | 4.6 | 6.5 | 5.1 | 4.2 | 2.7 | | II. Industry | 9.7 | 7.5 | 8.5 | 7.7 | -0.1 | 7.7 | 8.0 | 8.6 | 10.1 | 6.1 | 6.1 | | (i) Mining and quarrying | 6.9 | 5.6 | 8.5 | 15.3 | 2.9 | 10.8 | 4.5 | 3.8 | 0.4 | -2.1 | 1.3 | | (ii) Manufacturing | 9.8 | 7.7 | 8.3 | 6.2 | -1.7 | 7.1 | 8.6 | 9.5 | 12.4 | 6.9 | 6.7 | | (iii) Electricity, gas, water supply and other utility services | 13.2 | 7.8 | 10.2 | 8.7 | 8.6 | 9.2 | 7.5 | 9.2 | 6.7 | 8.7 | 8.2 | | III. Services | 10.2 | 9.0 | 7.2 | 6.1 | 8.6 | 6.5 | 8.0 | 8.0 | 7.5 | 7.6 | 7.6 | | (i) Construction | 7.6 | 8.4 | 7.5 | 0.9 | 3.3 | 4.8 | 8.0 | 6.4 | 9.6 | 8.5 | 9.6 | | (ii) Trade, hotels, transport, communication and services related to broadcasting | 9.4 | 7.7 | 7.9 | 6.0 | 8.3 | 8.3 | 8.3 | 6.4 | 7.8 | 6.9 | 6.9 | | (iii) Financial, real estate and professional services | 13.5 | 11.3 | 5.2 | 3.3 | 7.8 | 4.8 | 6.8 | 5.5 | 6.6 | 7.2 | 7.3 | | (iv) Public administration, defence and other services | 6.6 | 6.5 | 9.0 | 14.7 | 14.8 | 8.8 | 9.2 | 15.2 | 7.6 | 8.7 | 7.6 | | IV. GVA at basic prices | 9.3 | 8.3 | 7.4 | 6.7 | 5.9 | 6.6 | 7.3 | 7.9 | 7.8 | 6.8 | 6.3 | | Source: Central Statistics Office. | GVA growth slow down which commenced in Q1:2018-19, sharpened further in Q2 and Q3 of 2018- 19. All three sectors of GVA, namely, agriculture, forestry and fishing, industry and services lost steam and moderated on a year-on-year basis in Q3: 2018-19. In the industrial sector, manufacturing and mining sub-sector slowed down year-on-year reflecting pressure from rising cost of raw materials. Two major sub-sectors under services (with a combined share of 32 per cent), viz., trade, hotels, transport, communication and services related to broadcasting and public administration, defence and other services dragged down activity in the services sector despite an uptick in construction activity and financial, real estate and professional services. III. Trends in Aggregate Supply During 2018-19, real GVA growth moderated due to lower growth in agricultural and services sector. The deceleration in agriculture, forestry and fishing essentially reflected subdued growth of kharif production, which is attributable to the deficient southwest monsoon (91 per cent of its long period average or LPA). The cumulative northeast monsoon (1st October - 31st December) was 44 per cent lower than its LPA at all India level. Lack of rains and poor soil moisture conditions resulted in a shortfall of rabi foodgrains production by 3.5 per cent over the previous year; however, this comes on the back of two successive years of record crop production. Agricultural sector growth displayed considerable fluctuations, ranging from a high growth of 6.4 per cent in 2011-12 to a contraction in 2014-15. Despite two consecutive drought years in 2014-15 and 2015-16, value added in agriculture has grown at an average of 3.1 per cent during the period 2012-13 to 2018-19. The importance of crop production is declining over the years, while allied activities which include livestock and fishing and aquaculture have maintained their share steadily around five per cent of GVA at basic prices. In the industrial sector3, the growth of value added picked up on a year on year basis. At a sub-sectoral level, recovery occurred in the manufacturing sector, while output from mining and electricity generation decelerated. Manufacturing shrugged off the transient effects of the implementation of GST, but it has exhibited considerable volatility during the period. In the second half of 2017-18 manufacturing started recovering from sluggishness, boosted by strong corporate sales growth, an uptick in capacity utilisation, drawdown of inventories of finished goods, an incipient pick up in the capital expenditure (capex) cycle and slow return of pricing power. Within manufacturing, growth was driven by textiles, apparels and leather products, machinery and equipment and other items such as coke, petroleum, rubber, furniture and other related products. However, there was lacklustre growth in food and metal products. Mining registered a sharp deceleration as production of crude oil and natural gas contracted in 2018-19. In the services sector4, value added slowed marginally, although, it still contributed 69.3 per cent of overall GVA growth (Chart 2.a). At the sub-sectoral level, an acceleration in financial, real estate and professional services and construction was observed, with the latter accelerating to its highest pace in the last seven years. This was also mirrored in proximate coincident indicators – steel consumption and cement production – both of which showed robust growth. The deceleration in trade, hotels, transport, communication and services related to broadcasting was on account of lukewarm sales of commercial vehicles and heightened financial stress in telecommunication sector amidst stiffened competition. Public administration, defence and other services (PADO) lost pace due to the waning effects of the implementation of seventh CPC and OROP. Growth in real GVA was led by the services sector during the period 2012-13 to 2018-19 with major contributions emanating from trade, hotel, transport, communication and services related to broadcasting and financial, real estate and professional services sub-sectors. The slowdown in these very sub-sectors has accordingly evoked concerns (Chart 2b). 
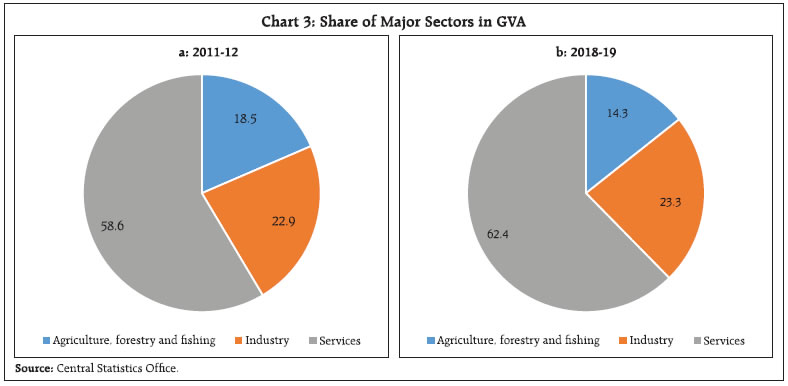 The reducing share of agriculture and the increasing share of services reflects the structural changes in the Indian economy over the years (Chart 3). The decline in the share of agriculture occurred in the crop segment, whose share in real GVA at basic prices declined from 12.1 per cent in 2011-12 to 8.7 per cent in 2017-18. At the same time, livestock and fishing and aquaculture have remained resilient. Within services, all the sectors except construction have increased their share in real GVA with notable increase emanating from trade, hotel, transport and communication and financial, real estate and professional services (Table 5). Within these sub-sectors, trade and repair services, real estate and professional services increased at a rapid pace relating to other components. Table 5: Sectoral Composition of Real Gross Value Added at Basic Prices
(At 2011-12 Prices) | | (Per cent) | | Sector | 2011-12 | 2012-13 | 2013-14 | 2014-15 | 2015-16 | 2016-17 | 2017-18 | 2018-19 | | 1 | 2 | 3 | 4 | 5 | 6 | 7 | 8 | 9 | | I. Agriculture, forestry and fishing | 18.5 | 17.8 | 17.8 | 16.5 | 15.4 | 15.2 | 14.9 | 14.3 | | II. Industry | 22.9 | 22.7 | 22.3 | 22.5 | 23.3 | 23.4 | 23.2 | 23.3 | | (i) Mining and quarrying | 3.2 | 3.1 | 2.9 | 3.0 | 3.0 | 3.1 | 3.0 | 2.9 | | (ii) Manufacturing | 17.4 | 17.4 | 17.2 | 17.3 | 18.1 | 18.2 | 18.0 | 18.2 | | (iii) Electricity, gas, water supply and other utility services | 2.3 | 2.2 | 2.2 | 2.2 | 2.1 | 2.2 | 2.2 | 2.2 | | III. Services | 58.6 | 59.5 | 59.9 | 61.0 | 61.3 | 61.4 | 61.9 | 62.4 | | (i) Construction | 9.6 | 9.1 | 8.8 | 8.6 | 8.2 | 8.1 | 8.0 | 8.2 | | (ii) Trade, hotels, transport, communication and services related to broadcasting | 17.4 | 18.1 | 18.2 | 18.6 | 19.0 | 19.0 | 19.1 | 19.1 | | (iii) Financial, real estate and professional services | 18.9 | 19.7 | 20.6 | 21.4 | 21.9 | 22.0 | 21.9 | 22.0 | | (iv) Public administration, defence and other services | 12.7 | 12.5 | 12.3 | 12.4 | 12.2 | 12.3 | 12.9 | 13.1 | | IV. GVA at basic prices | 100.0 | 100.0 | 100.0 | 100.0 | 100.0 | 100.0 | 100.0 | 100.0 | | Source: Central Statistics Office. | IV. Demand Side Trends The high average growth in real GDP for the last five years (2014-15 to 2018-19) was driven by consumption, both private and government. By contrast, fixed investment has started gaining stronger momentum only during recent years. Consequently, the share of real fixed capital formation in GDP rose to a five-year high at 32.3 per cent in 2018-19. Moreover, the average share of real gross fixed investment in GDP between 2012-13 and 2018-19 was higher than during the period from 2004-05 and 2011-12. The growth in PFCE in 2018-19 was the highest in the entire 2011-12 base year series. Also, PFCE continued to remain the mainstay of aggregate demand with its share in GDP increasing to 57.0 per cent in 2018-19 from 56.3 per cent in the previous year. The share of GFCE in GDP has remained broadly stable since 2011-12. Its contribution to real GDP growth in the recent period can be attributed to the implementation of seventh CPC and OROP. Further decomposition of PFCE reveals that there has been a fall in the share of household consumption of food products and housing, while expenditure on health, transport and miscellaneous goods and services5 increased. The share of durable goods6 and services has increased while that of non-durable goods7 has declined over the years (Annex II), indicative of shifts in consumption pattern of households at an aggregate level. Increase in expenditure on health and transport services is particularly reflective of rising incomes. On the investment side, the share of fixed investment in dwellings, buildings and other structures dropped marginally in the household sector outweighing the rise in fixed investment by general government and non-financial corporations (Chart 4). This was, however, compensated by fixed investment in machinery and equipment by the household sector which outweighed the fall in investment by other institutional sectors. The leakage from net exports depleted domestic demand further in 2018-19. Although exports surged, they were outpaced by imports. The share of gross external trade (i.e., sum of exports and imports) in GDP declined from 55.6 per cent in 2011-12 to 41.6 per cent in 2016-17 before increasing marginally to 46.3 per cent in 2018-19, reflecting weakening global demand conditions (Chart 5). V. Saving and Investment As per the FRE of 2017-18, the gross domestic saving (GDS) rate increased marginally to 30.5 per cent of GDP in 2017-18 from 30.3 per cent in 2016-17, thereby arresting the secular decline in savings rate from a level of 34.6 per cent of GDP in 2011-12. This increase was mainly due to higher saving of non-financial corporations, which was more pronounced in the public sector. At the same time, general government’s dissaving increased to 1.0 per cent in 2017-18 indicating a lapse in efforts to bring about fiscal consolidation on a sustainable basis (Annex III). 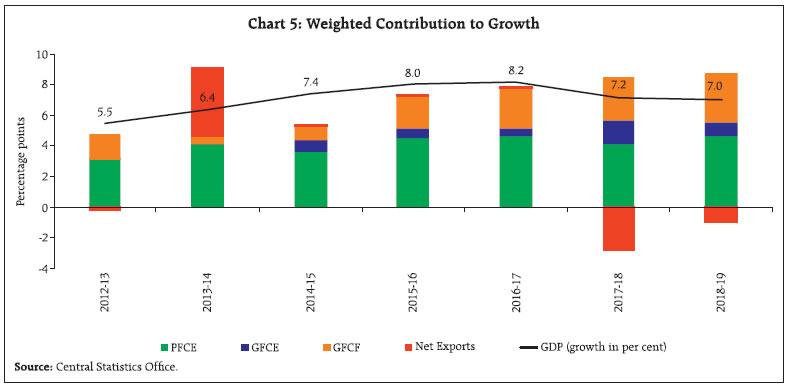 The household sector continued to account for the predominant share (over 50 per cent) of overall savings (Chart 6). However, the household sector’s saving rate, which was 23.6 per cent of GDP in 2011- 12, dwindled to 17.2 per cent in 2017-18, primarily due to fall in saving in physical assets from a level of 15.9 per cent of GDP in 2011-12 to 10.3 per cent in 2017-18. Share of household financial saving – the most important source of funds for investment in the economy – accelerated to 6.6 per cent of GDP in 2017-18 from 6.3 per cent in 2016-17. However, it is much lower than 8.1 per cent of GDP in 2015-16. The rate of gross capital formation improved to 32.3 per cent of GDP in 2017-18 from 30.9 per cent in the previous year, mainly due to higher investment by private financial corporations and general government sector. The investment rate has fallen sharply over the years from a high of 39.0 per cent in 2011-12, primarily due to fall in investment by households. The saving-investment gap for the economy has come down over the years, thereby highlighting stronger macroeconomic fundamentals. The household sector remained the net supplier of funds to the private corporate and public sectors. However, in recent years, the private corporate sector’s saving-investment gap has almost closed and most of its investment is financed through own saving, indicating a falling appetite for fresh investment. The public-sector drawdown on private savings (i.e., the saving investment gap), remained elevated. In relation to growth, besides quantity of investment what equally matters is the quality or the productivity of investment. The standard measure of productivity of investment is the incremental capital output ratio (ICOR) which implies capital required to produce an additional unit of output. Productivity of investment has notably improved during the last five years when the average ICOR was 4.6 compared to the previous quinquennium (2009-10 to 2013-14) when ICOR averaged 5.9. Allthough yearly movement in ICOR has been volatile, it displayed an increasing trend from 2016-17 onwards. However, Government initiatives on affordable housing, rural infrastructure and roads are expected to boost productivity of investment going forward. The correlation between saving and investment in India is near perfect (0.99). The recent declining trend in saving and capital formation reasserts that despite substantial structural changes, and more liberal policies towards freer capital movement over the years, the Feldstein-Horioka puzzle8 continues to hold in Indian context. Moreover, the narrowing of saving-investment gap in recent years further strengthens the importance of domestic saving for investment purpose. VI. GDP: Cross-country Comparison The Indian economy is the world’s sixth-largest in nominal GDP terms and the third-largest by purchasing power parity (PPP). In a cross-country perspective, India turns out to be relatively investment driven economy second only to China among major economies in respect of gross fixed capital formation in GDP (Table 6). Household consumption expenditure, the mainstay of India’s GDP, matches that of Japan, Russia and South Africa and is higher than in China and Republic of Korea, but significantly lower than in the US, the UK and Brazil. The share of GFCE in GDP in India is among the lowest in the set of economies considered here. Per Capita Income In line with GDP growth, real per capita income (at 2011-12 prices) is also on a rising trend. During 2018-19, it is likely to attain a level of ₹92,718 as compared to ₹87,623 for the year 2017-18. | Table 6: Cross-Country Comparison | | (Per cent of GDP) | | Country | Household Final Consumption | Government Final Consumption | Gross Capital Formation | | 2015 | 2016 | 2017 | 2015 | 2016 | 2017 | 2015 | 2016 | 2017 | | Brazil | 64.0 | 64.0 | 63.4 | 19.8 | 20.2 | 20.0 | 17.4 | 15.4 | 15.5 | | China | 38.6 | 39.5 | 38.4 | 14.0 | 14.3 | 14.3 | 45.4 | 44.3 | 43.6 | | India | 58.8 | 59.0 | 59.1 | 10.4 | 10.9 | 11.4 | 31.8 | 30.3 | 30.6 | | Japan | 56.6 | 55.7 | NA | 19.8 | 19.8 | NA | 24.0 | 23.6 | NA | | Republic of Korea | 49.3 | 48.7 | 48.1 | 15.0 | 15.2 | 15.3 | 28.9 | 29.3 | 31.1 | | Mexico | 65.6 | 65.6 | 65.6 | 12.3 | 12.1 | 11.8 | 23.3 | 23.7 | 23.1 | | Russian Federation | 52.3 | 52.6 | 52.4 | 17.7 | 18.3 | 18.0 | 21.9 | 22.8 | 23.9 | | South Africa | 59.7 | 59.4 | 59.4 | 20.5 | 20.8 | 20.9 | 21.0 | 19.4 | 18.6 | | Thailand | 51.0 | 50.0 | 48.8 | 17.1 | 16.9 | 16.4 | 22.3 | 21.7 | 22.8 | | United Kingdom | 65.6 | 65.8 | 65.7 | 19.2 | 18.8 | 18.4 | 17.0 | 17.0 | 17.0 | | United States | 68.1 | 68.8 | NA | 14.4 | 14.3 | NA | 20.4 | 19.7 | NA | NA: Not Available.
Source: World Bank Database. | As per the World Bank classification, India ranked 139th in the world in terms of per capita GDP (nominal) at US$ 2,134 and 122nd in terms of per capita GDP in purchasing power parity (PPP) terms at US$ 7,783 in 2018, placing it in the lower-middle-income group of countries. In the last five years, India’s per capita income (GDP per capita) relative to some select major emerging market economies (EME) has improved (Annex IV and Annex V). VII. Conclusion Amidst the incidence of shocks, Indian economy has exhibited tremendous resilience. Overall, one can easily discern three distinct phases of growth. The initial phase (2011-12 to 2012-13) was marked by a slowdown juxtaposed with the waning effects of stimulus and tapering of quantitative easing9 since 2013. The second phase (2013-14 to 2016-17) was one of high growth buoyed by crude oil prices crashing during 2014-15, despite two successive drought years in 2014-15 and 2015-16. The third break came after demonetisation and implementation of GST, with the subsequent oil price surge and tightening of financial conditions. During this period, GDP growth was driven by domestic demand, primarily consumption, while the share of gross external trade recorded a sustained decline. Analysis put out by international bodies suggest that global economic activity is clouded by high degree of uncertainty with definite signs of slowdown. In this scenario, if domestic factors are not as sanguine as they have been so far, then spillovers from weakening global demand might thwart India’s growth trajectory. Despite the pace of economic growth moderating somewhat, the recent pick up in GFCF, on the demand side, and the revival of manufacturing, construction, and financial services on the supply side, bode well for the sustainability of India’s economic growth at a high rate of about 7 per cent. India is one of the few emerging market economies characterised with a robust macroeconomic policy framework, flexible exchange rate, and manageable exposures to foreign-currency-denominated debt. Recent structural reforms are helping to further support domestic demand, strengthen investment, and thereby, improve income growth.
Annex I: National Accounts Data Release Calendar The new series on National Accounts Statistics (NAS) was introduced through a press release on January 30, 2015 with base year 2011-12 replacing the series with base year 2004-05. This base revision also met the objective to update the underlying methodology of NAS to the most recent international guidelines, viz., the United Nations System of National Accounts, 2008 (SNA 2008). More recently, on November 28, 2018, the CSO released the back-series estimates of NAS since 2004-05 at the 2011-12 base, followed by a ‘Methodology Document’ released in January 2019. Compilation of back series estimates is a routine exercise done by statistical agencies in all the countries across the world to maintain completeness and comparability with old base data sets. A sequence of real GDP and real GVA growth are outlined in Table A. | Table A: Sequence of Release in National Accounts Aggregates | | (in per cent) | | | FAE | SAE | PE | FRE | SRE | TRE | | | January 07 | February 28 | May 31 | January 31 of next year (T+1) | January 31 of T+2 | January 31 of T+3 | | GDP at market prices | | 2018-19 | 7.2 | 7.0 | | | | | | 2017-18 | 6.5 | 6.6 | 6.7 | 7.2 | - | - | | 2016-17 | 7.1 | 7.1 | 7.1 | 7.1 | 8.2 | - | | 2015-16 | - | 7.6 | 7.6 | 7.9 | 8.2 | 8.0 | | GVA at basic prices | | 2018-19 | 7.0 | 6.8 | | | | | | 2017-18 | 6.1 | 6.4 | 6.5 | 6.9 | - | - | | 2016-17 | 7.0 | 6.7 | 6.6 | 7.1 | 7.9 | - | | 2015-16 | - | 7.3 | 7.2 | 7.8 | 8.1 | 8.0 | | Source: Central Statistics Office. | Here, it may be noted that revisions of national account data are inevitable due to staggered availability of macroeconomic data. This is done across the countries following a systematically well laid out methodology. The sequence of data release by the CSO are outlined in Table B. | Table B: Release Calendar and Revision Policy of GDP Estimates | | First Advance Estimates (FAE) | January 07
(T - 83 days) | Benchmarked to Provisional Estimates of previous year. Estimates obtained by extrapolation using data available for 7/8 months. | | First Revised Estimates (FRE) for previous year | January 31
(T + 10 months) | Detailed Estimates of various sectors is available. Estimates of savings, disposable income and capital formation are also provided. | | Second Advance Estimates (SAE) / Third Quarter Estimates | February 28
(T - 1 month) | Benchmarked to First Revised Estimates of previous year. Estimates obtained by extrapolation using data available for 9 months. | | Provisional Estimates (PE) / Fourth Quarter Estimates | May 31
(T + 2 months) | Based on indicators which now become available for the whole of financial year. | | First Revised Estimates | January 31
(T + 10 months) | Revised Estimates of Budgets of Central and State Governments are available. Information of 42 crops, horticulture, animal husbandry and forestry are used. | | Second Revised Estimates | January 31
(T + 22 months) | Figures available from actual expenditure of Central and State Government budgets along with data from Annual Survey of Industries. | | Third Revised Estimates | January 31
(T + 34 months) | Improved coverage of central and state Government accounts, accounts of public and private corporations and accounts of local bodies. | Notes: 1. T: Date of end of financial year.
2. In India, the financial year runs from April 1 to March 31.
3. Change in the base year may also lead a revision in national accounts data. Base year of national accounts data is revised from time to time to capture latest structure of the economy and align the extant data compilation methods with global best practices.
Source: Central Statistics Office. |
| Annex II: Private Final Consumption Expenditure | | (Per cent of GDP) | | By Purpose | 2011-12 | 2012-13 | 2013-14 | 2014-15 | 2015-16 | 2016-17 | 2017-18 | | 1 | 2 | 3 | 4 | 5 | 6 | 7 | 8 | | Food and non-alcoholic beverages | 17.2 | 17.3 | 17.4 | 16.4 | 15.5 | 15.9 | 14.9 | | Alcoholic beverages, tobacco and narcotics | 1.6 | 1.4 | 1.3 | 1.3 | 1.2 | 1.1 | 1.0 | | Clothing and footwear | 3.6 | 3.4 | 3.8 | 3.7 | 3.7 | 3.5 | 3.6 | | Housing, water, electricity, gas and other fuels | 9.2 | 9.3 | 9.3 | 9.0 | 8.6 | 8.2 | 7.9 | | Furnishings, household equipment and routine household maintenance | 1.8 | 1.8 | 1.9 | 1.9 | 1.9 | 1.9 | 2.0 | | Health | 2.1 | 2.2 | 2.2 | 2.4 | 2.4 | 2.5 | 2.7 | | Transport | 8.5 | 8.4 | 8.2 | 8.1 | 8.6 | 8.8 | 9.6 | | Communication | 1.3 | 1.3 | 1.3 | 1.5 | 1.4 | 1.3 | 1.2 | | Recreation and culture | 0.6 | 0.6 | 0.6 | 0.5 | 0.5 | 0.5 | 0.5 | | Education | 2.1 | 2.1 | 2.1 | 2.1 | 2.1 | 2.1 | 2.2 | | Restaurants and hotels | 1.3 | 1.3 | 1.2 | 1.2 | 1.3 | 1.3 | 1.3 | | Miscellaneous goods and services | 7.2 | 7.6 | 7.8 | 8.3 | 9.3 | 9.5 | 9.8 | | By durability | | | | | | | | | Durable goods | 1.7 | 1.9 | 1.8 | 1.8 | 1.8 | 1.9 | 2.2 | | Semi-durable goods | 4.5 | 4.3 | 4.6 | 4.6 | 4.5 | 4.3 | 4.4 | | Non-durable goods | 24.0 | 23.8 | 23.7 | 22.7 | 21.8 | 21.9 | 21.1 | | Services | 26.3 | 26.7 | 26.9 | 27.4 | 28.3 | 28.4 | 29.0 | | Source: Central Statistics Office. |
| Annex III: Saving and Capital Formation by Institutions | | (Per cent of GDP) | | Item | 2011-12 | 2012-13 | 2013-14 | 2014-15 | 2015-16 | 2016-17 | 2017-18 | | 1 | 2 | 3 | 4 | 5 | 6 | 7 | 8 | | 1. Gross Domestic Savings | 34.6 | 33.9 | 32.1 | 32.2 | 31.1 | 30.3 | 30.5 | | (i) Household Sector | 23.6 | 22.5 | 20.3 | 19.6 | 18.0 | 17.1 | 17.2 | | (a) Financial Saving | 7.4 | 7.4 | 7.4 | 7.1 | 8.1 | 6.3 | 6.6 | | Gross financial saving | 10.7 | 10.7 | 10.6 | 10.1 | 10.9 | 9.4 | 10.9 | | Less financial liabilities | 3.3 | 3.3 | 3.2 | 3.0 | 2.8 | 3.1 | 4.3 | | (b) Physical Assets# | 16.3 | 15.1 | 12.9 | 12.5 | 9.9 | 10.8 | 10.6 | | (ii) Private Corporate Sector | 9.5 | 10.0 | 10.7 | 11.7 | 11.9 | 11.5 | 11.6 | | (iii) Public Sector | 1.5 | 1.4 | 1.0 | 1.0 | 1.2 | 1.7 | 1.7 | | 2. Gross Capital Formation | 36.7 | 35.6 | 32.6 | 32.6 | 30.6 | 29.1 | 29.7 | | (i) Household Sector | 15.9 | 14.7 | 12.6 | 12.1 | 9.6 | 10.5 | 10.3 | | (ii) Private Corporate Sector | 13.3 | 13.6 | 12.9 | 13.4 | 13.5 | 11.6 | 12.1 | | (iii) Public Sector | 7.5 | 7.2 | 7.1 | 7.1 | 7.6 | 7.1 | 7.2 | | 3. Gross Capital Formation adjusted for errors and omissions | 39.0 | 38.7 | 33.8 | 33.5 | 32.1 | 30.9 | 32.3 | | 4. Saving-Investment Gap (1-2) | -2.0 | -1.7 | -0.5 | -0.3 | 0.5 | 1.1 | 0.9 | | (i) Household Sector | 7.7 | 7.7 | 7.7 | 7.4 | 8.4 | 6.6 | 6.8 | | (ii) Private Corporate Sector | -3.8 | -3.6 | -2.2 | -1.7 | -1.6 | -0.1 | -0.5 | | (iii) Public Sector | -6.0 | -5.8 | -6.0 | -6.1 | -6.4 | -5.4 | -5.5 | #: Includes valuables.
Source: Central Statistics Office. |
| Annex IV: GDP Per Capita Income Across Countries | | Country Name | (Amount in current US$) | Growth Rate (per cent) | | 2013 | 2014 | 2015 | 2016 | 2017 | 2014 | 2015 | 2016 | 2017 | | India | 1452.2 | 1576.0 | 1606.0 | 1717.5 | 1942.1 | 8.5 | 1.9 | 6.9 | 13.1 | | Brazil | 12216.9 | 12026.6 | 8750.2 | 8639.4 | 9821.4 | -1.6 | -27.2 | -1.3 | 13.7 | | China | 7077.8 | 7683.5 | 8069.2 | 8117.3 | 8827.0 | 8.6 | 5.0 | 0.6 | 8.7 | | Russia | 16007.1 | 14125.9 | 9346.6 | 8759.0 | 10743.1 | -11.8 | -33.8 | -6.3 | 22.7 | | South Africa | 6819.1 | 6429.0 | 5743.0 | 5279.7 | 6151.1 | -5.7 | -10.7 | -8.1 | 16.5 | | Mexico | 10400.6 | 10582.4 | 9298.2 | 8450.5 | 8910.3 | 1.7 | -12.1 | -9.1 | 5.4 | | Pakistan | 1272.4 | 1317.0 | 1428.6 | 1442.3 | 1547.9 | 3.5 | 8.5 | 1.0 | 7.3 | | Philippines | 2760.3 | 2842.9 | 2878.3 | 2950.9 | 2989.0 | 3.0 | 1.2 | 2.5 | 1.3 | | Indonesia | 3620.7 | 3491.6 | 3334.5 | 3570.3 | 3846.9 | -3.6 | -4.5 | 7.1 | 7.7 | | Turkey | 12542.7 | 12127.5 | 10984.8 | 10862.7 | 10546.2 | -3.3 | -9.4 | -1.1 | -2.9 | | Source: World Bank Database. |
| Annex V: GDP Per Capita Across Countries | | PPP (current international $) | | Country Name | 2013 | 2014 | 2015 | 2016 | 2017 | | India | 5250.5 | 5672.9 | 6130.1 | 6573.9 | 7059.3 | | Brazil | 15971.0 | 16195.9 | 15656.3 | 15181.5 | 15483.5 | | China | 12368.0 | 13440.5 | 14450.1 | 15530.6 | 16806.7 | | Russia | 26240.3 | 25797.5 | 24737.7 | 24818.9 | 25533.0 | | South Africa | 12770.0 | 13051.8 | 13180.5 | 13250.6 | 13497.5 | | Mexico | 16848.0 | 17484.3 | 17253.2 | 17784.0 | 18273.5 | | Pakistan | 4619.7 | 4820.8 | 5000.3 | 5238.2 | 5527.4 | | Philippines | 6526.7 | 6937.9 | 7320.5 | 7800.7 | 8342.8 | | Indonesia | 9979.5 | 10537.7 | 11040.2 | 11611.0 | 12283.6 | | Turkey | 22310.5 | 24029.7 | 24844.9 | 25247.2 | 26518.9 | | Source: World Bank Database. |
|