This article, the fifth in the series, presents the broad features of the results obtained in quarterly rounds of the Reserve Bank’s Industrial Outlook Survey (IOS) in the year 2016-17 against the backdrop of salient macroeconomic developments. It provides useful insights into the performance of the manufacturing sector, including price developments relating to industrial raw materials and manufactured products. 1. Introduction The Industrial Outlook Survey (IOS) of the Indian manufacturing sector is conducted by the Reserve Bank on a quarterly basis since 19981. The survey assesses business sentiment for the current quarter and expectations for the ensuing quarter, based on qualitative responses on a set of indicators pertaining to demand conditions, financial conditions, employment conditions and the price situation. By design, the results of the survey are expected to track manufacturing activity in India and provides lead indicators thereof. Although the survey is focused on the manufacturing sector, it also provides some information about the state of the overall economy. Against this backdrop, this article aims at (a) presenting underlying central tendencies in the survey results; and (b) analysing empirically their tracking performance in respect of relevant official statistics. The rest of the article is organised as follows: section two describes broad features of the survey with a focus on the process of summarising individual survey responses, while Section three presents broad central tendencies in the survey results and Section four provides empirical results on tracking performance of the survey with respect to a few official statistics. Section five summarises the observations. 2. Survey Responses and Aggregation The survey questionnaire is canvassed among a panel of about 2,500 manufacturing companies – mostly with paid-up capital above ₹ 5 million – which represents a mix of size and industry groups. The list is updated periodically with addition of new companies and deletion of closed/merged companies. Participation in the survey is voluntary. The response rates have been around 45 per cent in 2016-17. The questionnaire contains questions/parameters relating to demand conditions, price situation, employment and financial conditions. Respondents are asked to offer qualitative answers on each question on a three-point scale – ‘improvement’, ‘no change/ status quo’, and ‘worsening’. The two extremes, viz.., ‘improvement’ and ‘worsening’ refer to positive (optimistic) and negative (pessimistic) responses, respectively. Survey responses on each question or parameter are aggregated/summarised through a measure called ‘Net Response (NR)’, which is the difference between the proportions of ‘optimistic (positive)’ and ‘pessimistic (negative)’ responses. Thus, by construction, NRs can take values between (-)100 and 100, zero being interpreted as ‘no change/status quo’. Larger value of NR indicates improved optimism (or declining pessimism). The results of the survey are summarised in a composite ‘Business Expectation Index (BEI)’, which is based on NRs relating to nine select performance indicators2. The BEI, scaled between 0 and 200, gives a snapshot of industrial performance and outlook in each quarter – the value 100 representing the threshold of no change (status quo) and a reading above (below) 100 indicates an expansion (a contraction) of the overall business activity. For each of the survey round, two forms of BEI are computed – one based on the assessment of the current quarter (BEI-Asmt) and another based on expectations for the ensuing quarter (BEI-Expt). 3. Highlights in Recent Survey Results The results of the IOS rounds for 2016-17 has been encapsulated under three broad heads, i.e., overall business sentiment, demand conditions and price situation, in the context of the findings from the survey rounds since Q1:2013-14. The trends observed since 2013-14 throws up interesting insights into the state of the industrial sector in the medium term. 3.1 Overall Business Sentiment The BEI-Asmt reached an inflection point in Q4:2016-17, reversing successive declines in the previous two quarters. By the end of the year, it reached a level of 106.2, which was close to the most recent peak observed in Q4:2014-15 (Chart 1). Expectations of the respondents were generally formed in an adaptive manner and the BEI-Expt tracked the BEI-Asmt with a one quarter lag3. On the basis of the average of quarters, the year 2016-17 was not very different from the previous year (Chart 2). Production, order books and the overall business situation lifted the BEI measurement in both the years, while lower profit margin and the pile up of inventories operated as drags. 3.2 Demand Conditions On most of the parameters reflecting demand conditions, there was dip in optimism in the middle two quarters of 2016-17, but the situation reversed in the fourth quarter. However, manufacturers’ sentiment on inventory positions remained persistently negative (Chart 3).
The outlook for Q1:2017-18 shows further improvement, contributed by parameters like production, order books, capacity utilisation, exports and employment. Negative sentiment on inventory positions, however, remain unchanged (Chart 4). 3.3 Price Situation The survey assesses the price situation through the parameters for cost of raw materials, and the selling price. Manufacturers’ pessimism on the cost of raw materials has gradually increased in the recent period, whereas the sentiment on the selling price has been improving (Chart 5-6 and Annex 2).
4. Tracking Performance of the Survey Are the survey results able to track select official statistics on output and prices? In particular, the ability of BEIs (i.e., BEI-Asmt and BEI-Expt) to track the official statistics on output, and the co-movement of NRs on cost of raw materials (CRM) and the selling price (SP) with the wholesale price index (WPI) for industrial raw materials and manufactured products, respectively, assume significance. 4.1 Output Chart 7 shows that both BEI-Asmt and BEI-Expt track alternative output measures – the index of industrial production for the manufacturing sector (IIP-Manf), and gross value added in the manufacturing sector (GVA-Manf)4 – reasonably well. The pair-wise correlation coefficients between survey-based indices and annual growth in the alternative output measures are statistically significant. Further, the relationship appears to be relatively stronger in case of the BEI-Asmt (Table 1).
| Table 1: Correlation Coefficient between Survey Indices and Official Statistics on Output | | Annual Growth in Output Measure | Survey Index | | BEI-Asmt | BEI-Expt | | IIP-Manf | 0.8505* | 0.7745* | | GVA-Manf | 0.6311* | 0.4518* | | ‘*’ Significant at 1 per cent level. | To buttress these results, the annual growth in the output measure is regressed on a constant, its own past values (lags upto 4 quarters) and the BEI-Asmt/ BEI-Expt. The explanatory power of the regression (as measured by the adjusted-R2 statistics) indicates a reasonably good fit (Table 2). | Table 2: The Adjusted-R2 Statistics for Fitted Regression Equations | | Dependent Variable (Annual Growth in Output Measure) | Survey Index as Explanatory Variable* | | BEI-Asmt | BEI-Expt | | IIP-Manf | 0.7896 | 0.7020 | | GVA-Manf | 0.5374 | 0.2510 | | ‘*’ Explanatory variables in each regression equation include a constant, past values of the dependent variable (lags upto 4 quarters) and BEI. | 4.2 Prices Given that IOS results usually come out before the release of provisional data on wholesale price index (WPI), it would be interesting to examine what insight the survey results offer regarding the WPI, even for the assessment quarter. By definition, higher value of NRs on any parameter indicates improvement or greater optimism with respect to the parameter. Thus, the NRs on CRM should be negatively correlated with changes in WPI for industrial raw materials (WPI-IRM). On the other hand, the NRs on SP should be positively correlated with changes in WPI for manufactured products (WPI-Manf). The NR-Asmt and NR-Expt on cost of raw materials seemed to have moved reasonably well with Y-o-Y changes in the WPI-IRM, but in the opposite direction – the correlation coefficients between the NR-Asmt and growth in WPI-IRM at (-)0.7731 and the same for NR-Expt at (-)0.6876 are statistically significant (Chart 8, Table 3). NRs on the selling price and annual change in WPI-Manf also exhibited strong co-movement in the same direction – the correlation coefficients for NR-Asmt and NR-Expt at 0.6546 and 0.7098, respectively, are statistically significant (Chart 9, Table 3).
| Table 3: Correlation Coefficient between NRs and Price Indices | | Annual Growth in Price Index | Cost of Raw Materials | Selling Price | | NR-Asmt | NR-Expt | NR-Asmt | NR-Expt | | WPI-IRM | -0.7731* | -0.6876* | - | - | | WPI-Manf | - | - | 0.6546* | 0.7098* | | ‘*’ Significant at 1 per cent level. | Regression analysis indicates a strong relationship between NR-Asmt (CRM) and WPI-IRM, and between NR-Asmt (SP) and WPI-Manf. The adjusted-R2 statistics for these equations turn out to be robust (Table 4). | Table 4: Performance of NR-Asmt in Explaining WPI | | Dependent Variable (Y) | NR-Asmt on the Parameter (X) | Adjusted-R2 | | YoY Change in WPI-IRM | Cost of Raw Materials | 0.9123 | | YoY Change in WPI-Manf | Selling Price | 0.9234 | | ‘*’ Explanatory variables in each regression equation include a constant, past values of the dependent variable (lags upto 4 quarters) and BEI. | The corresponding results for NR-Expt are similar, though relationship is relatively weaker. 5. Summary The demand conditions as assessed by the manufacturing sector companies in the recent rounds of IOS, through the parameters production, order books, exports, capacity utilisation and the employment, indicate an upturn in Q4:2016-17, which is likely to persist in Q1:2017-18. However, the inventory positions are yet to improve. On the price front, sentiments on cost of raw materials have deteriorated during 2016-17. However, the survey results reflect moderate improvement in the pricing power of the manufacturing sector. Overall, the survey results for 2016-17 indicate that the sector is poised in the absence of any clear-cut turnaround. 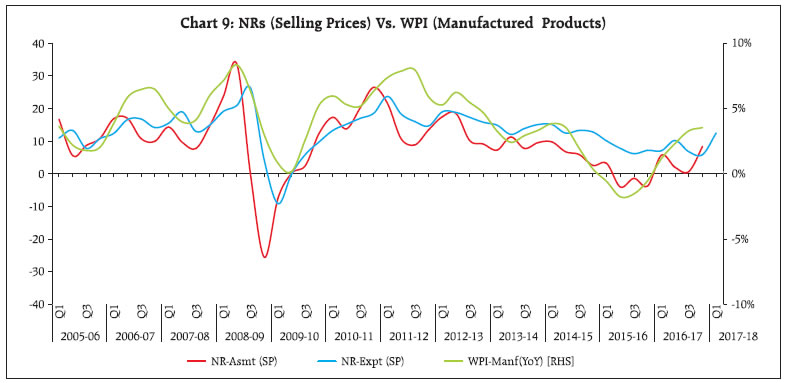 In this article, empirical analyses were carried out to examine if the survey results provide some insights into the direction of change in relevant official statistics. It is found that the BEIs track the activities of the manufacturing sector reasonably well, more so for concurrent period assessment. Further, price parameters of the survey contain useful information in tracking the corresponding WPI-inflation. Thus, the survey results provide useful information on short-term movements in Indian manufacturing for policymakers as well as for practitioners in financial markets and business.
Annex 1: | Business Expectation Index (BEI) | | Quarter | BEI-Assessment Quarter | BEI-Expectation Quarter | | Q1:2015-16 | 104.8 | 115.2 | | Q2:2015-16 | 102.4 | 113.1 | | Q3:2015-16 | 103.6 | 113.4 | | Q4:2015-16 | 103.0 | 114.2 | | Q1:2016-17 | 104.0 | 110.9 | | Q2:2016-17 | 102.7 | 112.9 | | Q3:2016-17 | 101.1 | 112.9 | | Q4:2016-17 | 106.0 | 111.1 | | Q1:2017-18 | | 114.2 |
Annex 2 | Table 2.1: Assessment & Expectation – Production | | (Percentage responses)@ | | Quarter | Total response | Assessment | Expectation | | Increase | Decrease | No change | Net re- sponse# | Increase | Decrease | No change | Net response | | Q1:2015-16 | 1299 | 34.1 | 17.8 | 48.1 | 16.3 | 39.6 | 10.9 | 49.5 | 28.7 | | Q2:2015-16 | 1304 | 34.1 | 18.9 | 46.9 | 15.2 | 40.3 | 11.4 | 48.3 | 28.9 | | Q3:2015-16 | 1337 | 34.2 | 18.2 | 47.6 | 16.0 | 40.5 | 11.3 | 48.2 | 29.2 | | Q4:2015-16 | 1342 | 35.6 | 18.8 | 45.6 | 16.8 | 41.2 | 10.2 | 48.6 | 31.1 | | Q1:2016-17 | 1275 | 34.5 | 17.2 | 48.3 | 17.3 | 38.8 | 13.8 | 47.4 | 25.0 | | Q2:2016-17 | 723 | 31.4 | 20.6 | 48.0 | 10.8 | 40.2 | 11.2 | 48.6 | 29.0 | | Q3:2016-17 | 1221 | 32.0 | 21.2 | 46.8 | 10.8 | 40.9 | 12.0 | 47.2 | 28.9 | | Q4:2016-17 | 1244 | 35.8 | 17.8 | 46.4 | 18.0 | 41.1 | 13.3 | 45.6 | 27.8 | | Q1:2017-18 | | | | | | 41.6 | 11.7 | 46.7 | 29.9 | ‘Increase’ in production is optimistic
@: Due to rounding off percentage may not add up to 100. This is applicable for all the tables from 2.1 to 2.22.
#:. Net Response (NR) is the difference of percentage of the respondents reporting optimism and that reporting pessimism. The range is (-) 100 to 100.
Any value greater than zero indicates expansion and any value less than zero indicates contraction. |
| Table 2.2: Assessment & Expectation – Order Books | | (Percentage responses) | | Quarter | Total response | Assessment | Expectation | | Increase | Decrease | No change | Net response | Increase | Decrease | No change | Net response | | Q1:2015-16 | 1299 | 30.8 | 17.7 | 51.5 | 13.2 | 37.8 | 10.5 | 51.7 | 27.3 | | Q2:2015-16 | 1304 | 31.1 | 19.7 | 49.3 | 11.4 | 37.4 | 11.6 | 51.0 | 25.8 | | Q3:2015-16 | 1337 | 30.4 | 18.8 | 50.8 | 11.5 | 37.4 | 11.9 | 50.8 | 25.5 | | Q4:2015-16 | 1342 | 31.8 | 19.7 | 48.5 | 12.1 | 39.7 | 10.6 | 49.8 | 29.1 | | Q1:2016-17 | 1275 | 32.1 | 16.5 | 51.3 | 15.6 | 35.5 | 14.3 | 50.3 | 21.2 | | Q2:2016-17 | 723 | 29.3 | 20.4 | 50.3 | 9.0 | 38.1 | 10.8 | 51.1 | 27.3 | | Q3:2016-17 | 1221 | 29.1 | 22.0 | 48.9 | 7.1 | 36.4 | 11.7 | 51.9 | 24.7 | | Q4:2016-17 | 1244 | 34.8 | 19.2 | 46.0 | 15.6 | 35.1 | 14.2 | 50.7 | 20.9 | | Q1:2017-18 | | | | | | 39.5 | 11.5 | 49.0 | 28.0 | | ‘Increase’ in order books is optimistic. Footnotes ‘@’ and ‘#’ given in Table 2.1 are applicable here. |
| Table 2.3: Assessment & Expectation – Pending Orders | | (Percentage responses) | | Quarter | Total response | Assessment | Expectation | | Below Normal | Above Normal | Normal | Net response | Below Normal | Above Normal | Normal | Net response | | Q1:2015-16 | 1299 | 18.6 | 5.1 | 76.3 | 13.6 | 13.1 | 6.9 | 80.1 | 6.2 | | Q2:2015-16 | 1304 | 18.6 | 5.1 | 76.3 | 13.5 | 14.6 | 6.1 | 79.4 | 8.5 | | Q3:2015-16 | 1337 | 19.2 | 5.0 | 75.8 | 14.3 | 14.1 | 6.5 | 79.4 | 7.6 | | Q4:2015-16 | 1342 | 18.2 | 4.3 | 77.4 | 13.9 | 13.3 | 7.0 | 79.7 | 6.3 | | Q1:2016-17 | 1275 | 16.7 | 5.7 | 77.6 | 11.0 | 15.1 | 4.9 | 80.0 | 10.2 | | Q2:2016-17 | 723 | 18.9 | 5.2 | 75.9 | 13.7 | 12.9 | 6.3 | 80.8 | 6.6 | | Q3:2016-17 | 1222 | 19.0 | 5.3 | 75.7 | 13.7 | 12.9 | 6.7 | 80.4 | 6.2 | | Q4:2016-17 | 1244 | 18.1 | 5.1 | 76.9 | 13.0 | 15.3 | 5.0 | 79.7 | 10.3 | | Q1:2017-18 | | | | | | 13.4 | 4.9 | 81.8 | 8.5 | | Pending orders ‘Below Normal’ is optimistic. Footnotes ‘@’ and ‘#’ given in Table 2.1 are applicable here. |
| Table 2.4: Assessment & Expectation – Capacity Utilisation (Main Product) | | (Percentage responses) | | Quarter | Total response | Assessment | Expectation | | Increase | Decrease | No change | Net response | Increase | Decrease | No change | Net response | | Q1:2015-16 | 1299 | 23.3 | 16.7 | 60.0 | 6.7 | 27.5 | 8.8 | 63.7 | 18.7 | | Q2:2016-16 | 1304 | 21.7 | 18.1 | 60.2 | 3.6 | 27.7 | 10.2 | 62.1 | 17.6 | | Q3:2015-16 | 1337 | 23.4 | 16.3 | 60.4 | 7.1 | 27.8 | 10.2 | 62.0 | 17.5 | | Q4:2015-16 | 1342 | 24.6 | 17.5 | 57.9 | 7.1 | 27.8 | 8.7 | 63.5 | 19.1 | | Q1:2016-17 | 1275 | 21.8 | 15.1 | 63.1 | 6.7 | 26.3 | 12.9 | 60.8 | 13.4 | | Q2:2016-17 | 723 | 21.5 | 17.9 | 60.7 | 3.6 | 26.5 | 9.7 | 63.9 | 16.8 | | Q3:2016-17 | 1222 | 20.2 | 17.9 | 61.9 | 2.3 | 27.4 | 10.2 | 62.5 | 17.2 | | Q4:2016-17 | 1244 | 25.9 | 15.7 | 58.4 | 10.2 | 27.6 | 11.2 | 61.2 | 16.4 | | Q1:2017-18 | | | | | | 28.1 | 10.9 | 61.0 | 17.2 | | ‘Increase’ in capacity utilisation is optimistic. Footnotes ‘@’ and ‘#’ given in Table 2.1 are applicable here. |
| Table 2.5: Assessment & Expectation – Level of CU (compared to the average in last 4 quarters) | | (Percentage responses) | | Quarter | Total response | Assessment | Expectation | | Above Normal | Below Normal | Normal | Net response | Above Normal | Below Normal | Normal | Net response | | Q1:2015-16 | 1299 | 10.2 | 18.6 | 71.3 | -8.4 | 12.1 | 12.3 | 75.6 | -0.2 | | Q2:2016-16 | 1304 | 8.8 | 19.3 | 71.9 | -10.5 | 10.5 | 13.9 | 75.5 | -3.4 | | Q3:2015-16 | 1337 | 8.7 | 18.6 | 72.6 | -9.9 | 9.2 | 13.1 | 77.6 | -3.9 | | Q4:2015-16 | 1342 | 9.8 | 19.2 | 71.0 | -9.4 | 9.4 | 12.4 | 78.2 | -3.0 | | Q1:2016-17 | 1275 | 10.9 | 16.6 | 72.5 | -5.7 | 9.8 | 14.6 | 75.6 | -4.8 | | Q2:2016-17 | 723 | 9.3 | 15.4 | 75.3 | -6.0 | 10.3 | 11.9 | 77.8 | -1.6 | | Q3:2016-17 | 1222 | 8.7 | 16.4 | 74.9 | -7.7 | 10.8 | 11.5 | 77.7 | -0.7 | | Q4:2016-17 | 1244 | 9.3 | 16.1 | 74.6 | -6.8 | 10.6 | 12.9 | 76.5 | -2.3 | | Q1:2017-18 | | | | | | 9.9 | 12.2 | 77.9 | -2.3 | | ‘Above Normal’ in Level of capacity utilisation is optimistic. Footnotes ‘@’ and ‘#’ given in Table 2.1 are applicable here. |
| Table 2.6: Assessment & Expectation – Assessment of Production Capacity (with regard to expected demand in next 6 months) | | (Percentage responses) | | Quarter | Total response | Assessment | Expectation | | More than adequate | Less than adequate | Adequate | Net response | More than adequate | Less than adequate | Adequate | Net response | | Q1:2015-16 | 1299 | 15.1 | 8.0 | 76.9 | 7.2 | 13.9 | 6.9 | 79.2 | 7.0 | | Q2:2016-16 | 1304 | 14.1 | 7.7 | 78.3 | 6.4 | 15.8 | 6.8 | 77.5 | 9.0 | | Q3:2015-16 | 1337 | 14.3 | 8.5 | 77.2 | 5.8 | 14.4 | 6.8 | 78.8 | 7.5 | | Q4:2015-16 | 1342 | 13.9 | 8.5 | 77.7 | 5.4 | 14.5 | 7.0 | 78.5 | 7.5 | | Q1:2016-17 | 1275 | 14.6 | 8.6 | 76.8 | 6.0 | 13.8 | 7.1 | 79.1 | 6.7 | | Q2:2016-17 | 723 | 14.4 | 8.2 | 77.3 | 6.2 | 13.6 | 7.6 | 78.8 | 6.0 | | Q3:2016-17 | 1222 | 12.3 | 9.1 | 78.6 | 3.2 | 14.2 | 7.4 | 78.4 | 6.8 | | Q4:2016-17 | 1244 | 14.1 | 7.1 | 78.7 | 7.0 | 11.9 | 7.4 | 80.7 | 4.5 | | Q1:2017-18 | | | | | | 13.3 | 6.7 | 79.9 | 6.6 | | (Percentage responses) ‘More than adequate’ in Assessment of Production Capacity is optimistic. Footnotes ‘@’ and ‘#’ given in Table 2.1 are applicable here. |
| Table 2.7: Assessment & Expectation – Exports | | (Percentage responses) | | Quarter | Total response | Assessment | Expectation | | Increase | Decrease | No change | Net response | Increase | Decrease | No change | Net response | | Q1:2015-16 | 1299 | 24.1 | 14.0 | 62.0 | 10.1 | 27.6 | 8.1 | 64.3 | 19.5 | | Q2:2015-16 | 1304 | 23.5 | 17.8 | 58.7 | 5.7 | 27.5 | 8.0 | 64.5 | 19.6 | | Q3:2015-16 | 1337 | 23.3 | 17.7 | 59.0 | 5.7 | 27.3 | 10.6 | 62.1 | 16.7 | | Q4:2015-16 | 1342 | 22.1 | 18.8 | 59.1 | 3.3 | 26.9 | 10.0 | 63.1 | 16.9 | | Q1:2016-17 | 1275 | 21.5 | 15.3 | 63.1 | 6.2 | 25.7 | 12.0 | 62.3 | 13.7 | | Q2:2016-17 | 723 | 19.8 | 20.6 | 59.6 | -0.8 | 26.3 | 9.5 | 64.2 | 16.8 | | Q3:2016-17 | 1221 | 22.9 | 18.5 | 58.6 | 4.4 | 24.3 | 13.2 | 62.5 | 11.2 | | Q4:2016-17 | 1244 | 24.3 | 17.7 | 58.0 | 6.6 | 25.3 | 13.2 | 61.5 | 12.1 | | Q1:2017-18 | | | | | | 26.5 | 11.3 | 62.2 | 15.2 | | ‘Increase’ in exports is optimistic. Footnotes ‘@’ and ‘#’ given in Table 2.1 are applicable here. |
| Table 2.8: Assessment & Expectation – Imports | | (Percentage responses) | | Quarter | Total response | Assessment | Expectation | | Increase | Decrease | No change | Net response | Increase | Decrease | No change | Net response | | Q1:2015-16 | 1299 | 19.8 | 9.1 | 71.0 | 10.7 | 20.3 | 7.9 | 71.8 | 12.4 | | Q2:2015-16 | 1304 | 18.8 | 10.4 | 70.7 | 8.4 | 18.0 | 8.1 | 73.9 | 9.9 | | Q3:2015-16 | 1337 | 17.2 | 11.1 | 71.8 | 6.1 | 18.0 | 8.8 | 73.2 | 9.2 | | Q4:2015-16 | 1342 | 17.6 | 12.9 | 69.4 | 4.7 | 16.4 | 8.6 | 75.0 | 7.7 | | Q1:2016-17 | 1275 | 18.1 | 9.7 | 72.3 | 8.4 | 16.7 | 10.9 | 72.4 | 5.8 | | Q2:2016-17 | 723 | 17.5 | 10.6 | 71.9 | 7.0 | 17.5 | 7.9 | 74.6 | 9.6 | | Q3:2016-17 | 1221 | 17.9 | 11.7 | 70.4 | 6.2 | 18.1 | 9.4 | 72.5 | 8.7 | | Q4:2016-17 | 1244 | 17.5 | 10.7 | 71.8 | 6.8 | 17.7 | 9.3 | 73.1 | 8.4 | | Q1:2017-18 | | | | | | 17.3 | 7.2 | 75.5 | 10.1 | | ‘Increase’ in imports is optimistic. Footnotes ‘@’ and ‘#’ given in Table 2.1 are applicable here. |
| Table 2.9: Assessment & Expectation – Level of Raw Materials Inventory | | (Percentage responses) | | Quarter | Total response | Assessment | Expectation | | Below average | Above average | Average | Net response | Below average | Above average | Average | Net response | | Q1:2015-16 | 1299 | 6.5 | 14.2 | 79.3 | -7.7 | 7.1 | 10.0 | 83.0 | -2.9 | | Q2:2015-16 | 1304 | 7.4 | 13.7 | 78.9 | -6.3 | 5.5 | 11.5 | 83.0 | -6.0 | | Q3:2015-16 | 1337 | 6.5 | 12.2 | 81.4 | -5.7 | 5.5 | 10.6 | 83.9 | -5.1 | | Q4:2015-16 | 1342 | 7.0 | 12.5 | 80.5 | -5.5 | 5.3 | 9.9 | 84.8 | -4.7 | | Q1:2016-17 | 1275 | 6.0 | 12.4 | 81.7 | -6.4 | 5.9 | 9.7 | 84.4 | -3.8 | | Q2:2016-17 | 723 | 7.0 | 11.8 | 81.2 | -4.8 | 5.8 | 10.8 | 83.5 | -5.0 | | Q3:2016-17 | 1221 | 7.3 | 11.7 | 81.2 | -4.4 | 5.2 | 10.3 | 84.5 | -5.2 | | Q4:2016-17 | 1244 | 6.9 | 12.4 | 81.1 | -5.5 | 6.8 | 9.0 | 84.2 | -2.2 | | Q1:2017-18 | | | | | | 6.1 | 8.7 | 85.2 | -2.6 | | ‘Below average’ Inventory of raw materials is optimistic. Footnotes ‘@’ and ‘#’ given in Table 2.1 are applicable here. |
| Table 2.10: Assessment & Expectation – Level of Finished Goods Inventory | | (Percentage responses) | | Quarter | Total response | Assessment | Expectation | | Below average | Above average | Average | Net response | Below average | Above average | Average | Net response | | Q1:2015-16 | 1299 | 7.2 | 18.1 | 74.7 | -10.9 | 5.8 | 13.4 | 80.9 | -7.6 | | Q2:2015-16 | 1304 | 6.9 | 17.5 | 75.6 | -10.6 | 6.4 | 14.6 | 78.9 | -8.2 | | Q3:2015-16 | 1337 | 7.0 | 17.4 | 75.7 | -10.4 | 6.3 | 11.6 | 82.1 | -5.3 | | Q4:2015-16 | 1342 | 8.7 | 15.4 | 75.9 | -6.7 | 6.2 | 12.1 | 81.6 | -5.9 | | Q1:2016-17 | 1275 | 7.0 | 15.3 | 77.7 | -8.3 | 7.0 | 11.1 | 81.9 | -4.9 | | Q2:2016-17 | 723 | 6.7 | 15.8 | 77.5 | -9.0 | 7.1 | 12.1 | 80.8 | -5.0 | | Q3:2016-17 | 1221 | 6.4 | 15.3 | 78.3 | -8.9 | 4.5 | 12.5 | 83.0 | -7.9 | | Q4:2016-17 | 1244 | 7.3 | 16.6 | 76.1 | -9.3 | 6.5 | 11.6 | 81.9 | -5.1 | | Q1:2017-18 | | | | | | 6.4 | 10.7 | 82.8 | -4.3 | | ‘Below average’ Inventory of finished goods is optimistic. Footnotes ‘@’ and ‘#’ given in Table 2.1 are applicable here. |
| Table 2.11: Assessment & Expectations – Employment | | (Percentage responses) | | Quarter | Total response | Assessment | Expectation | | Increase | Decrease | No change | Net response | Increase | Decrease | No change | Net response | | Q1:2015-16 | 1299 | 16.7 | 9.3 | 74.0 | 7.4 | 15.8 | 7.0 | 77.2 | 8.8 | | Q2:2015-16 | 1304 | 15.2 | 9.3 | 75.5 | 5.9 | 16.5 | 6.6 | 76.8 | 9.9 | | Q3:2015-16 | 1337 | 15.3 | 9.4 | 75.3 | 5.8 | 15.7 | 6.1 | 78.2 | 9.6 | | Q4:2015-16 | 1342 | 14.2 | 10.1 | 75.7 | 4.1 | 15.3 | 6.7 | 78.0 | 8.6 | | Q1:2016-17 | 1275 | 15.0 | 9.7 | 75.3 | 5.3 | 15.1 | 8.0 | 76.9 | 7.1 | | Q2:2016-17 | 723 | 14.5 | 7.7 | 77.8 | 6.8 | 15.8 | 7.7 | 76.5 | 8.1 | | Q3:2016-17 | 1221 | 13.5 | 9.7 | 76.8 | 3.8 | 14.7 | 5.6 | 79.7 | 9.1 | | Q4:2016-17 | 1244 | 15.9 | 9.3 | 74.8 | 6.6 | 12.1 | 6.9 | 81.0 | 5.2 | | Q1:2017-18 | | | | | | 15.9 | 6.6 | 77.5 | 9.3 | | ‘Increase’ in employment is optimistic. Footnotes ‘@’ and ‘#’ given in Table 2.1 are applicable here. |
| Table 2.12: Assessment & Expectation – Overall Financial Situation | | (Percentage responses) | | Quarter | Total response | Assessment | Expectation | | Better | Worsen | No change | Net response | Better | Worsen | No change | Net response | | Q1:2015-16 | 1299 | 27.9 | 13.2 | 59.1 | 14.4 | 34.3 | 8.0 | 57.7 | 26.3 | | Q2:2015-16 | 1304 | 27.5 | 14.0 | 58.6 | 13.5 | 34.2 | 9.1 | 56.7 | 25.1 | | Q3:2015-16 | 1337 | 26.2 | 12.9 | 60.9 | 13.2 | 34.8 | 8.8 | 56.4 | 26.0 | | Q4:2015-16 | 1342 | 26.6 | 12.3 | 61.0 | 14.3 | 33.3 | 8.5 | 58.2 | 24.7 | | Q1:2016-17 | 1275 | 27.9 | 11.9 | 60.1 | 16.0 | 33.1 | 8.3 | 58.6 | 24.8 | | Q2:2016-17 | 723 | 27.7 | 11.3 | 61.1 | 16.4 | 35.2 | 8.3 | 56.5 | 26.9 | | Q3:2016-17 | 1221 | 26.0 | 14.1 | 59.9 | 11.9 | 33.9 | 6.8 | 59.3 | 27.1 | | Q4:2016-17 | 1244 | 30.6 | 13.6 | 55.9 | 17.0 | 34.1 | 9.5 | 56.4 | 24.6 | | Q1:2017-18 | | | | | | 37.9 | 7.0 | 55.1 | 30.9 | | ‘Better’ overall financial situation is optimistic. Footnotes ‘@’ and ‘#’ given in Table 2.1 are applicable here. |
| Table 2.13: Assessment & Expectation – Working Capital Finance Requirement | | (Percentage responses) | | Quarter | Total response | Assessment | Expectation | | Increase | Decrease | No change | Net response | Increase | Decrease | No change | Net response | | Q1:2015-16 | 1299 | 30.2 | 6.8 | 63.0 | 23.5 | 32.3 | 5.1 | 62.6 | 27.2 | | Q2:2015-16 | 1304 | 30.2 | 6.0 | 63.8 | 24.2 | 29.6 | 4.7 | 65.7 | 25.0 | | Q3:2015-16 | 1337 | 30.3 | 6.7 | 62.9 | 23.6 | 29.9 | 4.3 | 65.8 | 25.5 | | Q4:2015-16 | 1342 | 31.7 | 6.8 | 61.4 | 24.9 | 30.1 | 4.9 | 65.0 | 25.2 | | Q1:2016-17 | 1275 | 28.1 | 7.2 | 64.7 | 20.8 | 30.0 | 5.4 | 64.6 | 24.6 | | Q2:2016-17 | 723 | 26.0 | 6.6 | 67.4 | 19.4 | 29.7 | 5.6 | 64.7 | 24.1 | | Q3:2016-17 | 1221 | 28.9 | 6.9 | 64.3 | 22.0 | 28.1 | 4.1 | 67.8 | 24.1 | | Q4:2016-17 | 1244 | 30.2 | 5.6 | 64.2 | 24.6 | 29.2 | 5.3 | 65.5 | 23.9 | | Q1:2017-18 | | | | | | 29.4 | 5.1 | 65.5 | 24.3 | | ‘Increase’ in working capital finance is optimistic. Footnotes ‘@’ and ‘#’ given in Table 2.1 are applicable here. |
| Table 2.14: Assessment & Expectation – Availability of Finance (from Internal Accruals) | | (Percentage responses) | | Quarter | Total response | Assessment | Expectation | | Improve | Worsen | No change | Net response | Improve | Worsen | No change | Net response | | Q1:2015-16 | 1299 | 21.5 | 10.1 | 68.3 | 11.4 | 24.7 | 6.6 | 68.8 | 18.1 | | Q2:2015-16 | 1304 | 21.1 | 10.8 | 68.1 | 10.4 | 23.9 | 7.2 | 68.9 | 16.7 | | Q3:2015-16 | 1337 | 22.3 | 9.4 | 68.3 | 12.9 | 23.5 | 6.7 | 69.8 | 16.8 | | Q4:2015-16 | 1342 | 21.7 | 9.3 | 69.0 | 12.4 | 26.1 | 6.1 | 67.8 | 20.0 | | Q1:2016-17 | 1275 | 22.4 | 8.9 | 68.6 | 13.5 | 25.6 | 6.1 | 68.3 | 19.5 | | Q2:2016-17 | 723 | 21.0 | 8.5 | 70.5 | 12.5 | 25.9 | 5.8 | 68.3 | 20.1 | | Q3:2016-17 | 1221 | 21.6 | 11.7 | 66.7 | 9.9 | 25.2 | 5.0 | 69.8 | 20.2 | | Q4:2016-17 | 1244 | 25.6 | 10.3 | 64.1 | 15.3 | 25.4 | 8.0 | 66.6 | 17.4 | | Q1:2017-18 | | | | | | 27.5 | 6.2 | 66.3 | 21.3 | | ‘Improvement’ in availability of finance is optimistic. Footnotes ‘@’ and ‘#’ given in Table 2.1 are applicable here. |
| Table 2.15: Assessment & Expectation – Availability of Finance (from banks & other sources) | | (Percentage responses) | | Quarter | Total response | Assessment | Expectation | | Improve | Worsen | No change | Net response | Improve | Worsen | No change | Net response | | Q1:2015-16 | 1299 | 19.1 | 5.4 | 75.6 | 13.7 | 22.6 | 4.9 | 72.4 | 17.7 | | Q2:2015-16 | 1304 | 19.3 | 5.7 | 75.0 | 13.6 | 21.2 | 3.8 | 75.0 | 17.3 | | Q3:2015-16 | 1337 | 19.2 | 6.3 | 74.4 | 12.9 | 20.0 | 3.8 | 76.3 | 16.2 | | Q4:2015-16 | 1342 | 18.3 | 7.5 | 74.2 | 10.8 | 20.6 | 4.7 | 74.7 | 16.0 | | Q1:2016-17 | 1275 | 18.7 | 7.7 | 73.6 | 11.0 | 21.6 | 5.2 | 73.2 | 16.4 | | Q2:2016-17 | 723 | 18.3 | 5.6 | 76.1 | 12.7 | 21.7 | 5.5 | 72.7 | 16.2 | | Q3:2016-17 | 1221 | 19.6 | 7.9 | 72.5 | 11.7 | 21.8 | 3.3 | 74.9 | 18.5 | | Q4:2016-17 | 1244 | 21.3 | 7.6 | 71.1 | 13.7 | 22.5 | 5.6 | 71.9 | 16.9 | | Q1:2017-18 | | | | | | 24.8 | 4.9 | 70.3 | 19.9 | | ‘Improvement’ in availability of finance is optimistic. Footnotes ‘@’ and ‘#’ given in Table 2.1 are applicable here. |
| Table 2.16: Assessment & Expectation – Availability of Finance (from overseas, if applicable) | | (Percentage responses) | | Quarter | Total response | Assessment | Expectation | | Improve | Worsen | No change | Net response | Improve | Worsen | No change | Net response | | Q1:2015-16 | 1299 | 13.0 | 4.8 | 82.2 | 8.2 | 14.4 | 4.0 | 81.6 | 10.4 | | Q2:2015-16 | 1304 | 11.1 | 5.0 | 83.9 | 6.1 | 12.9 | 3.5 | 83.6 | 9.3 | | Q3:2015-16 | 1337 | 11.3 | 5.2 | 83.5 | 6.2 | 11.5 | 3.5 | 85.0 | 8.0 | | Q4:2015-16 | 1342 | 8.8 | 5.9 | 85.3 | 2.9 | 12.1 | 3.9 | 84.1 | 8.2 | | Q1:2016-17 | 1275 | 10.6 | 5.0 | 84.4 | 5.6 | 10.0 | 4.7 | 85.4 | 5.3 | | Q2:2016-17 | 723 | 10.0 | 3.3 | 86.6 | 6.7 | 12.2 | 3.8 | 84.1 | 8.4 | | Q3:2016-17 | 1221 | 9.1 | 4.8 | 86.1 | 4.3 | 10.3 | 2.0 | 87.7 | 8.3 | | Q4:2016-17 | 1244 | 8.1 | 3.3 | 88.6 | 4.8 | 10.0 | 3.5 | 86.5 | 6.5 | | Q1:2017-18 | | | | | | 9.8 | 2.8 | 87.4 | 7.0 | | ‘Improvement’ in availability of finance is optimistic. Footnotes ‘@’ and ‘#’ given in Table 2.1 are applicable here. |
| Table 2.17: Assessment & Expectation – Cost of Finance | | (Percentage responses) | | Quarter | Total response | Assessment | Expectation | | Decrease | Increase | No change | Net response | Decrease | Increase | No change | Net response | | Q1:2015-16 | 1299 | 10.2 | 22.3 | 67.5 | -12.1 | 8.8 | 21.8 | 69.4 | -13.0 | | Q2:2015-16 | 1304 | 9.4 | 20.8 | 69.7 | -11.4 | 9.9 | 18.7 | 71.4 | -8.7 | | Q3:2015-16 | 1337 | 14.0 | 19.4 | 66.6 | -5.4 | 10.2 | 17.9 | 71.9 | -7.6 | | Q4:2015-16 | 1342 | 11.0 | 19.7 | 69.2 | -8.7 | 10.5 | 15.9 | 73.6 | -5.5 | | Q1:2016-17 | 1275 | 10.1 | 19.9 | 70.0 | -9.8 | 8.8 | 17.1 | 74.1 | -8.3 | | Q2:2016-17 | 723 | 9.4 | 17.3 | 73.3 | -7.9 | 9.9 | 17.4 | 72.6 | -7.5 | | Q3:2016-17 | 1221 | 12.9 | 16.1 | 71.1 | -3.2 | 9.4 | 16.9 | 73.8 | -7.5 | | Q4:2016-17 | 1244 | 15.8 | 16.7 | 67.6 | -0.9 | 14.5 | 14.8 | 70.8 | -0.3 | | Q1:2017-18 | | | | | | 12.9 | 15.4 | 71.7 | -2.5 | | ‘Decrease’ in cost of finance is optimistic. Footnotes ‘@’ and ‘#’ given in Table 2.1 are applicable here. |
| Table 2.18: Assessment & Expectation – Cost of Raw Materials | | (Percentage responses) | | Quarter | Total response | Assessment | Expectation | | Decrease | Increase | No change | Net response | Decrease | Increase | No change | Net response | | Q1:2015-16 | 1299 | 8.6 | 44.5 | 46.9 | -35.9 | 6.0 | 38.8 | 55.2 | -32.8 | | Q2:2015-16 | 1304 | 13.2 | 38.1 | 48.7 | -24.8 | 5.2 | 38.1 | 56.6 | -32.9 | | Q3:2015-16 | 1337 | 12.4 | 38.7 | 48.9 | -26.4 | 7.1 | 35.2 | 57.7 | -28.1 | | Q4:2015-16 | 1342 | 13.3 | 37.7 | 49.0 | -24.4 | 6.9 | 34.2 | 58.9 | -27.3 | | Q1:2016-17 | 1275 | 7.5 | 41.5 | 51.0 | -34.0 | 8.3 | 36.0 | 55.7 | -27.7 | | Q2:2016-17 | 723 | 4.2 | 43.1 | 52.7 | -39.0 | 6.0 | 37.5 | 56.5 | -31.5 | | Q3:2016-17 | 1221 | 6.4 | 44.6 | 48.9 | -38.2 | 5.5 | 37.4 | 57.1 | -32.0 | | Q4:2016-17 | 1244 | 3.5 | 51.4 | 45.0 | -47.9 | 5.1 | 39.4 | 55.6 | -34.3 | | Q1:2017-18 | | | | | | 4.1 | 42.0 | 54.0 | -37.9 | | ‘Decrease’ in cost of raw materials is optimistic. Footnotes ‘@’ and ‘#’ given in Table 2.1 are applicable here. |
| Table 2.19: Assessment & Expectation – Selling Price | | (Percentage responses) | | Quarter | Total response | Assessment | Expectation | | Increase | Decrease | No change | Net response | Increase | Decrease | No change | Net response | | Q1:2015-16 | 1299 | 18.3 | 15.2 | 66.5 | 3.1 | 19.1 | 8.8 | 72.1 | 10.3 | | Q2:2015-16 | 1304 | 15.8 | 19.8 | 64.4 | -4.0 | 19.5 | 11.6 | 68.8 | 7.9 | | Q3:2015-16 | 1337 | 16.7 | 18.0 | 65.3 | -1.4 | 18.3 | 12.2 | 69.5 | 6.2 | | Q4:2015-16 | 1342 | 15.9 | 19.6 | 64.5 | -3.7 | 17.9 | 10.7 | 71.4 | 7.2 | | Q1:2016-17 | 1275 | 18.9 | 13.2 | 67.9 | 5.7 | 20.2 | 13.1 | 66.7 | 7.1 | | Q2:2016-17 | 723 | 16.5 | 14.5 | 69.0 | 2.0 | 19.8 | 9.7 | 70.5 | 10.1 | | Q3:2016-17 | 1221 | 16.9 | 16.2 | 66.9 | 0.7 | 17.2 | 10.4 | 72.4 | 6.8 | | Q4:2016-17 | 1244 | 21.4 | 13.0 | 65.6 | 8.4 | 16.8 | 10.9 | 72.3 | 5.9 | | Q1:2017-18 | | | | | | 21.6 | 9.1 | 69.3 | 12.5 | | ‘Increase’ in selling price is optimistic. Footnotes ‘@’ and ‘#’ given in Table 2.1 are applicable here. |
| Table 2.20: Assessment & Expectation – Profit Margin | | (Percentage responses) | | Quarter | Total response | Assessment | Expectation | | Increase | Decrease | No change | Net response | Increase | Decrease | No change | Net response | | Q1:2015-16 | 1299 | 14.2 | 28.5 | 57.3 | -14.2 | 18.8 | 19.3 | 61.9 | -0.5 | | Q2:2015-16 | 1304 | 13.1 | 30.0 | 56.9 | -16.9 | 18.5 | 20.0 | 61.5 | -1.6 | | Q3:2015-16 | 1337 | 14.3 | 29.5 | 56.2 | -15.3 | 18.4 | 19.7 | 61.9 | -1.3 | | Q4:2015-16 | 1342 | 13.4 | 30.1 | 56.5 | -16.7 | 18.1 | 20.1 | 61.8 | -2.0 | | Q1:2016-17 | 1275 | 14.4 | 27.4 | 58.2 | -12.8 | 18.5 | 22.1 | 59.4 | -3.6 | | Q2:2016-17 | 723 | 15.8 | 28.8 | 55.4 | -12.9 | 19.1 | 19.3 | 61.6 | -0.2 | | Q3:2016-17 | 1221 | 15.3 | 28.3 | 56.4 | -13.0 | 19.5 | 19.4 | 61.2 | 0.1 | | Q4:2016-17 | 1244 | 16.7 | 27.8 | 55.5 | -11.1 | 18.5 | 21.3 | 60.2 | -2.8 | | Q1:2017-18 | | | | | | 20.3 | 19.2 | 60.4 | 1.1 | | ‘Increase’ in profit margin is optimistic. Footnotes ‘@’ and ‘#’ given in Table 2.1 are applicable here. |
| Table 2.21: Assessment & Expectation – Overall Business Situation | | (Percentage responses) | | Quarter | Total response | Assessment | Expectation | | Better | Worsen | No change | Net response | Better | Worsen | No change | Net response | | Q1:2015-16 | 1299 | 32.5 | 12.9 | 54.6 | 19.6 | 42.7 | 6.7 | 50.6 | 36.0 | | Q2:2015-16 | 1304 | 30.2 | 16.3 | 53.6 | 13.9 | 40.3 | 8.2 | 51.5 | 32.0 | | Q3:2015-16 | 1337 | 31.3 | 14.0 | 54.7 | 17.4 | 39.9 | 8.3 | 51.8 | 31.6 | | Q4:2015-16 | 1342 | 30.8 | 14.6 | 54.6 | 16.2 | 40.9 | 7.6 | 51.5 | 33.3 | | Q1:2016-17 | 1275 | 33.3 | 12.1 | 54.6 | 21.2 | 39.4 | 8.9 | 51.7 | 30.5 | | Q2:2016-17 | 723 | 31.4 | 14.0 | 54.6 | 17.4 | 41.2 | 7.7 | 51.1 | 33.5 | | Q3:2016-17 | 1221 | 29.4 | 16.4 | 54.2 | 13.0 | 40.1 | 8.7 | 51.2 | 31.3 | | Q4:2016-17 | 1244 | 36.3 | 14.3 | 49.5 | 22.0 | 39.4 | 11.5 | 49.1 | 27.9 | | Q1:2017-18 | | | | | | 43.6 | 7.6 | 48.8 | 36.0 | | ‘Better’ Overall Business Situation is optimistic . Footnotes ‘@’ and ‘#’ given in Table 2.1 are applicable here. |
| Table 2.22: Assessment & Expectation – Salary/Other Remuneration | | (Percentage responses) | | Quarter | Total response | Assessment | Expectation | | Increase | Decrease | No change | Net response | Increase | Decrease | No change | Net response | | Q1:2015-16 | 1299 | 36.9 | 2.6 | 60.5 | 34.2 | 27.4 | 3.9 | 68.7 | 23.5 | | Q2:2015-16 | 1304 | 31.7 | 2.8 | 65.6 | 28.9 | 30.0 | 2.7 | 67.3 | 27.3 | | Q3:2015-16 | 1337 | 28.4 | 3.2 | 68.4 | 25.1 | 24.3 | 2.3 | 73.4 | 22.0 | | Q4:2015-16 | 1342 | 30.5 | 3.0 | 66.5 | 27.5 | 25.0 | 2.8 | 72.2 | 22.1 | | Q1:2016-17 | 1275 | 34.9 | 2.9 | 62.2 | 32.0 | 33.2 | 2.9 | 63.9 | 30.3 | | Q2:2016-17 | 723 | 35.8 | 3.0 | 61.2 | 32.8 | 30.0 | 3.1 | 66.9 | 26.9 | | Q3:2016-17 | 1222 | 28.9 | 2.8 | 68.3 | 26.1 | 26.6 | 2.0 | 71.4 | 24.7 | | Q4:2016-17 | 1244 | 30.0 | 2.7 | 67.3 | 27.3 | 25.0 | 3.3 | 71.8 | 21.7 | | Q1:2017-18 | | | | | | 38.8 | 2.2 | 59 | 36.6 | | ‘Increase in Salary / other remuneration’ is optimistic. Footnotes ‘@’ and ‘#’ given in Table 2.1 are applicable here. |
|