The aggregate results of the select non-government nonfinancial public limited companies in 2013-14 revealed moderation in growth rates of major parameters as compared to those in 2012-13. Growth in earnings before interest, tax, depreciation and amortisation (EBITDA) declined and net profit contracted in 2013-14. Profit margin and return on equity declined in most segments in 2013-14. Leverage of the companies continued to increase and interest coverage ratio witnessed declining trend. There was increase in funds raised through external sources by the companies. Share of funds used for fixed assets formation was lower whereas that of non-current investment was higher. This article presents the financial performance of select 4,388 non-government non-financial (NGNF) public limited companies for the financial year 2013-14 based on their audited annual accounts during the period April 2013 to March 20141. Revision in the Schedule VI of Companies' Act 1956 effective financial year 2011-12 brought about significant changes in the format of preparing financial statements, especially balance sheet, by companies. The current study analyses data in the revised format for the three year period from 2011-12 to 2013-14. The detailed data have been made available in the website of the Reserve Bank. The select 4,388 companies covered in the latest data release accounted for 32 per cent of population paid-up capital (PUC) (provisional estimate supplied by Ministry of Corporate Affairs, GoI) of all NGNF public limited companies as on March 31, 2014. 1. Sales growth decelerated and net profit contracted 1.1. The performance of select NGNF public limited companies deteriorated in 2013-14. Growth in sales as well as operating expenses declined in 2013-14 indicating lower demand (Statement 1 and Chart 1). Earnings before interest, tax, depreciation and amortisation (EBITDA) witnessed a lower growth of 5.3 per cent as compared to 7.9 per cent increase in the previous year. Net profit (PAT) contracted by 1.1 per cent in 2013-14 as compared to 4.5 per cent increase in the previous year. 1.2. The share of major expenditure items as percentage of sales revealed that expenditure on 'raw materials' declined continuously during the study period, i.e., 2011-12 to 2013-14. On the other hand, 'staff cost' and interest expenses increased gradually during this period (Table 1). 1.3. The smallest sales-size2companies i.e., companies with their sales 'less than `1 billion' experienced contraction in sales as well as in operating profits in both the years 2012-13 and 2013-14. Companies having sales between `1 billion to `5 billion registered contraction in net profits in both the years. Even for the largest sale-size companies (companies with sales greater than `10 billion and above), sales as well as net profit growth declined in 2013-14 as compared to previous year. | Table 1: Major items as share of sales | | (Per cent) | | Item | 2011-12 | 2012-13 | 2013-14 | | Raw Materials | 56.6 | 56.1 | 54.7 | | Staff Cost | 7.1 | 7.4 | 7.9 | | Interest Expenses | 3.4 | 3.7 | 4.0 | | Other Income | 2.0 | 2.1 | 2.2 |
1.4. Construction sector continued to register contraction in sales as well in net profits in both the years. Services sector witnessed decline in EBITDA growth due to higher growth in operating expenses. Companies in 'electricity, gas, steam and air conditioning supply' improved their EBITDA as well as net profits growth in 2013-14 (Statement 1). 1.5. Performance of various industries in the manufacturing sector in 2013-14 was mixed. 'Chemical and Chemical products' industry and 'electrical machinery and apparatus' industry recorded improvement in sales growth in 2013-14 over 2012-13 contrary to general trend. 'Electrical machinery and apparatus' as well as 'machinery and equipments' industry recorded improvement in net profit growth in 2013-14 as compared to previous year. Net profit growth in the 'pharmaceuticals and medicines' industry slowed down sharply. 'Iron and steel' as well as 'cement and cement products' industry recorded contraction in profit in both the years, whereas for 'textile' and 'chemical and chemical products' industries, net profit witnessed contraction in the current year. 1.6. In the services sector, aggregate sales as well as profit of the companies in 'real estate' industry contracted in 2013-14. 'Transportation' industry's profit recorded sharp fall in 2013-14. In contrast, companies in 'telecommunications' as well as 'computer and related activities' industries recorded higher growth in profits in 2013-14 as compared to the previous year. 2. Profit Margin as well as return on equity declined in most segments 2.1. The operating profit margin or EBITDA margin (EBITDA as percentage of sales) of select public limited companies declined from13.0 per cent in 2012-13 to 12.8 per cent in 2013-14. Return on equity (PAT as a percentage of net worth) also declined in the similar way (Chart 2). 2.2. The fall in profit margin was observed across all sales-size groups except for companies in the largest sales-size group which recorded an average EBITDA margin of 13.5 per cent in the last two years (Statement 2). Return on equity declined for all sales size groups except for companies having sales-size between `1 billion to `10 billion which witnessed marginal increase. 2.3. Profit margin for 'electricity, gas, steam and air conditioning supply' sector improved in 2013-14 as compared with 2012-13, while for other sectors, it declined. 'Mining and quarrying' sector recorded the highest profit margin in 2013-14 among all sectors but witnessed a sharp decline from 38.3 per cent in 2012-13 to 23.4 per cent in 2013-14. Profit margin of companies manufacturing machinery and motor vehicles improved marginally in 2013-14 as compared to 2012-13. Companies in 'food products and beverages' industry in manufacturing sector recorded the lowest profit margin (Statement 2). 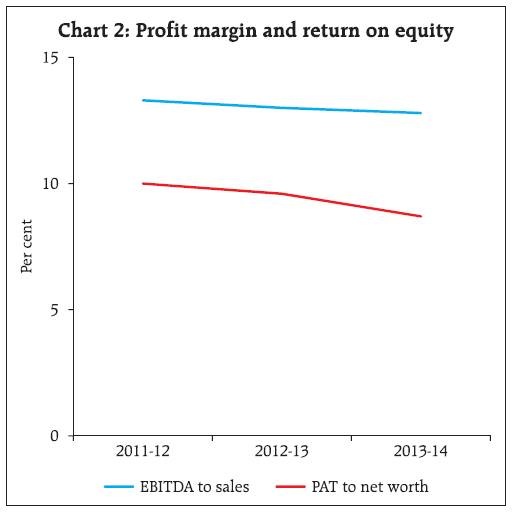 2.4. During 2013-14, return on equity was the highest in services sector followed by 'mining and quarrying' and 'manufacturing' sector. Return on equity for the 'construction' sector was the lowest during the study period. 'Food products and beverages' industry in the manufacturing sector recorded loss in 2013-14 as compared to the previous year mainly on account of sugar industry. Among services sector, 'transportation' industry recorded loss at the aggregate in 2013-14. 3. Marginal improvement in total net assets for select companies 3.1. The total net assets growth of select companies witnessed a marginal improvement in 2013-14 over 2012-13 (from 10.1 per cent to 10.2 per cent). Total net assets of companies in the smallest sales-size group as well as in the largest sales-size group grew at a higher rate (10.1 per cent and 12.2 per cent, respectively) in 2013-14 whereas for the companies in sales-size group '`1 billion - `5 billion' grew at a slower rate. The companies in the sales-size group '`5 billion - `10 billion' suffered contraction in their total net assets (Statement 1). 3.2. Among various sectors, total net assets of companies in services sector as well as in mining sector grew at a higher rate in 2013-14, whereas for the companies in manufacturing, electricity and construction sectors, its growth rate moderated. 3.3. At the industry level, companies in 'pharmaceuticals and medicines', 'electrical machinery', 'transportation', 'telecommunication' and 'computer and related activities' expanded their net assets at a higher rate. 'Food products and beverages', 'textile', 'chemical and chemical products', 'cement and cement products', 'iron and steel', 'machinery and equipments', 'motor vehicles and other transport equipment' and 'real estate' industries recorded decline in net assets growth (Statement 1). 4. Gradual increase in leverage and decline in interest coverage ratio 4.1. Although there was contraction in the net profit of select companies, their net worth grew at a marginally higher rate due to increase in share capital in 2013-14. 4.2. Though there was some deceleration in the growth of total borrowings, it still exceeded the net worth growth. As a result, leverage, as measured by debt (long term borrowings) as a percentage of equity (net worth) has risen steadily in all three years' of study period. A broader measure, viz. total borrowings to equity ratio also presented similar movement and has gone up from 63.2 per cent in 2011-12 to 66.2 per cent in 2013-14. On the other hand, interest coverage ratio (measured by EBIT to interest expenses ratio) which reflects ability of companies to service debt witnessed declining trend from 2011-12 to 2013-14 (Chart 3). 4.3. Companies in the sales-size group '`1 billion-`5 billion' were the most leveraged companies during 2013-14 and their total borrowings to equity ratio increased from 75.4 per cent in 2011-12 to 79.8 per cent in 2013-14. Companies in the sales-size group of '`5 billion- `10 billion' which were the most leveraged till last year witnessed sharp decline in their total borrowings to equity ratio in the current year. Leverage of the largest sales-size group (sales-size greater than `10 billion each) recorded continuous increase (Statement 2). 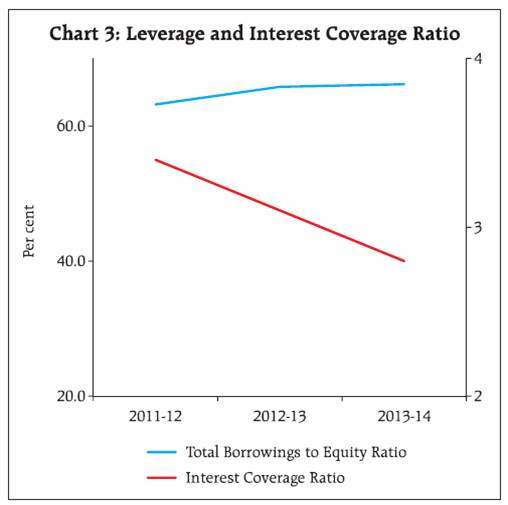 4.4. At sectoral level, services sector and its major constituent industries had relatively lower borrowings to equity ratio except for 'transportation' industry whose ratio was higher at 119.9 per cent in 2013-14 as compared to 108.8 per cent in 2012-13. The manufacturing sector had increasing total borrowings to equity ratio during the past three years mainly due to 'food products and beverages', 'textile', and 'iron and steel' industries (Statement 2). 4.5. Number of companies having low interest coverage ratio (ratio of EBIT to interest expenses less than one i.e., companies unable to service their debt) has increased over the last three years. Such companies accounted for 47.1 per cent share in total paid-up capital of the select 4,388 companies. Their share of long term borrowings (debt) in total borrowings was 66.3 per cent in 2013-14. Similar trend was observed for the loss making companies. Also, though the number of companies with low liquidity ratio i.e., ratio of current assets to current liabilities less than 0.5 was lower; it has been increasing over the years. For such companies, share of long term borrowings to total borrowings is high and has increased in 2013-14 to 76.7 per cent (Table 2). | Table 2: Share of long term borrowings to total borrowings for companies as per different parameters | | (Per cent) | | | Share of Companies | Share in Paid-up Capital | Long term borrowings to total borrowings | | For Companies with ICR<1 | | 2011-12 | 28.3 | 38.4 | 71.3 | | 2012-13 | 29.3 | 39.5 | 71.4 | | 2013-14 | 32.1 | 47.1 | 66.3 | | For Companies with Profitability<0 | | 2011-12 | 23.6 | 35.6 | 70.9 | | 2012-13 | 24.2 | 39.0 | 71.8 | | 2013-14 | 27.0 | 43.0 | 66.2 | | For Companies with liquidity ratio<0.5 | | 2011-12 | 7.7 | 23.7 | 79.5 | | 2012-13 | 7.7 | 18.2 | 75.4 | | 2013-14 | 8.7 | 27.1 | 76.7 |
5. Share of funds raised through external sources increased 5.1. During the three year period, i.e., 2011-12 to 2013-14, composition of liabilities of the select companies was characterised by increase in the shares of 'share capital' and 'long term borrowings', and marginal decline in the share of 'reserves and surplus' (Statement 3A and Chart 4). On the assets side, share of non-current investments increased whereas that of 'cash & cash equivalents' declined gradually during the three year period (Statement 3B and Chart 5). 5.2. Of the funds raised during 2013-14, borrowings had the largest share but there was preference for long term over short term borrowings. This together with a rise in the share of funds raised through 'share capital' resulted in increase in share of funds raised through external sources (i.e., other than companies own). Among internal sources, share of provisions (including depreciation provision) declined (Statement 4A, Chart 6). 5.3. Share of gross fixed assets formation in uses of funds declined during 2013-14 mainly due to lower investment in tangible assets (i.e., 32.1 per cent in 2013-14 as compared to 41.9 per cent in 2012-13). Share of funds parked in non-current investments increased sharply from 5.0 per cent in 2012-13 to 20.5 per cent in 2013-14. However, there was marginal decline in share of current investments and loans and advances in 2013-14. There was a drawdown in funds kept idle as 'cash and cash equivalents' (as against its share of 1.7 per cent in previous year) (Statement 4B, Chart 7). 6. Conclusion The aggregate results of the select NGNF public limited companies in 2013-14 revealed moderation in growth rates of major parameters reflecting subdued economic activities. Growth in EBITDA declined in 2013-14 over 2012-13 and also the net profit contracted in 2013-14. However, net worth of select companies grew at a higher rate with fresh issue of share capital. Leverage ratios of the select companies continued to increase while interest coverage ratio declined during the study period. Share of funds used for fixed assets formation was lower whereas that for non-current investment was higher as compared to the previous year. | Statement 1: Growth rates of select parameters of select 4,388 NGNF public limited companies | | | Growth Rates | | Sales | Operating expenses | EBITDA | Net profit (PAT) | | 2012-13 | 2013-14 | 2012-13 | 2013-14 | 2012-13 | 2013-14 | 2012-13 | 2013-14 | | Aggregate (All Cos.) | 10.5 | 7.2 | 10.5 | 7.1 | 7.9 | 5.3 | 4.5 | -1.1 | | Sales-wise | | | | | | | | | | Less than `1 billion | -10.7 | -12.6 | -10.3 | -10.4 | -19.6 | -24.3 | # | # | | `1 billion -`5 billion | 4.3 | 2.2 | 4.4 | 5.5 | -4.2 | -21.5 | -36.3 | -97.4 | | `5 billion -`10 billion | 7.2 | 4.2 | 6.0 | 3.3 | 16.3 | 1.2 | -8.9 | 9.3 | | `10 billion and above | 12.3 | 8.5 | 12.5 | 8.1 | 9.0 | 8.4 | 8.5 | 3.3 | | Industry-wise | | | | | | | | | | Mining and quarrying | 25.7 | 75.6 | 6.6 | 118.5 | 81.4 | 7.3 | 147.7 | 18.5 | | Manufacturing | 9.8 | 5.0 | 10.3 | 4.8 | 3.7 | 2.8 | 2.0 | -7.9 | | Food products and beverages | 13.6 | 5.3 | 12.9 | 7.6 | 14.8 | -17.9 | 6.2 | -135.3 | | Textile | 8.9 | 7.1 | 6.4 | 7.4 | 29.3 | 7.0 | 63.5 | -15.9 | | Chemicals and chemical products | 8.3 | 8.9 | 8.5 | 9.2 | 0.4 | 5.1 | 10.7 | -10.7 | | Pharmaceuticals and medicines | 13.6 | 12.8 | 13.1 | 12.2 | 12.2 | 17.1 | 51.4 | 2.4 | | Cement and cement products | 10.1 | -0.1 | 12.6 | 3.8 | 6.8 | -23.5 | -4.7 | -37.5 | | Iron and steel | 10.0 | 6.7 | 10.9 | 5.5 | 4.1 | 7.1 | -25.0 | -21.1 | | Machinery and equipments n.e.c. | 9.2 | 1.6 | 8.2 | 1.9 | 4.6 | 3.2 | 1.3 | 7.0 | | Electrical machinery and apparatus | 3.1 | 3.4 | 6.7 | 1.7 | -22.3 | 6.1 | -75.0 | 136.8 | | Motor vehicles and other transport equipments | 3.3 | -3.2 | 3.7 | -3.3 | -6.6 | -1.7 | -13.3 | 0.8 | | Electricity, gas, steam and air conditioning supply | 19.7 | 7.8 | 19.3 | 4.9 | 19.0 | 22.3 | -24.1 | 37.8 | | Construction | -0.3 | -0.1 | 1.3 | 0.2 | -7.4 | -11.0 | -31.0 | -46.6 | | Services | 16.4 | 15.5 | 14.9 | 16.8 | 18.1 | 13.0 | 14.4 | 18.7 | | Transportation and storage | 18.5 | -1.5 | 17.6 | 4.0 | 17.8 | -28.3 | 25.2 | -200.9 | | Telecommunications | 9.2 | 9.0 | 9.0 | 5.7 | 9.8 | 19.3 | 32.2 | 125.6 | | Real Estate | 8.2 | -7.4 | -0.6 | -0.5 | 16.4 | -10 | 50.8 | -39.2 | | Computer and related activities | 16.0 | 25.9 | 15.0 | 23.3 | 18.8 | 33.3 | 9.5 | 38.0 | | # Denominator negative, nil or negligible. |
| Statement 1: Growth rates of select parameters of select 4,388 NGNF public limited companies (Concld.) | | | Growth rates | | Net worth | Total borrowings | Total net assets | | 2012-13 | 2013-14 | 2012-13 | 2013-14 | 2012-13 | 2013-14 | | Aggregate (All Cos.) | 8.6 | 9.9 | 12.9 | 10.8 | 10.1 | 10.2 | | Sales-wise | | | | | | | | Less than `1 billion | 4.4 | 9.9 | 6.2 | 9.5 | 6.9 | 10.1 | | `1 billion -`5 billion | 8.6 | 2.1 | 12.4 | 4.9 | 10.1 | 5.2 | | `5 billion -`10 billion | 7.2 | 7.0 | 9.6 | -11.5 | 7.5 | -0.3 | | `10 billion and above | 9.2 | 11.1 | 14.1 | 15.3 | 10.6 | 12.2 | | Industry-wise | | | | | | | | Mining and quarrying | 4.9 | 39.2 | 9.2 | 182.5 | 8.3 | 78.7 | | Manufacturing | 9.6 | 7.7 | 13.8 | 9.1 | 10.4 | 7.8 | | Food products and beverages | 13.2 | -2.6 | 4.1 | 3.7 | 10.5 | 3.9 | | Textile | 6.9 | 4.6 | 8.0 | 4.9 | 8.9 | 4.9 | | Chemicals and chemical products | 10.7 | 8.3 | 14.7 | -3.3 | 11.6 | 6.7 | | Pharmaceuticals and medicines | 12.4 | 11.2 | 19.3 | 14.3 | 12.2 | 13.6 | | Cement and cement products | 8.4 | 4.2 | 16.2 | 11.8 | 10.3 | 6.4 | | Iron and steel | 7.6 | 5.9 | 22.3 | 16.9 | 12.3 | 11.1 | | Machinery and equipments n.e.c. | 11.4 | 9.6 | 11.3 | 10.9 | 8.7 | 8.4 | | Electrical machinery and apparatus | 0.9 | 5.9 | 17.4 | 8.3 | 5.4 | 6.5 | | Motor vehicles and other transport equipments | 11.5 | 8.4 | 17.1 | 15.0 | 9.1 | 7.6 | | Electricity, gas, steam and air conditioning supply | 6.5 | 8.7 | 13.1 | 8.7 | 11.0 | 7.9 | | Construction | 10.3 | 4.4 | 13.1 | 9.9 | 10.2 | 7.3 | | Services | 6.8 | 13.4 | 10.1 | 6.0 | 9.2 | 12.6 | | Transportation and storage | -4.1 | -5.1 | 6.0 | 8.6 | 0.5 | 4.2 | | Telecommunications | -3.1 | 11.4 | 3.9 | -1.6 | 1.8 | 7.9 | | Real Estate | 5.2 | 2.2 | 10.0 | 11.1 | 7.7 | 6.7 | | Computer and related activities | 15.7 | 29.8 | 5.0 | 16.0 | 14.0 | 28.8 | | # Denominator nil, negative or negligible |
| Statement 2: Ratios of select parameters of select 4,388 NGNF public limited companies | | | Ratios | | EBITDA to sales | PAT to net worth | Total borrowings to equity | | 2011-12 | 2012-13 | 2013-14 | 2011-12 | 2012-13 | 2013-14 | 2011-12 | 2012-13 | 2013-14 | | Aggregate (All Co) | 13.3 | 13.0 | 12.8 | 10.0 | 9.6 | 8.7 | 63.2 | 65.8 | 66.2 | | Sales-wise | | | | | | | | | | | Less than `1 billion | 10.0 | 9.0 | 7.8 | -0.2 | -1.5 | -2.9 | 62.6 | 63.7 | 63.4 | | `1 billion -`5 billion | 11.2 | 10.3 | 7.9 | 6.6 | 3.9 | 0.1 | 75.4 | 78.1 | 79.8 | | `5 billion -`10 billion | 10.8 | 11.7 | 11.3 | 4.2 | 3.6 | 3.7 | 93.3 | 95.4 | 78.6 | | `10 billion and above | 13.9 | 13.5 | 13.5 | 11.9 | 11.8 | 11.0 | 58.8 | 61.6 | 63.8 | | Industry-wise | | | | | | | | | | | Mining and quarrying | 26.5 | 38.3 | 23.4 | 4.9 | 11.5 | 9.8 | 24.9 | 25.9 | 52.5 | | Manufacturing | 11.8 | 11.2 | 10.9 | 11.6 | 10.8 | 9.2 | 65.6 | 68.2 | 69.0 | | Food products and beverages | 8.4 | 8.5 | 6.7 | 10.4 | 9.7 | -3.5 | 116.3 | 106.8 | 114.0 | | Textile | 9.3 | 11.1 | 11.1 | 3.3 | 5.0 | 4.0 | 126.1 | 127.5 | 127.9 | | Chemicals and chemical products | 12.8 | 11.8 | 11.4 | 18.1 | 18.1 | 14.9 | 64.6 | 67.0 | 59.8 | | Pharmaceuticals and medicines | 19.2 | 19.0 | 19.7 | 10.5 | 14.1 | 13.0 | 37.2 | 39.4 | 40.5 | | Cement and cement products | 20.0 | 19.4 | 14.8 | 12.7 | 11.2 | 6.7 | 61.9 | 66.4 | 71.3 | | Iron and steel | 16.7 | 15.8 | 15.9 | 9.4 | 6.5 | 4.9 | 99.5 | 113.1 | 124.8 | | Machinery and equipments n.e.c. | 10.8 | 10.3 | 10.5 | 16.7 | 15.3 | 14.8 | 28.5 | 28.7 | 28.7 | | Electrical machinery and apparatus | 9.2 | 6.9 | 7.1 | 10.5 | 2.6 | 5.8 | 46.5 | 54.2 | 55.4 | | Motor vehicles and other transport equipments | 10.4 | 9.4 | 9.6 | 15.8 | 12.3 | 11.4 | 45.7 | 48.0 | 51.0 | | Electricity, gas, steam and air conditioning supply | 19.6 | 19.5 | 22.1 | 4.6 | 3.3 | 4.2 | 97.9 | 103.6 | 103.9 | | Construction | 14.1 | 13.1 | 11.7 | 8.2 | 5.1 | 2.6 | 82.2 | 84.3 | 88.7 | | Services | 18.5 | 18.8 | 18.4 | 8.9 | 9.6 | 10.0 | 49.2 | 50.8 | 47.3 | | Transportation and storage | 16.2 | 16.1 | 11.7 | 3.6 | 4.9 | -5.0 | 94.7 | 108.8 | 119.9 | | Telecommunications | 24.2 | 24.4 | 26.7 | 1.8 | 2.5 | 5.0 | 60.8 | 65.2 | 57.6 | | Real Estate | 23.5 | 25.3 | 24.6 | 3.6 | 5.2 | 3.1 | 46.7 | 48.8 | 53.1 | | Computer and related activities | 24.6 | 25.2 | 26.7 | 22.3 | 20.9 | 22.4 | 20.9 | 18.8 | 16.9 |
| Statement 3: Composition of liabilities and assets of select 4,388 NGNF public limited companies | | (Per cent) | | A. Composition of Liabilities | | CAPITAL AND LIABILITIES | 2011-12 | 2012-13 | 2013-14 | | 1. | Shareholder's Funds | 44.2 | 43.5 | 43.6 | | | of which, (i) Share Capital | 4.5 | 4.6 | 4.8 | | | (ii) Reserves and Surplus | 39.6 | 38.9 | 38.8 | | | of which, Capital Reserve | 14.6 | 14.0 | 14.0 | | 2. | Long-term borrowings (debt) | 18.2 | 18.6 | 18.9 | | | of which, (i) Bonds / Debentures | 1.8 | 1.8 | 1.8 | | | (ii) Term loans from banks | 10.7 | 10.9 | 11.0 | | 3. | Short-term borrowings | 9.6 | 9.9 | 9.8 | | | of which, from banks | 2.9 | 2.8 | 2.6 | | 4. | Trade payables | 11.1 | 11.2 | 11.3 | | 5. | Provisions | 2.8 | 2.9 | 3.0 | | 6. | Other liabilities | 14.0 | 13.8 | 13.5 | | | (i) non-current | 3.6 | 3.3 | 3.1 | | | (ii) current | 10.5 | 10.4 | 10.4 | | | of which, maturities of long-term debt | 3.6 | 3.5 | 3.2 | | 7. | TOTAL | 100.0 | 100.0 | 100.0 |
| B: Composition of assets | | ASSETS | 2011-12 | 2012-13 | 2013-14 | | 1. Gross Fixed Assets | 52.5 | 53.6 | 53.7 | | (i) Tangible assets | 40.8 | 42.0 | 41.7 | | (ii) Capital work in progress | 6.0 | 6.0 | 6.1 | | (iii) Intangible asset | 4.7 | 4.9 | 5.1 | | 2. Depreciation (i) Tangible | 14.4 | 15.3 | 15.6 | | (ii) Intangible | 1.7 | 1.9 | 1.9 | | 3. Net fixed assets | 36.4 | 36.4 | 36.3 | | 4. Non-current investments | 15.3 | 14.5 | 15.5 | | 5. Current investments | 3.4 | 3.8 | 4.0 | | 6. Loans and Advances | 11.8 | 11.8 | 11.7 | | of which, to related parties | 4.3 | 4.3 | 4.2 | | 7. Inventories | 11.4 | 11.6 | 11.1 | | 8. Trade receivables | 11.0 | 11.1 | 10.9 | | 9. Cash and cash equivalents | 6.2 | 5.8 | 5.0 | | 10. Other assets | 4.5 | 5.0 | 5.5 | | (i) non-current | 1.9 | 2.0 | 2.3 | | (ii) current | 2.6 | 3.0 | 3.2 | | 11. TOTAL | 100.0 | 100.0 | 100.0 |
| Statement 4: Composition of sources and uses of funds of 4,388 NGNF public limited companies | | (Per cent) | | A. Composition of sources of funds during the year | | | 2012-13 | 2013-14 | | Internal sources (Own sources) | 46.3 | 42.4 | | 1. Paid-up Capital | 0.6 | 1.1 | | 2. Reserves and Surplus | 20.8 | 21.6 | | 3. Provisions | 24.8 | 19.7 | | of which, Depreciation | 22.1 | 16.6 | | External sources (Other than own sources) | 53.7 | 57.6 | | 4. Share Capital and Premium | 7.9 | 13.7 | | of which, Net issues | 3.2 | 4.4 | | 5. Long-term borrowings | 17.1 | 17.8 | | of which, (i) Bonds / Debentures | 1.2 | 1.2 | | (ii) From banks | 10.2 | 9.3 | | 6. Short-term borrowings | 10.3 | 7.3 | | of which, From banks | 0.7 | 1.1 | | 7. Trade payables | 9.9 | 10.0 | | 8. Other liabilities | 8.5 | 8.9 | | (i) non-current | 0.8 | 0.8 | | (ii) current | 7.7 | 8.1 | | of which, maturities of long-term debt | 2.2 | 0.0 | | 9. TOTAL | 100.0 | 100.0 |
| B. Composition of uses of funds during the year | | | 2012-13 | 2013-14 | | 1. | Gross Fixed Assets | 51.0 | 45.2 | | | (i) Tangible assets | 41.9 | 32.1 | | | of which, Plant and machinery | 28.6 | 22.4 | | | (ii) Capital Work-in-progress | 4.7 | 5.9 | | | (iii) Intangible assets | 4.4 | 7.2 | | 2. | Non-current investments | 5.0 | 20.5 | | 3. | Current investments | 6.0 | 5.1 | | 4. | Loans and advances | 9.1 | 8.9 | | 5. | Inventories | 10.0 | 5.6 | | 6. | Trade Receivables | 9.6 | 7.3 | | 7. | Cash and cash equivalents | 1.7 | -2.1 | | 8. | Other assets | 7.7 | 9.4 | | | (i) non-current | 2.3 | 4.9 | | | (ii) current | 5.5 | 4.5 | | 9. | TOTAL | 100.0 | 100.0 |
|