This article reviews India’s merchandise trade
performance during April-September 2014 on the basis
of the data released by the Directorate General of
Commercial Intelligence and Statistics (DGCI&S). It also
analyses disaggregated commodity-wise and direction-wise
details during this period.
Highlights
India’s trade performance improved significantly
in Q1 of 2014-15, building on the growth in exports
and compression in imports in 2013-14. However, in
Q2 of 2014-15 export growth lost momentum with the
weakening of activity in major trade partner economies
and also due to persistence of supply-side constraints
in certain export industries/sectors domestically.
Alongside, there was a pick-up in import growth,
particularly non-oil non-gold imports, with anecdotal
evidence suggesting that imports are substituting for production shortfall in certain sectors within the
economy.
I. India’s Merchandise Trade (April-September 2014)
Exports
A sharp rise in exports in May-July 2014 more than
outweighed the deceleration characterising subsequent
months. Notwithstanding export growth roughly
halving in Q2, the overall increase in exports in April-
September 2014 was 6.5 per cent, up from 6.3 per cent
in April-September 2013 (Chart 1 and Table 1).
| Table 1: India’s Merchandise Trade |
| (US$ billion) |
| Item |
April–September |
| 2013-14R |
2014-15 P |
| Exports |
153.8 |
163.7 |
| |
(6.3) |
(6.5) |
| Of which: Oil |
32.7 |
32.9 |
| |
(19.0) |
(0.8) |
| Non-oil |
121.1 |
130.8 |
| |
(3.3) |
(8.0) |
| Gold |
4.6 |
5.2 |
| |
(-56.5) |
(11.8) |
| Non-Oil Non-Gold |
116.4 |
125.6 |
| |
(9.3) |
(7.9) |
| Imports |
230.5 |
234.1 |
| |
(-2.5) |
(1.6) |
| Of which: Oil |
80.0 |
82.4 |
| |
(0.0) |
(2.9) |
| Non-oil |
150.5 |
151.7 |
| |
(-3.8) |
(0.8) |
| Gold |
20.2 |
14.7 |
| |
(-0.2) |
(-27.3) |
| Non-Oil Non-Gold |
130.3 |
137.1 |
| |
(-4.4) |
(5.2) |
| Trade Deficit |
-76.7 |
-70.4 |
| Of which: Oil |
-47.3 |
-49.4 |
| Non-oil |
-29.4 |
-21.0 |
| Non-Oil Non-Gold |
-13.9 |
-11.5 |
R: Revised; P: Provisional.
Note: Figures in brackets are growth rates.
Source: DGCI&S. |
Commodity-wise and Destination-wise Exports
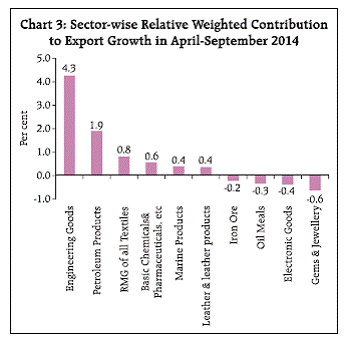
Even though the overall export growth was a shade
better in April-September 2014 than the corresponding
period of 2013-14, it was concentrated in a few major
sectors. Growth impulses mainly emanated from four
sectors, viz., engineering goods, petroleum products,
readymade garments and basic chemicals and
pharmaceuticals which accounted for 58 per cent of the
total value of exports. Other sectors, viz., gems and
jewellery, electronic goods, oil meals and iron ore contributed negatively to export performance
(Chart 2 and 3).
 Besides the overarching impact of global demand
conditions, exports from certain sectors reflected the
impact of policy changes domestically and in
destination countries as also sector-specific issues. For
instance, growth in exports of engineering goods has
been the outcome of diversification to new markets.
Sri Lanka has emerged as a major export destination
for engineering goods during this period. This
diversification has helped Indian companies gain
resilience in the face of the on-going slowdown,
especially in a number of EU markets. Similarly,
exports of readymade garments were boosted by a
growing labour cost advantage of Indian companies
relative to competitors from other emerging markets
and developing economies (EMDEs) like China,
Bangladesh, Vietnam and Cambodia some of which
(e.g., Bangladesh and China) are facing shortages of
labour and tightening of domestic labour laws.
On the other hand, export growth in certain
sectors was affected by decline in international prices
alongside weaker external demand conditions and
domestic sector-specific constraints. The decline in
cotton yarn exports was due to fall in international
prices as well as lower demand from China. With
China’s new cotton policy in place with effect from April 2014, Chinese mills have access to cheaper cotton
from the domestic market, thereby lowering the
international price as well as global demand. The new
policy has ended China’s three-year long programme
to stockpile domestic cotton to support local growers
which had faced elevated domestic prices of cotton/
cotton yarn in China, inducing textile mills to import
yarn from other countries. Furthermore, the Chinese
authorities have recently decided not to issue additional
import quota [other than required under World Trade
Organisation (WTO) entry commitments], thereby
guiding domestic textile companies to use more
Chinese cotton. The sharp decline in international
crude oil prices in recent months seems to have
adversely impacted exports of petroleum products
which accounted for about 22 per cent of total exports
in April-September 2014. Exports of iron ore continued
to be constrained by domestic supply-side issues,
despite partial lifting of the ban on mining activity. The
increase in export tax and railway freight charges
imposed on iron ore have not only reduced exports but
have also caused domestic steel companies to meet
shortages by importing from South Africa, Australia
and Brazil. Similarly, exports of oil meals seem to have been partly impacted by lower than expected soyabean
production that resulted into high cost of soyabean in
local markets.
 Destination-wise analysis shows that exports to
the US, the UAE, China and South Korea gained
momentum during April-September 2014 on a y-o-y
basis. However, exports to Saudi Arabia, Hong Kong,
Singapore and countries in the European Union (except
Germany) either decelerated or turned negative
(Chart 4). Weaker demand conditions in most of these
trade partner countries seem to have weighed on India’s
exports.
In terms of share in total exports, the US continues
to be the largest market for Indian goods with a share
of 13.8 per cent, followed by the UAE (10.5 per cent),
Saudi Arabia (4.4 per cent), Hong Kong (4.2 per cent)
and China (3.7 per cent). Notwithstanding a decline in
exports of gems and jewellery, rise in exports to US was
mostly driven by a rise in exports of drugs, marine
products and products of iron and steel. As growth in
exports to most European countries either decelerated
or turned negative, the EU lost its share in India’s
exports albeit marginally (Table 2 ).
| Table 2: India’s Exports to Principal Regions |
| (Percentage Shares) |
| Region/Country |
2012-13 |
2013-14 |
2013-14 |
2014-15 |
| April-March |
April-Sept |
| I. OECD Countries |
34.2 |
34.6 |
34.8 |
35.0 |
| EU |
16.8 |
16.5 |
16.2 |
15.6 |
| North America |
12.7 |
13.1 |
13.6 |
14.4 |
| Of which: US |
12.0 |
12.4 |
12.9 |
13.8 |
| Asia and Oceania |
2.9 |
3.0 |
3.0 |
2.8 |
| Other OECD Countries |
1.8 |
2.1 |
2.0 |
2.2 |
| II. OPEC |
20.9 |
19.3 |
19.7 |
20.2 |
| III. Eastern Europe |
1.3 |
1.2 |
1.2 |
1.1 |
| IV. Developing Countries |
41.6 |
41.3 |
39.6 |
42.6 |
| Asia |
28.7 |
28.9 |
28.3 |
27.9 |
| SAARC |
5.0 |
5.6 |
5.0 |
6.4 |
| Other Asian Developing Countries |
23.6 |
23.3 |
23.3 |
21.5 |
| People’s Republic of China |
4.5 |
4.8 |
3.8 |
3.7 |
| Africa |
8.1 |
8.4 |
7.8 |
9.7 |
| Latin America |
4.9 |
4.0 |
3.5 |
5.1 |
| V. Others / Unspecified |
1.9 |
3.7 |
4.7 |
1.1 |
| Total Exports |
100 |
100 |
100 |
100 |
| Source: Compiled from DGCI&S data. |
Recognising the issues constraining exports from
various sectors, several measures were announced by
the Government in the Union Budget, 2014-15 (Box).
Imports
After recording a decline for twelve successive
months, India’s imports have begun to pick up since
June 2014. As a result, India’s imports grew by 1.6 per
cent during April-September 2014 as against a
contraction of 2.5 per cent in the corresponding period
last year.
Box: Recent Policy Measures relating to India’s Foreign Trade
In order to boost India’s trade, various measures were
proposed in the Union Budget 2014-15, which are set
out below:
• Recognising the active role of States in providing
good infrastructure and full facilitation for
promoting exports, the Government proposed
Export Promotion Mission to bring all stakeholders
under one umbrella.
• To encourage exports of readymade garments, it
was proposed to increase the duty free entitlement
for import of trimmings, embellishments and other
specified items from 3 per cent to 5 per cent of the
value of their exports.
• The basic customs duty was proposed to be reduced
on the following items:
• Fatty acids, crude palm stearin, RBD (Refined
Bleached Deoderised) and other palm stearin,
specified industrial grade crude oils from 7.5 per
cent to Nil for manufacture of soaps and oleo-chemicals;
• Crude glycerine from 12.5 per cent to 7.5 per cent
and crude glycerine used in the manufacture of
soaps from 12.5 per cent to Nil;
• Steel grade limestone and steel grade dolomite
from 5 per cent to 2.5 per cent;
• Battery waste and battery scrap from 10 per cent to
5 per cent;
• Coal tar pitch from 10 per cent to 5 per cent;
• Specified inputs for manufacture of spandex yarn
from 5 per cent to zero;
• To encourage new investment and capacity addition
in the chemicals and petrochemicals sector, the
basic customs duty was reduced on the following
import items:
• Reformate from 10 per cent to 2.5 per cent;
• Ethane, propane, ethylene, propylene, butadiene
and ortho-xylene from 5 per cent to 2.5 per cent;
• Methyl alcohol and denatured ethyl alcohol from
7.5 per cent to 5 per cent;
• Crude naphthalene from 10 per cent to 5 per cent.
• To prevent misuse and avoid assessment disputes,
the basic customs duty on semi-processed, half cut
or broken diamonds, cut and polished diamonds
and coloured gemstones was proposed to be
rationalised at 2.5 per cent.
• To encourage exports, pre-forms of precious and
semi-precious stones were proposed to be fully
exempted from basic customs duty.
• To boost domestic electronics industry, it was also
proposed to (i) impose basic customs duty at 10
per cent on specified telecommunication products
that are outside the purview of the Information
Technology Agreement, (ii) exempt all inputs/
components used in the manufacture of personal
computers from 4 per cent special additional duty
(SAD), (iii) impose education cess on imported
electronic products to provide parity between
domestically produced goods and imported goods,
(iv) exempt 4 per cent SAD on PVC sheet and ribbon
used for the manufacture of smart cards.
• To boost domestic stainless steel industry, it was
proposed to increase the basic customs duty on
imported flat-rolled products of stainless steel from
5 per cent to 7.5 per cent.
• To maximise the utilisation of solar power, specified
inputs for use in the manufacture of EVA (Ethylene
Vinyl Acetate) sheets and back sheets; flat copper
wire for the manufacture of PV ribbons were
proposed to be exempted from basic customs duty.
Further, a concessional basic customs duty of 5 per
cent was extended to machinery and equipment required for setting up of a project for solar energy
production.
• The basic customs duty was reduced from 10
per cent to 5 per cent on forged steel rings used
in the manufacture of bearings of wind operated
electricity generators.
• The SAD of 4 per cent was exempted for imports
of parts and raw materials required for the
manufacture of wind operated generators.
• A concessional basic customs duty of 5 per cent was
prescribed on machinery and equipment which are
used for setting up of compressed biogas plants
(Bio-CNG).
• To conserve domestic natural resources, the Budget
proposed to increase the export duty on bauxite
from 10 per cent to 20 per cent.
In addition, the basic customs duty was proposed to be
rationalised for imports in various sectors.
• On May 21, 2014, the Reserve Bank modified the
guidelines for import of gold by the nominated
banks/agencies/entities. As per the revised
guidelines, Star Trading Houses/Premier Trading
Houses (STH/PTH), registered as nominated
agencies by the Director General of Foreign Trade
(DGFT), were allowed to import gold under 20:80
scheme subject to certain conditions.
Commodity-wise and Destination-wise Imports
Commodity-wise analysis shows that POL imports,
accounting for nearly 35 per cent of total imports,
increased modestly during April-September 2014.
Although the international crude oil prices (Indian
basket) were higher during April-July 2014 (y-on-y
basis), the subsequent softening in prices helped stem
POL import growth (Table 3 ). In quantum terms, there has been a marginal growth in POL imports. Although
gold imports surged in the second quarter, overall gold
imports in the first half of 2014-15 continued to be
lower than in the corresponding period last year. In
quantum terms, gold imports stood at 365 tonnes
during April-September 2014, about 20 per cent lower
than the level during April-September 2013.
| Table 3: Trends in crude oil prices |
| (US$/barrel) |
| Period |
Dubai |
Brent |
WTI* |
Indian Basket** |
| 1 |
2 |
3 |
4 |
5 |
| 2005-06 |
53.4 |
58 |
59.9 |
55.7 |
| 2006-07 |
60.9 |
64.4 |
64.7 |
62.4 |
| 2007-08 |
77.3 |
82.3 |
82.3 |
79.5 |
| 2008-09 |
82.1 |
84.7 |
85.8 |
82.7 |
| 2009-10 |
69.6 |
69.8 |
70.6 |
69.6 |
| 2010-11 |
84.2 |
86.7 |
83.2 |
85.1 |
| 2011-12 |
110 |
114.4 |
97.3 |
111.9 |
| 2012-13 |
106.9 |
110.5 |
92 |
108 |
| 2013-14 |
104.5 |
107.6 |
99.04 |
105.5 |
| 2014-15 H1 |
103.7 |
106.1 |
100.4 |
104.4 |
* West Texas Intermediate
** The composition of Indian Basket of Crude represents Average of Oman
& Dubai for sour grades and Brent (Dated) for sweet grade in the ratio of 72.04:27.96 for 2013-14.
Sources: International Financial Statistics (IMF), Global Economic Monitor Data-Commodity (World Bank) and Ministry of Petroleum and Natural Gas (Government of India). |
Even though the increase in non-oil non-gold
imports appears to be indicative of gradual recovery in
the domestic economy, supply-side bottlenecks in
certain sectors may also have induced substitution
through imports. In particular, import demand for basic
and intermediate goods including iron and steel, nonferrous
metals, metaliferrous ores and other minerals,
artificial resins, plastic materials and electronic
components has picked up in April-September 2014.
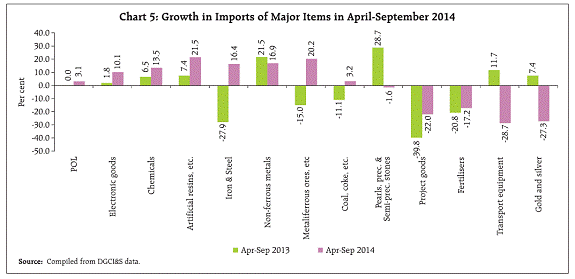 Higher imports of iron and steel may also be an
indicator of an improving outlook for domestic
construction and manufacturing sectors. On the other
hand, India’s coal imports largely reflect domestic
supply-side bottlenecks in the wake of legal rulings on
coal block allocation and also growing needs of thermal-based
power plants. The rise in imports of electronic
goods is reportedly due to an inverted duty structure
as certain finished electronic goods carry lower import
duty than components and raw materials. This is
leveraged by domestic companies to import finished
goods rather than manufacturing them domestically.
In contrast, imports of capital goods (viz., machine
tools, machinery, project goods and transport
equipment) either remained subdued or declined, with
growth in domestic production of capital goods
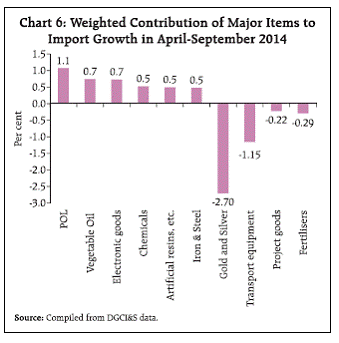
strengthening. On the whole, the major contributors
to import growth during April-September 2014 were
POL, vegetable oil, electronic goods, chemical, artificial
resins and iron and steel (Charts 5 and 6).
The direction of trade shows that there were lower
imports from the EU, the US, Switzerland, Iraq, Kuwait,
Saudi Arabia and the UAE. The sharp decline in imports
from oil exporting countries was largely due to fall in international oil prices in August and September 2014.
The decline in imports from Switzerland by 17.1 per
cent was mainly due to contraction in gold imports. In
contrast, the imports from China increased by 14.5 per
cent as against a decline of 3.7 per cent in April-
September 2013, largely driven by surge in imports of
telecom instruments, making it the largest source country for India followed by Saudi Arabia, the UAE,
the US and Switzerland (Table 4 ).
| Table 4: Shares of Groups/Countries in
India’s Imports |
| (Percentage Shares) |
| Region/Country |
2012-13 |
2013-14 |
2013-14 |
2014-15 |
| April-March |
April-Sept |
| I. |
OECD Countries |
28.8 |
25.6 |
27.2 |
24.9 |
| |
EU |
10.6 |
11.1 |
11.1 |
10.6 |
| |
France |
0.9 |
0.8 |
0.8 |
0.8 |
| |
Germany |
2.9 |
2.9 |
2.8 |
2.7 |
| |
UK |
1.3 |
1.3 |
1.6 |
0.9 |
| |
North America |
5.7 |
5.7 |
6.1 |
5.2 |
| |
US |
5.1 |
5.0 |
5.4 |
4.5 |
| |
Asia and Oceania |
5.3 |
4.4 |
4.5 |
4.3 |
| |
Other OECD Countries |
7.1 |
4.5 |
5.5 |
4.8 |
| |
Switzerland |
6.5 |
4.1 |
5.3 |
4.3 |
| II. |
OPEC |
38.3 |
39.4 |
38.9 |
37.1 |
| III. |
Eastern Europe |
1.6 |
1.7 |
1.6 |
1.9 |
| IV. |
Developing Countries |
30.8 |
32.0 |
31.5 |
34.4 |
| |
Asia |
23.5 |
24.8 |
24.8 |
26.2 |
| |
SAARC |
0.5 |
0.6 |
0.5 |
0.6 |
| |
Other Asian Developing Countries |
23.0 |
24.2 |
24.3 |
25.6 |
| |
of which: |
|
|
|
|
| |
People’s Republic of China |
10.7 |
11.4 |
11.2 |
12.7 |
| |
Africa |
3.9 |
3.3 |
3.6 |
4.4 |
| |
Latin America |
3.4 |
3.9 |
0.5 |
0.2 |
| V. |
Others / Unspecified |
0.5 |
1.3 |
0.9 |
1.7 |
| Total Imports |
100.0 |
100.0 |
100.0 |
100.0 |
| Source: Compiled from DGCI&S data. |
Trade Deficit
Despite the import growth turning modestly positive
India’s trade deficit narrowed in April-September 2014
as compared with the corresponding period of 2013-14
reflecting some improvement in export performance.
II. Global Trade Scenario
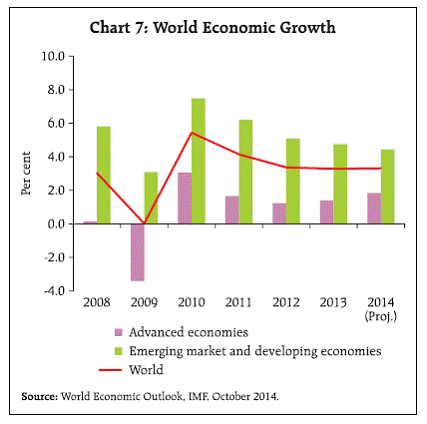
Economic activity across major economies grew
at a slower than anticipated pace in the first half of
2014, with world growth projected to remain stagnant
at 3.3 per cent in 2014. In particular, growth in major
emerging markets and developing economies (EMDEs)
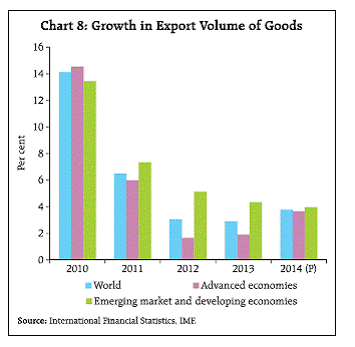
is likely to remain constrained (Chart 7). As per the
International Monetary Fund’s (IMF) projections, the
growth in export volume of EMDEs will decelerate from
4.7 per cent in 2013 to 4.4 per cent in 2014. Nevertheless, the growth in world export volume is projected to be
higher on the back of exports from advanced economies
(Chart 8).
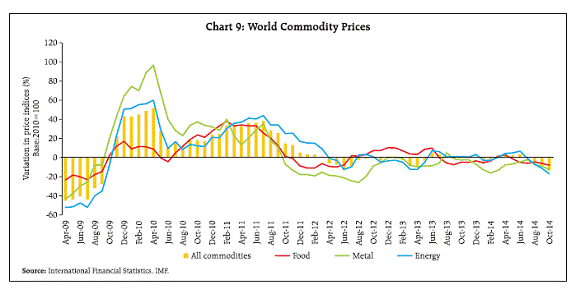
 Key commodity prices have softened so far in 2014
(Chart 9). Even though escalation of geopolitical
tensions led to a temporary upward pressure on
international prices of crude oil in mid-2014, the recent
fall reflects strengthening of the US dollar, increased supplies by both organisation of the petroleum
exporting countries (OPEC) and non-OPEC countries
and weakening demand from major EMDEs and the
euro area. According to the US Energy Information
Administration, September 2014, it also reflected the
impact of moderation in demand due to seasonal
decline in refinery runs and the seasonal increase in
crude oil exports from Saudi Arabia. Similarly, metal
prices have traded softly so far in 2014. In particular,
international prices of iron ore declined further in 2014,
reflecting the expansion of low cost supply, particularly
Australia and Brazil, and also lower demand in China.
Softening food prices benefitted from weather-induced
improvement in global supply condition. Going
forward, the prices of key commodities are projected to moderate further in 2015, amidst a still weak global
outlook.
 III. Outlook
The narrowing of India’s trade deficit in April-
September 2014 augured well for India’s overall balance
of payments. However, the deceleration in export
growth in recent months has heightened downside
risks in a difficult international trading environment.
On the import side, further softening of international
prices of key commodities may help contain the level
of imports, although the rising gold imports may offset
this advantage and turnout to be the key determinant
of overall imports. Besides this, the upturn in non-oil
non-gold imports since May 2014 may gather momentum
as domestic activity gains traction.
|