The conduct of monetary policy in 2021-22 was guided by the objective of reviving and sustaining growth on a durable basis and continuing to mitigate the impact of COVID-19 on the economy, while ensuring that inflation remains within the target going forward. The Reserve Bank maintained surplus liquidity in consonance with this stance. Monetary transmission improved during the year, supported by surplus liquidity and the external benchmark-based regime for loan pricing. III.1 Against the backdrop of a sharp contraction of 6.6 per cent in real gross domestic product (GDP) in 2020-21 and the uneven and fragile recovery in 2021-22 interrupted by a second wave of the pandemic in the first quarter and a third wave commencing in late December 2021, the conduct of monetary policy was challenging. Intermittent inflationary pressures from food price spikes, domestic and global supply chain disruptions and global spillovers purveying imported inflation despite a large slack in demand complicated the setting of monetary policy in consonance with the accommodative stance. The monetary policy committee (MPC) decided to look through these supply shocks and kept the policy repo rate unchanged during 2021-22. The MPC also decided to maintain its state-contingent accommodative stance through the year. III.2 The Reserve Bank maintained abundant liquidity in the banking system in consonance with this stance. A secondary market G-sec acquisition programme (G-SAP) was implemented to ensure orderly evolution of the yield curve and facilitate monetary transmission across financial instruments. Liquidity measures targeted at sectors ravaged by the second wave of the pandemic such as contact-intensive services, the health sector, small business units, micro and small industries, and other unorganised sector entities were also put in place. As financial conditions eased, a calibrated restoration of the revised liquidity management framework instituted in February 2020 was set in motion through rebalancing liquidity in a non-disruptive manner away from the fixed rate reverse repo operations to market based auctions of variable rate reverse repos (VRRRs). III.3 The external benchmark-linked framework incentivised banks to transmit these monetary policy signals, contributing to a decline in banks’ marginal cost of funds-based lending rates (MCLRs), strengthening monetary transmission. III.4 Against this backdrop, section 2 presents the implementation status of the agenda set for 2021-22 along with major developments during the year, while section 3 sets out the agenda for 2022-23. Concluding observations are given in the last section. 2. Agenda for 2021-22 III.5 In the Annual Report for 2020-21, the following goals were set for the conduct of monetary policy and liquidity management: • Understanding the common and idiosyncratic components of inflation (Paragraph III.6); • Upgrading GDP nowcasting and the forecasting framework using high-frequency data (Paragraph III.6); • Implementing the augmented and recalibrated quarterly projection model (QPM) to achieve precision in medium-term forecasts and risk assessment (Utkarsh) [Paragraph III.6]; • Refining liquidity forecasting and exploring additional tools for liquidity management (Paragraph III.6); • Examining the behaviour of credit cycles in India (Paragraph III. 6); • Strengthening nowcasts of food inflation (Paragraph III.7); and • Improving data management by migration of returns to an XBRL1 reporting format (Paragraph III.7). Implementation Status III.6 The QPM – the workhorse model to generate medium-term forecasts and undertake policy scenarios – was augmented by including an external sector block with capital flows while capturing macroeconomic linkages and feedbacks. Nowcasting techniques for contemporaneous assessment of underlying economic activity were upgraded by fine-tuning dynamic factor approaches. Announcement effects of open market operations (OMOs) on financial markets were examined in an event study framework. Growth-inflation trade-offs, yield curve behaviour, monetary transmission, drivers of sectoral bank credit cycles and leverage and investment in the corporate sector were examined to strengthen the underpinning of monetary policy analysis. III.7 A customised data template of commodities was created using data from Agmarknet, based on empirically tested relationships with corresponding consumer price index (CPI) items. The migration of returns to an XBRL reporting format was completed during the year. Major Developments Monetary Policy III.8 The MPC’s first meeting for the financial year 2021-22 in early April 2021 was held against the backdrop of a renewed surge in COVID-19 infections in some states, imparting uncertainty to the macroeconomic outlook. Headline inflation had firmed up to 5.0 per cent in February 2021 from 4.1 per cent in January 2021, with double-digit inflation in a majority of food sub-groups. The projection of real GDP growth for 2021-22 was retained at 10.5 per cent, as set out in the February 2021 meeting of the MPC, while recognising that the resurgence in COVID-19 infections and the associated uncertainty are risks to the growth outlook. III.9 Headline inflation was projected at 5.0 per cent in Q4:2020-21; 5.2 per cent in Q1:2021-22 and Q2; 4.4 per cent in Q3 and 5.1 per cent in Q4. The MPC noted that supply side pressures could persist, although demand-side pull remained moderate, and urged the Centre and states to mitigate domestic input costs emanating from taxes on petrol and diesel and high retail margins. Confronted by the ferocity of the second wave and the associated localised lockdowns, the MPC unanimously decided to keep the repo rate at 4 per cent and continue with an accommodative stance. III.10 By the time of the June 2021 meeting, the second wave of COVID-19 had started showing signs of waning and the adoption of COVID-compatible occupational models by businesses cushioned the hit to economic activity. Inflation moderated from 5.5 per cent in March 2021 to 4.3 per cent in April 2021, but the rising trajectory of international commodity prices, especially of crude, together with logistics costs were adjudged to be posing upside risks to the inflation outlook, warranting, in the MPC’s view, reductions in excise duties, cess and taxes imposed by the Centre and states to contain input cost pressures. The projection of real GDP growth for 2021-22 was revised downwards to 9.5 per cent while CPI inflation was projected at 5.1 per cent during 2021-22 – 5.2 per cent in Q1; 5.4 per cent in Q2; 4.7 per cent in Q3; and 5.3 per cent in Q4. The MPC decided to retain the prevailing repo rate at 4 per cent and continue with the accommodative stance set out in its April meeting. III.11 By August 2021, coinciding with the third meeting of the MPC for the year, the domestic economy was exhibiting signs of revival with the ebbing of the second wave and the easing of containment measures. Taking stock of resilient agricultural production and rural demand, pent-up urban demand, buoyant exports and rising government expenditure, the projection of real GDP was retained at 9.5 per cent for 2021-22.2 By this time, however, inflationary pressures had intensified, with CPI inflation breaching the upper tolerance level during May-June on the back of surging prices of food and fuel items. Accordingly, the CPI inflation projection was revised upwards to 5.7 per cent for 2021-22. The MPC assessed these inflationary pressures to be largely driven by adverse supply shocks and that the nascent and hesitant recovery needed to be nurtured through fiscal, monetary and sectoral policy levers. Accordingly, the committee unanimously voted to keep the repo rate at 4 per cent and to continue with the accommodative stance with a 5-1 vote. III.12 In the MPC’s fourth bi-monthly meeting in October, it noted that domestic economic activity was gaining traction, supported by record kharif foodgrains output and bright rabi prospects. Acceleration in the pace of vaccination, a sustained decline in new infections, and rebound in the pent-up demand for contact intensive services brightened the prospects of the recovery. Global semiconductor and chip shortages, elevated commodity prices and input costs, logistics disruptions and potential global financial market volatility were viewed as key downside risks to domestic growth prospects. Inflation outcomes turned out to be more favourable than anticipated, with CPI inflation softening during July-August 2021 and moving back into the tolerance band. The inflation projection was revised to 5.3 per cent during 2021-22 and the MPC recommended measures to further ameliorate supply and cost pressures for a more durable reduction in inflation and anchoring of inflation expectations. The MPC also observed that even as the domestic economy was showing signs of mending, the external environment was turning more uncertain and challenging. Hence, the domestic recovery needed to be nurtured assiduously through all policy channels. The MPC, therefore, decided unanimously to keep the policy repo rate unchanged at 4 per cent. It voted 5 to 1 to continue with the accommodative stance. III.13 By the MPC’s December 2021 meeting, the global situation had altered and risks shifted to the downside with a surge in infections across countries due to the emergence of the Omicron variant. While domestic economic activity was evolving in line with the MPC’s October assessment, CPI inflation had edged up in October on account of an increase in vegetable prices due to unexpected rainfall that damaged crops in several states. The reduction of taxes on petrol and diesel announced in November was welcomed as it would bring about a durable reduction in inflation going forward through both direct and indirect effects. Taking these factors into account, CPI inflation projection was retained at 5.3 per cent for 2021-22, noting that inflation prints may remain elevated in Q4:2021-22 but soften thereafter. With domestic activity just about catching up with pre-pandemic levels, however, the MPC considered it appropriate to wait for growth signals to become more entrenched in view of the likely tightening of global financial conditions, the potential resurgence in COVID-19 infections with new mutations, persisting shortages and bottlenecks and the widening divergences in policy actions and stances across the world. Accordingly, the MPC unanimously decided to keep the policy repo rate unchanged at 4 per cent and to continue with the accommodative stance with a 5 to 1 vote. III.14 In the run up to the sixth bi-monthly policy of February 2022, CPI inflation had moved along the expected trajectory during November-December 2021. Food prices were expected to benefit from fresh winter crop arrivals, strong supply side interventions by the government, increase in domestic production, and prospects of a good rabi harvest. However, crude oil prices were seen to be imparting uncertainty to the outlook. The projection for CPI inflation was retained at 5.3 per cent for 2021-22. For 2022-23, CPI inflation was forecast at 4.5 per cent – Q1 at 4.9 per cent, Q2 at 5.0 per cent, Q3 at 4.0 per cent and Q4 at 4.2 per cent – with risks broadly balanced. Aggregate demand was expected to benefit from the improved outlook for rabi crop, the pick-up in non-food bank credit, supportive monetary and liquidity conditions, sustained buoyancy in merchandise exports, improving capacity utilisation, and the announcements in the Union Budget 2022-23 on boosting public infrastructure through enhanced capital expenditure. Global financial market volatility, elevated international commodity prices, especially crude oil, and continuing global supply-side disruptions were seen as downside risks to the outlook. Taking into account these considerations, real GDP growth for 2022-23 was projected at 7.8 per cent – Q1 at 17.2 per cent, Q2 at 7.0 per cent, Q3 at 4.3 per cent and Q4 at 4.5 per cent. The MPC noted that the expected moderation in inflation in H1:2022-23 and thereafter provided room to remain accommodative. With COVID-19 continuing to impart some uncertainty to the outlook amidst global headwinds, the MPC judged that the ongoing domestic recovery was still incomplete and needed continued policy support. Accordingly, the MPC unanimously decided to keep the policy repo rate unchanged at 4 per cent and continue with the accommodative stance with a 5 to 1 vote. The Operating Framework: Liquidity Management III.15 The operating framework of monetary policy aims at aligning the operating target – the weighted average call rate (WACR) – with the policy repo rate through proactive liquidity management. The Reserve Bank maintained surplus liquidity in the banking system during 2021-22 in consonance with the accommodative stance of monetary policy. In response to the second wave of the pandemic, the Reserve Bank announced additional liquidity measures amounting to ₹3.61 lakh crore during 2021-22, taking the total announced amount of primary liquidity offered since February 2020 to ₹17.2 lakh crore (8.7 per cent of nominal GDP of 2020-21). Across the world, US$16.9 trillion or 16.4 per cent of global GDP was pledged as fiscal support and US$19.0 trillion or 18.4 per cent of global GDP as monetary support (Box III.1). Box III.1
Extraordinary Central Bank Lending Facilities during the Pandemic Alongside large policy rate cuts, central banks’ conventional and unconventional liquidity support became the main line of defence against the deleterious impact of the pandemic in almost all jurisdictions.3 The Reserve Bank has taken about 100 odd measures since March 2020, creating congenial monetary and financial conditions and providing regulatory support to mitigate stress and nurture the recovery process (Das, 2021). G-20 central banks’ experience reveals that lending operations topped the hierarchy of policy intervention tools (share of 35-40 per cent in total monetary support) along with asset purchases, foreign exchange interventions and other policy measures, with 60 per cent of these lending operations entailing newly established programmes (Chart 1). In the case of India, the share of lending operations was higher than the average of emerging market economies (EMEs), with three-fourth being new measures. Lending support of central banks in the initial days of the pandemic was not targeted and essentially involved increasing the amount and lengthening the maturities of existing repurchase agreements (Canada, Japan, USA, and India). This was supplemented by targeted lending operations, broadening eligible collaterals to include corporate bonds (Chile and Israel) and/or increasing eligible counterparties such as insurance companies (Czech Republic), pension funds (Columbia) and mutual funds (USA). Central banks started with new targeted lending facilities aimed at protecting the vulnerable and small and medium enterprises (SMEs), mostly in coordination with banks/financial institutions (USA, Japan, UK, Mexico, Thailand and India) and sometimes in coordination with government (Brazil and Singapore). Targeted lending operations for health, medical supplies and contact intensive sectors were a feature of some of the EME central banks, namely, China and India. 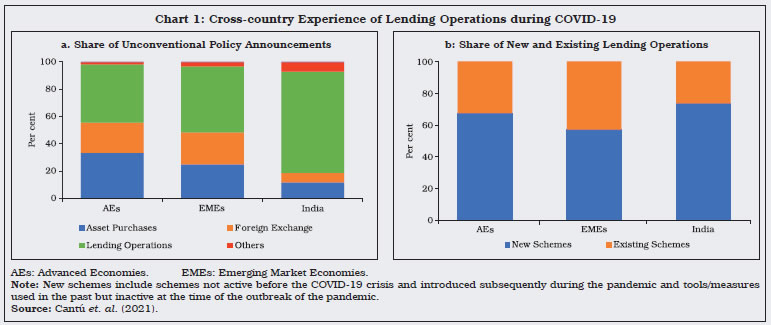
| Table 1: India’s Unconventional Lending Operations during COVID-19 | | Lending Operations | Announced Amount (₹ crore) | | 2019-20 | 2020-21 | 2021-22 | Total | | 1 | 2 | 3 | 4 | 5 | | I. LTRO/TLTROs/SLTROs4 | 2,25,000 | 2,25,000 | 10,000 | 4,60,000 | | II. Lending to Mutual Funds/ NBFCs | - | 80,000 | - | 80,000 | | III. Lending to Emergency Health Services/ Contact-intensive Sectors | - | - | 65,000 | 65,000 | | IV. Refinancing to AIFIs | - | 75,000 | 66,000 | 1,41,000 | | Total | 2,25,200 | 3,80,000 | 1,41,000 | 7,46,200 | | Source: RBI. | Central banks also reopened refinancing schemes to provide pure liquidity support. While these schemes were mostly common among EMEs including India (Table 1), they were also undertaken elsewhere – the Euro area (long term refinancing operations) and Switzerland (standing COVID-19 refinancing facility). Usage of large-scale targeted lending operations seems to have worked well with maximum lending operations benefitting the targeted borrowers – especially the MSMEs (Casanova et al., 2021). A notable feature of India’s pandemic response is the special liquidity support provided by the Reserve Bank to All India Financial Institutions (AIFIs) in the face of acute risk aversion among banks hindering on-lending of central bank liquidity to pandemic affected entities. These lines of credit were channelised to more than 500 financial intermediaries/entities (as on March 31, 2022) [Chart 2], including co-operative banks, regional rural banks (RRBs), housing finance companies (HFCs), microfinance institutions (MFIs) and small finance banks (SFBs).5 Moreover, taking advantage of the Reserve Bank’s special liquidity schemes of ₹65,000 crore for emergency health and contact-intensive services, banks deployed their own funds to the tune of ₹15,663 crore during 2021-22 towards COVID-19 related emergency health services and contact intensive sectors, which effectively expanded bank credit to the economy at a time when credit growth was subdued. Thus, while in normal times the Reserve Bank abstains from the use of sector specific lending facilities, the usage of refinance during crisis times served well in meeting the funding needs of targeted entities.  References: 1. Cantú, C., P. Cavallino, F. D. Fiore and J. Yetman (2021), ‘A Global Database on Central Banks’ Monetary Responses to COVID-19”, BIS Working Paper no. 934. 2. Casanova C., B. Hardy and M. Onen (2021), ‘COVID-19 Policy Measures to Support Bank Lending’, BIS Quarterly Review. 3. Das, Shaktikanta (2021), ‘Interview with CNBC Asia’, Singapore, Reserve Bank of India, August 26. | III.16 With a view to improving monetary policy transmission and enabling a stable and orderly evolution of the yield curve, the Reserve Bank implemented a secondary market G-sec acquisition programme (G-SAP) in April-September 2021. Under the G-SAP, the Reserve Bank provided an upfront commitment on the size of G-sec purchases. The G-SAP allayed market fears and indicated Reserve Bank’s continued support to the market in the face of an enlarged market borrowing programme. Similar to the regular OMOs, G-SAP was confined to the purchase of government papers from the secondary market. During Q1, the Reserve Bank conducted three auctions under G-SAP 1.0 and purchased G-secs [including state development loans (SDLs)] of ₹1.0 lakh crore, in line with the announced amount. In Q2, six auctions were conducted under G-SAP 2.0 aggregating to ₹1.2 lakh crore. The G-SAP 2.0 auctions conducted on September 23 and September 30, 2021 for ₹15,000 crore each were accompanied by simultaneous sales of G-secs of identical amount. Under the G-SAP, the Reserve Bank purchased both on the run (liquid) and off the run (illiquid) securities across the maturity spectrum. About two-thirds of the purchases were made in the belly of the curve, impacting yields in a manner that imparted liquidity to most parts of the yield curve, thus benefitting the entire term structure of interest rates (Chart III.1). By ensuring an orderly evolution of the yield curve, G-SAP facilitated monetary transmission across financial instruments. Overall, net liquidity injected through OMO purchases, including G-SAP, amounted to ₹2.1 lakh crore during 2021-22. In conjunction with the special OMO [operation twist (OT)] auction of ₹10,000 crore conducted on May 6, 2021, OTs amounted to ₹40,000 crore during 2021-22. 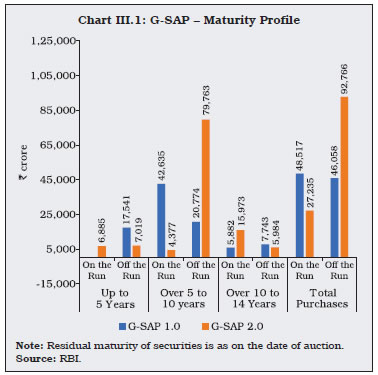 III.17 To provide further liquidity support to the pandemic-impacted sectors, first, an on-tap liquidity window of ₹50,000 crore was opened in May 2021 – initially available till end-March 2022 but later extended up to end-June 2022 – with tenors of up to three years at the repo rate to boost provision of immediate liquidity for ramping up COVID-19 related healthcare infrastructure and services in the country. Second, the Reserve Bank announced a special three-year long-term repo operation (SLTRO) of ₹10,000 crore at the repo rate for the small finance banks (SFBs) in May 2021 to provide further support to small business units, micro and small industries, and other unorganised sector entities. Third, a liquidity window of ₹15,000 crore was opened in June 2021 (initially available till end-March 2022 but later extended up to end-June 2022), with tenors of up to three years at the repo rate to alleviate stress in contact-intensive sectors. Finally, to ensure continued flow of credit to the real economy, the Reserve Bank announced additional liquidity support of ₹66,000 crore for fresh lending during April and June 2021 to select AIFIs. Drivers and Management of Liquidity III.18 In Q1:2021-22, purchases under the G-SAP and net forex purchases in the wake of continued capital inflows augmented banking system liquidity, while increase in currency in circulation (CiC), build-up of Government of India (GoI) cash balances and the restoration of the CRR to its pre-pandemic level drained liquidity (Table III.1). III.19 In Q2, surplus liquidity got further enhanced by the usual return of CiC, renewed vigour of capital inflows and liquidity injections through G-SAP 2.0. In Q3 and Q4, increased government spending partly compensated for liquidity drainage emanating from festival-related expansion in CiC, net forex sales and OMO sales. Overall, the liquidity outflow on account of CiC expansion (₹2.8 lakh crore) and build-up of government cash balances (₹0.7 lakh crore) was more than offset by injection through OMO purchases (including G-SAP) and forex purchases (₹2.0 lakh crore), resulting in increased absorption (₹1.2 lakh crore) during 2021-22. Rebalancing of Liquidity III.20 The gradual restoration of liquidity management operations in sync with the revised liquidity management framework instituted in February 2020 was a key objective during 2021-22. The CRR was restored to its pre-pandemic level of 4.0 per cent of net demand and time liabilities (NDTL) in two phases of 0.5 percentage point each, effective the fortnights beginning March 27, 2021 and May 22, 2021. Furthermore, facilities such as MSF relaxation, on-tap TLTRO and SLTRO, which were announced with finite end dates, were terminated as scheduled. In an endeavour to re-establish the 14-day VRRR as the main liquidity management tool, the Reserve Bank progressively enhanced the size of the VRRR auctions through a pre-announced schedule from ₹2.0 lakh crore during April-July 2021 to ₹7.5 lakh crore by end-December 2021. These operations were complemented by the 28-day VRRRs and fine-tuning operations of 3-8 day maturity. Reflecting these developments, the amount absorbed under the fixed rate reverse repo reduced significantly, averaging ₹2.0 lakh crore during H2:2021-22 as compared with ₹4.6 lakh crore during H1:2021-22 (Chart III.2). | Table III.1: Liquidity – Key Drivers and Management | | (₹ crore) | | | 2020-21 | Q1:2021-22 | Q2: 2021-22 | Q3: 2021-22 | Q4: 2021-22 | | 1 | 2 | 3 | 4 | 5 | 6 | | Drivers | | | | | | | (i) CiC | -4,06,452 | -1,26,266 | 54,921 | -61,794 | -1,48,748 | | (ii) Net Forex Purchases | 5,10,516 | 1,60,843 | 1,42,395 | -17,242 | -79,136 | | (iii) GoI Cash Balances | -1,81,999 | -2,23,740 | -5,600 | 1,34,537 | 19,430 | | Management | | | | | | | (i) Net OMO Purchases | 3,13,295 | 1,38,965 | 97,960 | -15,060 | -7,880 | | (ii) CRR Balances | -1,46,617 | 29,392 | -16,470 | -77,606 | 32,996 | | (iii) Net LAF Operations | -1,52,302 | -60,759 | -2,86,162 | 60,823 | 1,65,269 | | Memo Items | | | 1. Average Daily Injection (LTRO, TLTRO, On tap TLTRO, SLTRO and MSF) | 1,58,491 | 82,948 | 84,487 | 87,298 | 91,894 | | 2. Average Daily Total Absorption (i+ii) | 6,54,645 | 5,93,181 | 8,10,096 | 8,57,638 | 7,69,234 | | (i) Fixed Rate Reverse Repo | 6,13,700 | 4,10,747 | 5,18,241 | 2,16,635 | 1,76,706 | | (ii) Variable Rate Reverse Repo (VRRR) | 40,945 | 1,82,434 | 2,91,855 | 6,41,003 | 5,92,528 | | 3. Average Daily Net Absorption during the Period (2-1) | 4,96,154 | 5,10,233 | 7,25,609 | 7,70,340 | 6,77,340 | Note: 1. Inflow (+)/Outflow (-) from the banking system.
2. Data on drivers and management pertain to the last Friday of the respective period.
Source: RBI. | III.21 In December 2021, the Reserve Bank provided one more option to banks to prepay the outstanding amount of funds availed under the targeted long-term repo operations in addition to the option provided in November 2020. Accordingly, banks returned ₹2,434 crore of TLTRO funds in addition to ₹37,348 crore paid earlier in November 2020. Given the limited recourse to the marginal standing facility (MSF) window due to surplus liquidity conditions, the borrowing limit under the MSF was restored to the pre-pandemic level of 2 per cent of NDTL from 3 per cent, effective January 1, 2022. 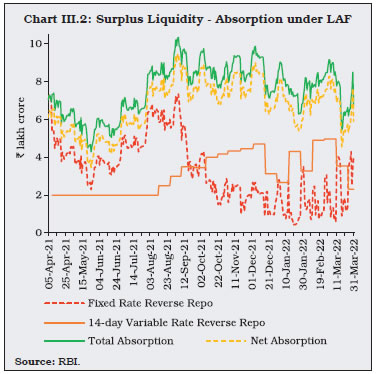 III.22 Temporary liquidity tightness on account of larger than anticipated collections under the goods and services (GST) tax resulted in the overnight rates breaching the repo rate on January 21, 2022. To assuage market concerns, the Reserve Bank conducted three variable rate repo (VRR) auctions of 1-3-day maturity, cumulatively injecting ₹2.0 lakh crore during January 20-24, 2022 which eased overnight rates. These operations exemplify the flexibility and agility of the revised liquidity management framework instituted in February 2020. III.23 With increased amount absorbed under the VRRR auctions at higher cut-offs, the effective reverse repo rate6 moved higher, from an average of 3.38 per cent in Q2 to 3.83 per cent in Q4 (Chart III.3a). The higher cut-offs in the VRRR auctions nudged money market rates upwards across the spectrum. The overnight segment rates – the weighted average call rate (WACR), the tri-party repo rate and the market repo rate – which traded below the reverse repo rate during H1:2021-22, gradually moved upwards in H2. Similarly, the rates on the 3-month T-bill, certificates of deposits (CDs) and commercial paper issuances by non-banking financial companies (CP-NBFCs) evolved in sync with the weighted average reverse repo rate, with their spreads over the reverse repo rate ruling higher by 26 bps, 38 bps and 83 bps, respectively, during H2:2021-22 as against 1 bp, 8 bps and 28 bps during H1:2021-22 (Chart III.3b).  III.24 With the progressive return of normalcy, including transient demand for liquidity from the Reserve Bank, and in order to make the revised liquidity management framework more flexible and agile, it was decided in February 2022 that (i) variable rate repo (VRR) operations of varying tenors will be conducted as and when warranted by the evolving liquidity and financial conditions within the CRR maintenance cycle; (ii) VRRs and VRRRs of 14-day tenor will operate as the main liquidity management tool based on liquidity conditions and will be conducted to coincide with the CRR maintenance cycle; (iii) these main operations will be supported by fine-tuning operations to tide over any unanticipated liquidity changes during the reserve maintenance period while auctions of longer maturity will also be conducted, if required; and (iv) effective March 1, 2022, the window for fixed rate reverse repo and the MSF operations would be available only during 17.30-23.59 hours on all days as against 09.00-23.59 hours instituted earlier (from March 30, 2020) to deal with the pandemic. Accordingly, market participants were advised to shift their balances out of the fixed rate reverse repo into VRRR auctions and avail the automated sweep-in and sweep-out (ASISO) facility in the e-Kuber portal for operational convenience.7 Monetary Policy Transmission III.25 Monetary transmission is the process through which changes in the policy repo rate are transmitted through the structure of interest rates across various market segments to changes in banks’ deposit and lending rates, which, in turn, influence aggregate spending behaviour, and eventually to the final goals – inflation and growth. Monetary transmission to deposit and lending rates improved further in 2021-22, facilitated by the large systemic surplus liquidity and subdued credit demand (Table III.2). | Table III.2: Transmission to Deposit and Lending Interest Rates | | (Variation in basis points) | | Period | Repo Rate | Term Deposit Rates | Lending Rates | | Median Term Deposit Rate – Fresh Deposits | WADTDR – Outstanding Deposits | 1-Year Median MCLR | WALR - Outstanding Rupee Loans | WALR - Fresh Rupee Loans | | 1 | 2 | 3 | 4 | 5 | 6 | 7 | | April 2019 to March 2020 | -185 | -48 | -51 | -60 | -31 | -99 | | April 2020 to March 2021 | -40 | -137 | -110 | -90 | -82 | -78 | | April 2021 to March 2022 | 0 | 0 | -25 | -5 | -36 | -26 | | Easing Cycle | | | | | | | | February 2019 to March 2022 | -250 | -208 | -188 | -155 | -150 | -229 | | Memo: | | | | | | | | February 2019 to September 2019 (Pre-External Benchmark Period) | -110 | -9 | -8 | -30 | 0 | -43 | | October 2019 to March 2022 (External Benchmark Period) | -140 | -180 | -180 | -128 | -150 | -186 | WADTDR: Weighted Average Domestic Term Deposit Rate. WALR: Weighted Average Lending Rate.
MCLR: Marginal Cost of Funds-based Lending Rate.
Source: Special Monthly Return VIAB, RBI and Banks’ websites. | III.26 The external benchmark-based loan pricing8 has also hastened the pace of transmission to deposit rates and other lending rates. As banks are required to reduce their lending rates in accordance with the movement in the benchmark rates, this necessitates a downward adjustment in their deposit rates for protection of their net interest margins (NIMs). This brings forth a softening of banks’ cost of funds, contributing to a moderation in their MCLRs and loans linked to MCLRs. Thus, the impact of introduction of external benchmark-based pricing of loans on monetary transmission has also encompassed sectors not directly linked to external benchmark for loan pricing. The share of external benchmark-linked loans in total outstanding floating rate loans has increased from 9.3 per cent in March 2020 to 39.2 per cent in December 2021 and augurs well for more efficient transmission going ahead. III.27 Bank-group wise analysis indicates that public sector banks exhibited higher pass-through to lending rates vis-à-vis private sector banks in the easing cycle, i.e., February 2019 to March 2022 (Chart III.4). Transmission to lending and deposit rates was higher in the case of foreign banks, as a greater proportion of lower duration deposits in their liabilities enabled relatively quicker adjustments in these rates in response to policy rate changes. Sectoral Lending Rates III.28 During 2021-22, the decline in WALR on outstanding loans has been broad-based across sectors, with sharp declines observed for the credit card segment followed by other personal loans, infrastructure, vehicles and large industry (Table III.3). External Benchmark III.29 Among the available options for external benchmark, a majority of banks, i.e., 39 out of 76 banks, have adopted the Reserve Bank’s policy repo rate as the external benchmark for floating rate loans to the retail and MSME sectors as at end-March 2022 (Table III.4). Twelve banks have adopted sector-specific benchmarks. | Table III.3: Sector-wise WALR of SCBs (Excluding RRBs) - Outstanding Rupee Loans | | (Per cent) | | End-Month | Agriculture | Industry (Large) | MSMEs | Infrastructure | Trade | Professional Services | Personal Loans | Rupee Export Credit | | Credit Card | Education | Vehicle | Housing | Other$ | | 1 | 2 | 3 | 4 | 5 | 6 | 7 | 8 | 9 | 10 | 11 | 12 | 13 | | Mar-20 | 10.07 | 9.22 | 10.51 | 9.67 | 8.92 | 9.90 | 28.90 | 10.53 | 10.01 | 8.59 | 12.05 | 7.31 | | Mar-21 | 9.68 | 8.27 | 9.73 | 8.87 | 8.51 | 8.44 | 31.90 | 9.47 | 9.59 | 7.55 | 10.94 | 6.76 | | Jun-21 | 9.58 | 8.24 | 9.61 | 8.68 | 8.38 | 8.23 | 30.49 | 9.47 | 9.38 | 7.56 | 10.98 | 6.51 | | Dec-21 | 9.42 | 7.99 | 9.33 | 8.51 | 8.20 | 8.26 | 30.67 | 9.32 | 9.24 | 7.52 | 10.53 | 6.95 | | Feb-22 | 9.38 | 7.93 | 9.27 | 8.33 | 8.15 | 8.06 | 30.54 | 9.32 | 9.10 | 7.48 | 10.40 | 7.14 | | Mar-22 | 9.35 | 7.76 | 9.28 | 8.31 | 8.14 | 8.11 | 30.51 | 9.30 | 9.06 | 7.46 | 10.22 | 6.55 | | Variation (Percentage points) | | 2020-21 | -0.39 | -0.95 | -0.78 | -0.80 | -0.41 | -1.46 | 3.00 | -1.06 | -0.42 | -1.04 | -1.11 | -0.55 | | 2021-22 | -0.33 | -0.51 | -0.45 | -0.56 | -0.37 | -0.33 | -1.39 | -0.17 | -0.53 | -0.09 | -0.72 | -0.21 | $: Other than housing, vehicle, education and credit card loans.
Source: Special Monthly Return VIAB, RBI. |
| Table III.4: External Benchmarks of Scheduled Commercial Banks - March 2022 | | Bank Group | Policy Repo Rate | CD | OIS | MIBOR | 3-Month T Bill | Sector Specific Benchmark* | Total | | 1 | 2 | 3 | 4 | 5 | 6 | 7 | 8 | | Public Sector Banks (12) | 12 | - | - | - | - | - | 12 | | Private Banks (21) | 17 | 1 | - | - | - | 3 | 21 | | Foreign Banks (43)# | 10 | - | 1 | 2 | 6 | 9 | 28 | | SCBs (76)# | 39 | 1 | 1 | 2 | 6 | 12 | 61 | CD: Certificate of Deposit. OIS: Overnight Index Swaps. -: Nil. MIBOR: Mumbai Inter-Bank Overnight Rate.
*: Sector specific benchmarks include MIBOR, OIS, 10-year G-sec, and CD rates.
#: Fifteen foreign banks reported nil.
Note: Figures in parentheses refer to the number of banks that responded to the survey.
Source: RBI. | III.30 In the case of loans linked to the policy repo rate, the spread in respect of fresh rupee loans (i.e., WALR over the repo rate) was the highest for education loans, followed by MSME loans (Table III.5). Among the domestic bank groups, the spreads charged by public sector banks (PSBs) for housing, education and other personal loans were lower than those of private sector banks, while for vehicle and MSME loans, the spreads charged were lower for private sector banks than for PSBs. | Table III.5: Loans Linked to External Benchmark – Spread of WALR (Fresh Rupee Loans) over Repo Rate (March 2022) | | (Percentage points) | | Bank Group | Personal Loans | MSME Loans | | Housing | Vehicle | Education | Other Personal Loans | | 1 | 2 | 3 | 4 | 5 | 6 | | Public Sector Banks | 2.85 | 3.23 | 4.28 | 3.17 | 4.32 | | Private Sector Banks | 3.47 | 2.79 | 5.45 | 6.06 | 4.12 | | Domestic Banks | 3.15 | 3.06 | 4.51 | 3.36 | 4.23 | | Source: RBI. |
III.31 A significant improvement has been observed in transmission since October 2019 in sectors where new floating rate loans have been mandatorily linked to the external benchmark (Chart III.5). The decline was the sharpest in the case of other personal loans (224 bps), followed by vehicle loans (209 bps) and MSME loans (200 bps). Over the same period, the decline in WALR on fresh rupee loans across all sectors was lower at 186 bps. 3. Agenda for 2022-23 III.32 The Department would support the conduct and formulation of monetary policy with high quality analysis of inflation and growth dynamics and their outlook, liquidity, and credit conditions. Against this backdrop, the Department would undertake the following: -
Prepare an economy-wide credit conditions index and anlyse its relationship with key macroeconomic variables; -
Evaluate drivers of inflation expectations and their role in inflation dynamics; and -
Study the investment behaviour of corporates/firms to understand constraints on investment. 4. Conclusion III.33 Looking ahead, the conduct of monetary policy will continue to be guided by the objective of achieving the medium-term target for consumer price index (CPI) inflation of 4 per cent within a band of +/- 2 per cent, while supporting growth. Evolving uncertainties on the horizon, particularly on account of the future course of the COVID-19 virus, the pace of monetary policy normalisation in major advanced economies, global commodity price dynamics and the fallout of geopolitical tensions will continue to shape the trajectory of policy going forward. The Reserve Bank will continue to manage and rebalance liquidity in a manner that is conducive to entrenching the recovery and fostering macroeconomic and financial stability, while maintaining adequate liquidity to meet the needs of the productive sectors of the economy.
|