The Indian economy renewed its tryst with the recovery from the pandemic in 2021-22, albeit interrupted by a virulent second wave of infections and a relatively milder third wave. Headline inflation spiked on repetitive supply shocks during the year, though reversion to the target was also evident as shocks receded. Monetary and credit conditions evolved in sync with the accommodative monetary policy stance, although global spillovers towards the close of the year led to some tightening in financial conditions and heightened volatility in financial markets. The intensification and materialisation of geopolitical risks in early 2022 overcast the global outlook, with EMEs including India, being the most vulnerable to spillovers. A robust recovery in tax revenues helped contain the gross fiscal deficit close to budgetary targets. The sustained strength of exports and revival in inbound remittances underpinned the viability of the balance of payments, with net capital flows also contributing to the accretion to foreign exchange reserves. II.1 THE REAL ECONOMY Global Economy1 II.1.1 Omicron, rising food prices and sticky inflation, the US Fed’s much anticipated lift-off, and escalation of geopolitical tensions towards the end of the year flaring up into conflict in early 2022 defined the macroeconomic and financial landscape during this Annual Report’s period under review. Over the first half of 2021, an uneven and divergent recovery had lifted the global economy out of the deep contraction imposed by the pandemic in the preceding year. According to the International Monetary Fund (IMF) in its World Economic Outlook of April 2022, world GDP expanded by 6.1 per cent in 2021 as against a contraction of 3.1 per cent in the previous year. After a sharp setback due to the virulent Delta variant of the coronavirus in the early part of 2021, the global recovery had regained some traction even as paths of growth were widely differentiated across jurisdictions by the size and durability of monetary and fiscal stimuli, and access to vaccines. Global growth lost pace in the second half of the year, beset by the highly transmissible but milder variant of COVID-19 – Omicron. Despite these waves superimposed on global supply chain and logistics disruptions, global trade recovered in the second half of the year and grew by 10.1 per cent in 2021. Underpinning this upturn, global manufacturing accelerated to 9.4 per cent in2021 from 4.2 per cent in 2020.2 II.1.2 Even as the release of pent-up spending supported aggregate demand, persisting supply disruptions fuelled inflation which increased markedly in the US, the Euro area and a number of emerging market economies (EMEs). Commodity prices increased sharply in 2021 from their lows a year ago as the nascent recovery in demand collided with supply bottlenecks. While fiscal and monetary policies remained largely accommodative, inflation ruling above targets forced several EMEs to tighten monetary policy, with advanced economy (AE) central banks following in their train. Tapers of pandemic-induced liquidity overhangs but without tantrums tightened financial conditions. In the financial markets, risk-off sentiment drove equity markets into correction. Bearish government bond market experienced hardening of real yields across AEs. As shorter-term yields began to reflect the shift in the monetary policy stance, the consequent flattening of the yield curve pointed to global growth momentum losing steam towards the close of 2021 and in early 2022. As risk aversion set in with geopolitical conflict, there was considerable re-pricing of financial assets. Consequently, gold prices have surged, also buoyed by stagflation concerns and rate hike expectations. Investors face a very different dynamic as fiscal and monetary policy support fades in the face of elevated levels of public debt3 with higher and persisting inflationary pressures across AEs and EMEs alike. Domestic Economy II.1.3 In 2021-22, India renewed its tryst with the recovery that had commenced in the second half of 2020-21 with the abatement of the first wave. The second wave took a grievous toll, however, pushing the nation into arguably the worst health crisis the country had ever faced (Chart II.1.1). Supported by continuing fiscal measures and congenial financial conditions engendered by monetary, regulatory and liquidity initiatives undertaken by the Reserve Bank, including some unconventional ones, the real GDP bounced back in Q2:2021-22 and grew at 1.3 per cent over Q2:2019-20. The recovery was further entrenched in Q3:2021-22 with GDP exceeding the corresponding pre-pandemic quarter by 6.2 per cent. In Q4, however, the third wave of the pandemic driven by the Omicron variant and more recently, geopolitical conflict has caused a loss of pace in the recovery and darkened the outlook.  II.1.4 Unlike in the first wave, the economic impact of the second wave of the pandemic was contained due to the localised nature of lockdowns and better adaptability to pandemic protocols. Growth impulses, rejuvenated by the receding of the second wave from June 2021, were fortified bythe pace and scale of inoculation.4 II.1.5 Turning to financial conditions, money markets were flush with abundant liquidity, with short-term interest rates aligned to the floor of the Reserve Bank’s liquidity adjustment facility (LAF), although they did firm up in the second half of the year as a result of rebalancing of liquidity towards auctions and away from the fixed rate reverse repo, a cessation of large liquidity injections through secondary market asset purchases and the lapsing of some extraordinary measures on due dates. In the debt markets, yields hardened in the second half of the year and spreads widened as market sentiment turned bearish on large issuances by governments (centre and states) and the recurring incidence of global spillovers as monetary policy stances diverged across the world. The Indian rupee (INR) traded range-bound, displaying strong mean reversion after every bout of volatility from global developments. The INR was also buoyed by sustained capital inflows in the form of foreign direct investment and portfolio flows attracted by a spate of initial public offerings (IPOs). Domestic equity indices outperformed the peer country indices in 2021. After two years of large gains, however, valuations of Indian equities were stretched by most conventional yardsticks. II.1.6 The Omicron-led third wave hit India at the end of December 2021. It, however, turned out to be short-lived. The spike in infections with high transmissibility was followed by a steep fall - daily infections peaked on January 20, 2022 with 3.47 lakh new cases and total 20.1 lakh active cases but began to subside thereafter. The mortality rate remained much below that of the second wave. High frequency indicators of economic activity suggest that the impact of third wave on the economy will likely be muted in comparison with the first two waves. II.1.7 Against this backdrop, an analysis of aggregate demand in the following sub-section is followed by an assessment of aggregate supply conditions. Sub-section 4 presents a drill-down into employment and labour market developments. The concluding sub-section provides some policy perspectives. 2. Aggregate Demand II.1.8 The second advance estimates (SAE) that were released by the National Statistical Office (NSO) on February 28, 2022 indicated that aggregate demand, measured by real GDP, registered a growth of 8.9 per cent in 2021-22, up from a contraction of 6.6 per cent in the previous year (Table II.1.1 and Appendix Table 1). Consequently, the GDP level surpassed the pre-pandemic level of 2019-20 by 1.8 per cent. II.1.9 In the first half of 2021-22, real GDP registered double-digit growth which tapered in the second half due to the gradual waning of base effects. The underlying momentum remained strong, however, as evident in a sharp rebound in the seasonally adjusted annualised growth rate (SAAR) in Q2:2021-22 that appears to have been sustained in subsequent quarters (Chart II.1.2 and Appendix Table 2). | Table II.1.1. Real GDP Growth | | Component | Growth (per cent) | | 2017-18 | 2018-19 | 2019-20 | 2020-21 | 2021-22 | | 1 | 2 | 3 | 4 | 5 | 6 | | I. Total Consumption Expenditure | 7.1 | 7.0 | 4.9 | -4.5 | 7.2 | | Private | 6.2 | 7.1 | 5.2 | -6.0 | 7.6 | | Government | 11.9 | 6.7 | 3.4 | 3.6 | 4.8 | | II. Gross Capital Formation | 14.5 | 6.2 | -5.2 | -13.8 | 21.5 | | Gross Fixed Capital Formation | 7.8 | 11.2 | 1.6 | -10.4 | 14.6 | | Change in Stocks | 68.3 | 27.3 | -58.8 | -110.7 | -1,723.9 | | Valuables | 40.2 | -9.7 | -14.2 | 26.4 | 63.0 | | III. Net Exports | | | | | | | Exports | 4.6 | 11.9 | -3.4 | -9.2 | 21.1 | | Imports | 17.4 | 8.8 | -0.8 | -13.8 | 29.9 | | IV. GDP | 6.8 | 6.5 | 3.7 | -6.6 | 8.9 | | Source: NSO. | II.1.10 Within this turnaround during the year, there was a compositional shift among constituents of aggregate demand (Chart II.1.3). Private final consumption expenditure (PFCE) remained weak by historical standards although it managed to surpass its pre-pandemic level by 1.2 per cent. With contact-intensive activity yet to normalise fully, discretionary consumption spending lacked traction. Government consumption expenditure accelerated in 2021-22, providing an upward thrust to aggregate demand. Gross fixed capital formation (GFCF) rebounded sharply, primarily backed by public investment as government prioritised capital expenditure. Exports recovered strongly in spite of hostile international environment and entered into positive growth territory from Q4 of 2020-21. Propelled by surging import demand and rising international commodity prices, especially of crude, the current account shifted from a surplus to modest deficits from Q2:2021-22.
Consumption II.1.11 Private consumption - the mainstay of aggregate demand in India - partially recuperated with the gradual relaxation of restrictions on mobility and the accelerated pace of vaccination, both enabling a restoration of consumer confidence. Spending on consumer durables improved on a y-o-y basis and discretionary expenditure mainly took the form of revenge spending. A combination of factors, viz., robust growth in agriculture and allied activities, support from the government in the form of cut in excise duty on petrol and diesel, and continuation of direct benefit transfer (DBT) schemes helped shore up confidence and boost consumption spending. II.1.12 With the second wave’s intensity, private consumption sank below its pre-pandemic level in Q1:2021-22 and consumer confidence plummeted to an all-time low. The wave peaked during the month of May 2021 and thereafter, conditions started to improve. In the subsequent rounds, the Reserve Bank’s consumer confidence survey exhibited gradual improvement in consumer perceptions pertaining to both the current situation and future expectations except a dip in the January 2022 round at the peak of Omicron variant impact of COVID-19. PFCE rebounded in Q2 and Q3 of 2021-22, with an uptick in y-o-y terms as well as on a sequential basis (in level terms). The release of pent-up demand coupled with an upbeat festival season sentiment was partially offset by supply-side disruptions in the form of shortages of supply of coal, electricity and, particularly, semiconductor chips. This was manifested in moderation in growth in sales of passenger vehicles, motorcycles, and two-wheelers during the second half of the year. On the other hand, an encouraging development was the gradual pick-up in bank credit, especially in the personal loans segment. Credit growth also accelerated in respect of agriculture, MSMEs and select services. II.1.13 Indicators of rural demand reveal a slackness, vis-a-vis urban demand despite resilience in agriculture and allied activities during the first half of the year. Furthermore, a bountiful monsoon, adequate soil moisture and replenished reservoir levels brightened its prospects for the rest of the year. However, the last quarter reflected signs of demand slowdown as firms increasingly passed on cost pressures to end use customers. Investment and Saving II.1.14 The rate of gross domestic investment in the Indian economy, measured by the ratio of gross capital formation (GCF) to GDP at current prices, nosedived to 27.3 per cent in 2020-21 from 30.7 per cent in the preceding year. Although data on GCF are not yet available for 2021-22, movements in its constituents suggest an uptick led by government spending on infrastructure. The ratio of real GFCF to GDP surged to 32.0 per cent in 2021-22 from 30.5 per cent in 2020-21, reflecting a revival of investment sentiments. GFCF registered an acceleration of 14.6 per cent in 2021-22, on the back of a favourable base effect. II.1.15 Among the components of GFCF, recovery in the construction sector was facilitated by the focus of the central government on infrastructure, in addition to an uptick in the housing segment on favourable interest rates and attractive offers by developers. This resurgence is evident in its proximate coincident indicator – cement production (Chart II.1.4). A similar recovery became evident in investment in machinery and equipment. Both its proximate coincident indicators - imports and production of capital goods - registered sharp expansion in 2021-22. II.1.16 As per the order books, inventories and capacity utilisation survey (OBICUS) of the Reserve Bank, capacity utilisation in manufacturing recovered to 68.3 per cent in Q2 and further to 72.4 per cent in Q3:2021-22 after a drop to 60.0 per cent in Q1:2021-22 in the wake of the second wave of the COVID-19. The inventory to sales ratio increased in Q1:2021-22, reflecting the containment measures under which the economy was operating. With the subsequent improvement in sales and stable levels of inventories maintained by manufacturing companies, the inventory to sales ratio declined sequentially in Q2 and Q3:2021-22. The respondents of the 97th round of the Industrial Outlook Survey (IOS) assessed that there was improvement in demand conditions in terms of production, order books and employment situation in Q4:2021-22, albeit at a slower pace than Q3:2021-22. Capacity utilisation and the overall financial situation are expected to improve further in Q1:2022-23 while business expectations remained high, though optimism has moderated from the previous quarter. Respondents expressed higher optimism for growth in selling prices, indicating more pricing power combined with input cost pressures in Q1:2022-23. 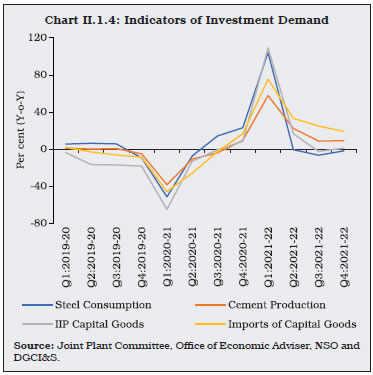 II.1.17 The rate of gross domestic saving had dropped to 27.8 per cent of gross national disposable income (GNDI) in 2020-21 from 29.4 per cent a year ago due to dissaving of the general government sector and a fall in saving of the non-financial corporations. The financial saving of the household sector – the most important source of funds – surged by 3.6 percentage points to 11.5 per cent of GNDI in 2020-21, the highest in over two decades (Table II.1.2 and Appendix Table 3). The reduction in discretionary spending amidst the pandemic and the associated forced saving as well as a surge in precautionary saving on concerns relating to income flows in the near-term boosted saving by households. | Table II.1.2: Financial Saving of the Household Sector | | (Per cent of GNDI) | | Item | 2012-13 | 2013-14 | 2014-15 | 2015-16 | 2016-17 | 2017-18 | 2018-19 | 2019-20 | 2020-21 | | 1 | 2 | 3 | 4 | 5 | 6 | 7 | 8 | 9 | 10 | | A. Gross Financial Saving | 10.5 | 10.4 | 9.9 | 10.7 | 10.4 | 11.9 | 11.8 | 11.7 | 15.5 | | of which: | | | | | | | | | | | 1. Currency | 1.1 | 0.9 | 1.0 | 1.4 | -2.1 | 2.8 | 1.4 | 1.4 | 1.9 | | 2. Deposits | 6.0 | 5.8 | 4.8 | 4.6 | 6.3 | 3.0 | 4.2 | 4.2 | 6.3 | | 3. Shares and Debentures | 0.2 | 0.2 | 0.2 | 0.2 | 1.1 | 1.0 | 0.4 | 0.4 | 0.5 | | 4. Claims on Government | -0.1 | 0.2 | 0.0 | 0.5 | 0.7 | 0.9 | 1.1 | 1.3 | 1.6 | | 5. Insurance Funds | 1.8 | 1.8 | 2.4 | 1.9 | 2.3 | 2.0 | 2.0 | 1.8 | 2.6 | | 6. Provident and Pension Funds | 1.5 | 1.5 | 1.5 | 2.1 | 2.1 | 2.1 | 2.1 | 2.2 | 2.5 | | B. Financial Liabilities | 3.2 | 3.1 | 3.0 | 2.7 | 3.0 | 4.3 | 4.0 | 3.9 | 4.0 | | C. Net Financial Saving (A-B) | 7.2 | 7.2 | 6.9 | 7.9 | 7.3 | 7.5 | 7.8 | 7.9 | 11.5 | GNDI: Gross National Disposable Income.
Note: Figures may not add up to total due to rounding off.
Source: NSO. | II.1.18 In 2020-21, saving had exceeded investment for the first time since 2004-05. The surplus from the household sector amounted to 11.8 per cent of GDP in 2020-21. The resource gap of private non-financial corporations closed in 2020-21, due to a curtailment in investment amidst the pandemic. As alluded to earlier, the drawdown on saving by the general government sector increased due to increase in spending to ameliorate the impact of the pandemic (Chart II.1.5).
3. Aggregate Supply II.1.19 Aggregate supply, measured by gross value added (GVA) at basic prices, expanded by 8.3 per cent in 2021-22 after registering a contraction of 4.8 per cent in 2020-21. With the gradual unshackling of the economy from pandemic-related restrictions, the three-quarter moving average of seasonally adjusted annualised growth rate (MA-SAAR) exhibited an upturn in Q2:2021-22 and remained resilient in Q3:2021-22 (Chart II.1.6). II.1.20 The acceleration in GVA growth was facilitated by a sustained recovery in the industrial and the services sectors, albeit on a favourable base. The agricultural sector provided a cushion to the economy, staying resilient throughout the year (Table II.1.3). | Table II.1.3: Real GVA Growth | | (Per cent) | | Sector | 2017-18 | 2018-19 | 2019-20 | 2020-21 | 2021-22 | | 1 | 2 | 3 | 4 | 5 | 6 | | I. Agriculture, Forestry and Fishing | 6.6 | 2.1 | 5.5 | 3.3 | 3.3 | | II. Industry | 6.1 | 4.9 | -2.2 | -1.8 | 10.4 | | II.1 Mining and Quarrying | -5.6 | -0.8 | -1.5 | -8.6 | 12.6 | | II.2 Manufacturing | 7.5 | 5.4 | -2.9 | -0.6 | 10.5 | | II.3 Electricity, Gas, Water Supply and Other Utility Services | 10.6 | 7.9 | 2.2 | -3.6 | 7.8 | | III. Services | 6.2 | 7.1 | 5.7 | -7.8 | 8.8 | | III.1 Construction | 5.2 | 6.5 | 1.2 | -7.3 | 10.0 | | III.2 Trade, Hotels, Transport, Communication and Services related to Broadcasting | 10.3 | 7.2 | 5.9 | -20.2 | 11.6 | | III.3 Financial, Real Estate and Professional Services | 1.8 | 7.0 | 6.7 | 2.2 | 4.3 | | III.4 Public Administration, Defence and Other Services | 8.3 | 7.5 | 6.3 | -5.5 | 12.5 | | IV. GVA at Basic Prices | 6.2 | 5.8 | 3.8 | -4.8 | 8.3 | | Source: NSO. | II.1.21 Globally, COVID-19 induced shutdowns caused output losses in the manufacturing sector and overall GDP. In the case of India, the sharp contraction in Q1:2020-21 during the stringent nationwide lockdown was followed by a rebound in profits of the corporate non-financial sector (Box II.1.1). Box II.1.1
Corporate Performance during the Pandemic: The Role of Corporate Tax Rate Cut Indian corporates were shielded from the pandemic by the rationalisation in conduct of business that focused on cost-saving and a corporate tax rate cut in September 20195 (RBI, 2021). This tax cut was in league with other countries as observed across the Organisation for Economic Cooperation and Development (OECD) countries, the average corporate income tax rate declined from 32.5 per cent in 2000 to 23.9 per cent in 2018, and similar measures were undertaken in the US and the UK (Kopp et al., 2019). Before the tax rate cut, the effective rate for the manufacturing sector was 27.8 per cent, while for the non-manufacturing sector, it was higher at 30.5 per cent on an average, impinging upon the competitiveness of Indian exports (Tables 1a and 1b). | Table 1a: Effective Tax Rate for Manufacturing | | Industry Group | Share in Industrial GVA* | Effective Tax Rate Before Tax Cut | Tax Benefit
(percentage points) | | 1 | 2 | 3 | 4 | | Food Beverages and Tobacco | 11.1 | 32.8 | 7.6 | | Textiles | 7.0 | 27.7 | 2.5 | | Metal Products | 15.4 | 27.4 | 2.2 | | Machinery and Equipment | 28.1 | 26.8 | 1.7 | | Transport Equipment | 13.6 | 30.9 | 5.8 | | Refined Petroleum | 6.7 | 21.6 | 0.0 | | Pharmaceuticals | 7.4 | 25.4 | 0.2 | | Rubber and Plastic | 4.6 | 29.5 | 4.3 | *: Shares in GVA are calculated based on annual figures for 2019-20 from National Account Statistics 2022.
Source: Union Budget documents. |
| Table 1b: Effective Tax Rate for Non-Manufacturing | | Sector | Share in Services GVA | Effective Tax Rate Before Tax Cut | Tax Benefit
(percentage points) | | 1 | 2 | 3 | 4 | | Wholesale and Retail Trade | 20.0 | 31.4 | 6.2 | | Transport and Logistics | 7.7 | 29.5 | 4.3 | | Real Estate | 1.2 | 26.8 | 1.6 | | Financial Services | 9.5 | 37.0 | 11.8 | | IT and Related Services | 8.5 | 29.0 | 3.9 | | Source: Union Budget documents. | A difference-in-difference (DID) panel regression to assess the differential impact of the tax rate cut attempts to test the hypothesis that firms in sectors which benefitted from the tax rate cut in terms of lower effective corporate tax rate (ETR) registered higher net profit6 margin (NPM) during the post-tax cut period than in the pre-tax cut period. The reduction in the corporate tax rate would only increase profit after tax (PAT), with profit before depreciation, interest and tax (PBDIT) remaining unchanged. As the ETR at a firm level is not directly available, it is computed for each firm as the ratio of corporate tax paid to total taxable income (Guha, 2007). Firms enjoying a reduction by at least five percentage points compared to the pre-tax cut period average constitute the treatment group and the rest form the control group. The period considered is from Q1:2018-19 to Q4:2020-21. The pre-tax cut period covers the period Q1:2018-19 to Q1:2019-20, while the period Q2:2019-20 to Q4:2020-21 represents the post-tax cut period.7 Net profit margin (NPM) turns out to be significantly higher for firms in the treatment group in both manufacturing and non-manufacturing sectors. Net profit margin improves significantly in the post-tax cut period (Table 2). Furthermore, the impact of the tax rate cut on profitability is stronger for the non-manufacturing sector than for the manufacturing sector. | Table 2: Empirical Results | | Dependent Variable | NPM Manufacturing
(Before Tax) | NPM Manufacturing
(After Tax) | NPM Non-manufacturing
(Before Tax) | NPM Non-manufacturing
(After Tax) | | 1 | 2 | 3 | 4 | 5 | | Intercept | 26.69* | 6.4648*** | 27.13* | 15.8048*** | | | (11.43) | (0.3125) | (11.29) | (0.4786) | | Time (τ) | -13.58 | 2.3482*** | -13.81 | 2.1562** | | | (22.28) | (0.5951) | (22.05) | (0.9299) | | Treatment (θ) | 37.45** | 2.4190*** | 36.69** | 3.8319*** | | | (13.92) | (0.3830) | (13.75) | (0.5813) | | Interaction (δ) | 26.12 | 0.5631 | 25.66 | 0.7052 | | | (27.09) | (0.7262) | (26.77) | (1.1268) | | No. of Observations | 8269 | 8269 | 5934 | 5934 | | F | 27.64 | 2.764 | 2.716 | 20.04 | | Prob>F | 0.0000 | 0.04044 | 0.04315 | 0.0000 | ***: Significant at 1 per cent level. **: Significant at 5 per cent level.
*: Significant at 10 per cent level.
Note: Figures in the parentheses denote the standard errors.
Source: RBI staff estimates. | References: 1. Guha, Atulan (2007), ‘Company Size and Effective Corporate Tax Rate Study on Indian Private Manufacturing Companies’, Economic and Political Weekly, Vol. 42, Issue 20, Pages 1869-1874. 2. Kopp, E., L. Daniel, M. Susanna (2019), ‘U.S. Investment Since the Tax Cuts and Jobs Act of 2017’, Working Paper No. 19/120, International Monetary Fund, Washington, D.C. 3. RBI (2021), ‘Contours of Economic Recovery’, Inaugural Address by Shri Shaktikanta Das, Governor, Reserve Bank of India at 8th SBI Banking & Economics Conclave, November 16, Mumbai. | Agriculture and Allied Activities II.1.22 Agriculture and allied activities posted a robust performance in 2021-22, even though the second wave of the pandemic affected rural areas on a larger scale than during the first wave. The sector registered a growth of 3.3 per cent in 2021-22, with record production in foodgrains. The strong growth was aided by a sharp catch-up in south-west monsoon (SWM) and kharif sowing in the month of September 2021. Except for rice and wheat, the prospects for rabi production was good with robust sowing, coupled with adequate soil moisture and replenished reservoir levels. The buoyancy in the agriculture sector was mirrored in sales of tractors and fertilisers, which consistently outstripped pre-pandemic levels for the major part of 2021-22. 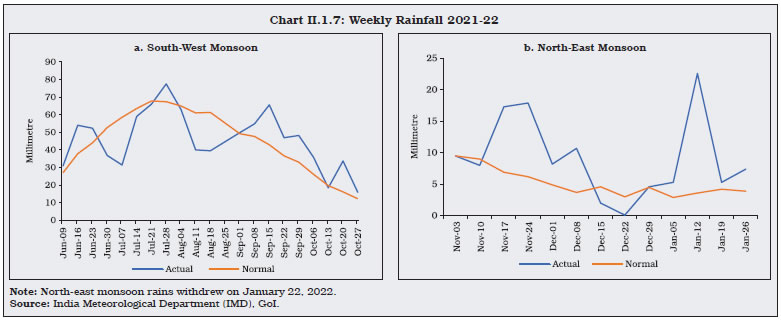 II.1.23 In 2021, the SWM made its onset on June 3, but lost momentum during end-June to mid-July and again in August, with uneven distribution of rainfall across states (Chart II.1.7a). Notwithstanding these two weak spells of rainfall during the critical sowing months of July and August, rainfall revived subsequently and ended on a positive note for the season, i.e., ‘normal’, with a deficit of 1 per cent from the long period average (LPA) as on September 30, 2021. Kharif sowing which stalled in July and August, subsequently, caught up and surpassed the previous year’s sowing levels by 0.2 per cent and 5-year average levels by 4.1 per cent as on September 30, 2021. II.1.24 Subsequently, the delayed withdrawal of the SWM and simultaneous start of the north-east monsoon (NEM) on October 25, 2021 created congenial soil moisture conditions and raised reservoir levels (Chart II.1.7b). As on January 27, 2022, the reservoir level stood at 66 per cent of full reservoir capacity as compared with the decadal average of 53 per cent (Chart II.1.8). II.1.25 The jump in rabi acreage this year was mainly driven by higher sowing of oilseeds, especially mustard and rapeseed, and gram and lentils, offsetting the lower sowing of wheat. Consequently, total foodgrain production in 2021-22 is placed at 3,145.1 lakh tonnes, in the third advance estimates (3rd AE), 1.2 per cent higher than 2020-21 final estimates (FE) [Table II.1.4]. The downward revision of foodgrain production estimate by 0.5 per cent (3rd AE over 2nd AE) is mainly on account of yield loss in wheat due to persistent heatwaves in 2022 (March and April). Horticulture crops logged a production at 3,332.5 lakh tonnes (1st AE) during 2021-22, 0.4 per cent lower than 2020-21 FE due to lower output of tomato, other vegetables, spices, flowers, aromatics and medicinal plants, while the output of total fruits and onion have registered an increase. 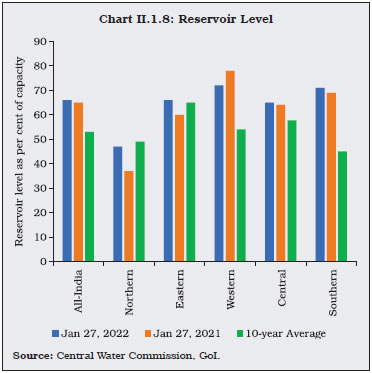
| Table II.1.4: Agricultural Production 2021-22 | | (Lakh tonnes) | | Crop | Season | 2020-21 | 2021-22 | 2021-22 (3rd AE) Variation (Per cent) | | 3rd AE | Final | Target | 3rd AE | Over 2020-21 | Over 2021-22 | | 3rd AE | FE | Target | | 1 | 2 | 3 | 4 | 5 | 6 | 7 | 8 | 9 | | Foodgrains | Kharif | 1,483.6 | 1,505.8 | 1,514.3 | 1,549.3 | 4.4 | 2.9 | 2.3 | | | Rabi | 1,570.8 | 1,601.7 | 1,558.8 | 1,595.9 | 1.6 | -0.4 | 2.4 | | | Total | 3,054.4 | 3,107.4 | 3,073.1 | 3,145.1 | 3.0 | 1.2 | 2.3 | | Rice | Kharif | 1,043.0 | 1,052.1 | 1,043.0 | 1,110.4 | 6.5 | 5.5 | 6.5 | | | Rabi | 171.6 | 191.6 | 168.0 | 186.2 | 8.5 | -2.8 | 10.8 | | | Total | 1,214.6 | 1,243.7 | 1,211.0 | 1,296.6 | 6.8 | 4.3 | 7.1 | | Wheat | Rabi | 1,087.5 | 1,095.9 | 1,100.0 | 1,064.1 | -2.2 | -2.9 | -3.3 | | Coarse Cereals | Kharif | 355.7 | 367.5 | 373.1 | 356.4 | 0.2 | -3.0 | -4.5 | | | Rabi | 140.9 | 145.7 | 139.0 | 150.6 | 6.9 | 3.4 | 8.3 | | | Total | 496.6 | 513.2 | 512.1 | 507.0 | 2.1 | -1.2 | -1.0 | | Pulses | Kharif | 84.9 | 86.2 | 98.2 | 82.5 | -2.8 | -4.3 | -16.0 | | | Rabi | 170.9 | 168.4 | 151.8 | 195.0 | 14.1 | 15.8 | 28.5 | | | Total | 255.8 | 254.6 | 250.0 | 277.5 | 8.5 | 9.0 | 11.0 | | Oilseeds (total) | Kharif | 245.5 | 237.2 | 260.0 | 247.1 | 0.6 | 4.1 | -5.0 | | | Rabi | 120.1 | 122.2 | 124 | 137.9 | 14.8 | 12.8 | 11.2 | | | Total | 365.7 | 359.5 | 384.01 | 385.0 | 5.3 | 7.1 | 0.3 | | Sugarcane | Total | 3,928.0 | 4,054.0 | 3,970.0 | 4,305.0 | 9.6 | 6.2 | 8.4 | | Cotton # | Total | 364.9 | 352.5 | 370.0 | 315.4 | -13.6 | -10.5 | -14.7 | | Jute & Mesta ## | Total | 96.2 | 93.5 | 106.0 | 102.2 | 6.3 | 9.3 | -3.6 | #: Lakh bales of 170 kg each. ##: Lakh bales of 180 kg each. AE: Advance Estimates. FE: Final Estimates.
Source: Ministry of Agriculture and Farmers Welfare, GoI. | II.1.26 In line with the approach adopted in recent years, the minimum support prices (MSPs) announced in 2021-22 for both rabi and kharif crops ensured a minimum return of 50 per centover the cost of production.8 The prices were raised in the range of 1.1 - 8.6 per cent across crops. The procurement level at 503.42 lakh tonnes for rice as on March 31, 2022, during the kharif marketing season of 2021-22, was 8.2 per cent higher than the corresponding period of last year (Chart II.1.9). The stock of cereals remained comfortable at 7.2 and 1.4 times the quarterly buffer norms for rice and wheat, respectively, as on March 31, 2022 (Chart II.1.10). II.1.27 Stock levels of cereals were maintained despite the additional free distribution of foodgrains over and above the normal National Food Security Act (NFSA) entitlements of 5 kilogram/person/month to all NFSA beneficiaries under the Pradhan Mantri Garib Kalyan Anna Yojana (PM-GKAY) to alleviate the impact of the pandemic (Chart II.1.11).
II.1.28 In recent years, the impact of climate change in terms of volatile rainfall intensity, increase in extreme events and rising temperature has implications for the outlook for agriculture and in turn, for overall economic performance. In this regard, central banks are being drawn into climate risk management because of the implications of extreme weather for business cycles, and monetary policy. Physical and transition risks for the financial sector have raised financial stability concerns among central banks (Box II.1.2). Box II.1.2
Role of Central Banks in Climate Change Central banks across the world are gearing up to manage climate risks to macroeconomic and financial stability (Issing, 2021; RBI, 2021; NGFS, 2020), [Table 1]. Using two types of methodologies, i.e., the Integrated Assessment Models (IAMs) by the International Institute for Applied Systems Analysis (IIASA) [modelling primarily transition risk] and Network for Greening the Financial System-Climate Analytics (NGFS-CA) [modelling primarily physical risk], the implications for inflation and economic growth for India are assessed under the following scenarios: (a) Net zero 2050 (target of achieving net zero CO2 emissions around 2050); (b) limiting global warming to below 20C (though estimates suggest that a target of 1.50C may be needed for the net zero target); (c) divergent net zero (achieving net zero as above but with divergent policies across sectors, such as with faster phase out of oil use entailing higher costs); (d) delayed transition (policies which are consistent with 20C target but under which adjustment is backloaded as a result of which annual emissions do not decrease till 2030); (e) nationally determined contributions (NDCs) [under which policies are pledged by nations even if not implemented]; and (f) current policies (only currently committed policies are implemented, leading to least emission reduction and high physical risks). | Table 1: Commitments by Select Central Banks on Climate Change | | Central bank | Explicit Commitment | | European Central Bank | “Climate change can affect price stability. Therefore, we will do our part within our mandate to tackle it.” | | Bank of England | “We are not here to “solve” climate change or drive the transition…But central banks do have a role to play, and an important one at that.” | | Federal Reserve Board, USA | “While the primary responsibility for addressing climate change itself rests with elected officials, the Federal Reserve is committed to working within our existing mandates and authorities to address the implications of climate change, particularly the regulation and supervision of financial institutions and the stability of the broader financial system.” | | Reserve Bank of India (RBI) | “… the Reserve Bank, keeping in view our national commitments, priorities and complexity of our financial system, commits to: (a) exploring how climate scenario exercises can be used to identify vulnerabilities in the Reserve Bank supervised entities' balance sheets, business models and gaps in their capabilities for measuring and managing climate-related financial risks; (b) integrating climate-related risks into financial stability monitoring; and (c) building awareness about climate-related risks among regulated financial institutions and spreading knowledge about issues relating to climate change and methods to deal with them accordingly”. | | Source: Central bank websites and RBI (2021). | Energy consumption and CO2 emissions are significantly reduced under the scenarios involving global coordination to control temperature rise (Chart 1). However, they are associated with a significant rise in commodity and carbon prices. Higher carbon prices can feed into inflation following higher input costs. By contrast, the ‘NDCs’ and ‘current policies’ scenarios are not inflationary, but they may come with a higher long-run physical risk.
The NGFS-CA model is employed to assess how physical risk can affect India’s economic growth. Interestingly, the ambitious plans for emission reduction, although inflationary, may cause limited loss in output growth than the scenario of ‘current policies’ which may result in a substantial loss in output and productivity over time (Chart 2). In sum, the physical and transition risks either individually or together may be high for India under the ‘current policies’ scenario. A successful implementation of emission reduction for India carries inflationary risks, which will need to be managed through carefully crafted transition plans. The output losses associated with the transition may be limited. References: 1. Issing, O. (2021), ‘Central Banks – Independent or Almighty?’ SAFE Policy Letter, No. 92. 2. NGFS (2020), ‘Guide for Supervisors Integrating Climate-related and Environmental Risks into Prudential Supervision’. 3. RBI (2021), ‘Statement of Commitment to Support Greening India’s Financial System – NGFS’, Reserve Bank of India. | Industrial Sector II.1.29 The industrial sector, which was severely affected by the first wave of the pandemic, recovered with the easing of mobility restrictions in 2021-22. The second and third wave of the pandemic resulted in some moderation in the momentum of recovery. Industrial output measured by the index of industrial production (IIP) expanded by 11.4 per cent during 2021-22 as against a contraction of 8.4 per cent in the previous year (Charts II.1.12a and II.1.12b). However, manufacturing capacity utilisation continues to drag (Chart II.1.12c). II.1.30 Within the manufacturing sector, recovery picked up in the second half, as the impact of second wave of COVID-19 subsided. Cumulatively, in 2021-22, of the 23 industry groups, eight recorded expansion over 2019-20 levels. In terms of use-based classification, infrastructure goods registered robust growth as increased activity in the construction sector led recovery. Other categories of intermediate and primary goods also recovered even as investment scenario remained muted with consumer demand yet to fully recover, as reflected in contraction in capital goods and consumer durables goods segment, over pre-pandemic 2019-20 (Chart II.1.13).
II.1.31 In India, micro, small and medium enterprises (MSMEs), which contribute about a third of the total gross value added (GVA) and provide employment to around 11 crore people was badly hit by the pandemic (Box II.1.3). Box II.1.3
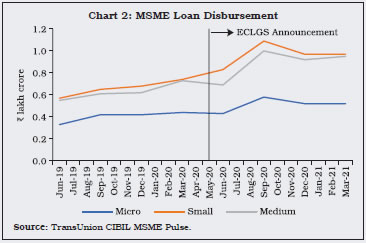
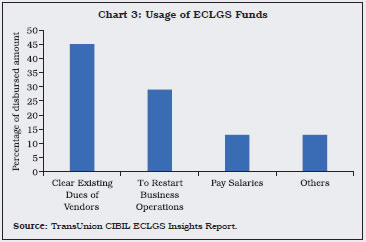
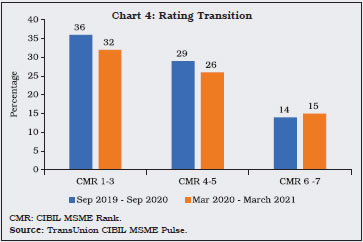
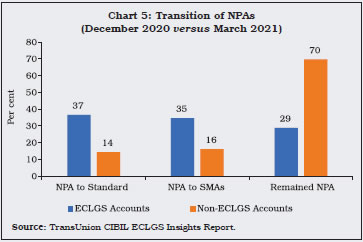
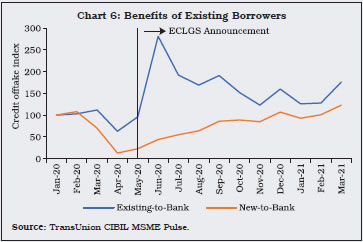
Impact of COVID-19 Relief Measures on Small Business Financing The GoI and the Reserve Bank introduced several policy measures to support the MSME sector during the pandemic (RBI, 2021a, 2021b). Following the announcement of the emergency credit line guarantee scheme (ECLGS) in May 2020,9 MSME loan demand increased sharply, particularly credit disbursements to small enterprises with loan sizes of less than ₹10 lakh during Q2:2020-21 (Charts 1 and 2). Nearly half of these loans were used to clear the dues of vendors providing raw materials; one-third was used to restart businesses, and the remaining amount was used for payment of salaries and to meet other expenses (Chart 3). Of about 15 lakh ECLGS accounts, 88 per cent are standard assets, 10 per cent are special mention accounts (SMAs), and 2 per cent are non-performing assets (NPAs) [CIBIL, 2021a]. Out of total NPAs, the transition from NPAs to standard assets were significantly higher in ECLGS accounts than non-ECLGS accounts of the same borrowers during 2021-22 (Charts 4 and 5). The scheme, however, benefitted firms that already had a relationship with a bank rather than new borrowers (CIBIL, 2021b). In February 2021, the Reserve Bank announced a deduction of loans given to new borrowers in the MSME sector from the cash reserve ratio (CRR) maintenance by banks. This measure increased the availability of loanable funds to new MSME sector borrowers, as loans to new borrowers grew almost at the same pace as for existing borrowers (Chart 6). Credit growth (y-o-y) in medium-sized industries accelerated post-announcement of the ECLGS scheme (Chart 7). 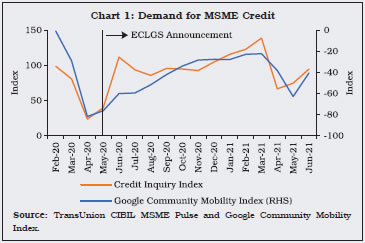
 A difference-in-difference analysis to estimate the causal effect of the ECLGS scheme on credit growth in the MSME sector vis-à-vis other sectors of the economy, based on monthly data from March 2016 to October 2021, reveals that several policy measures including the ECLGS contributed to about 35 per cent and 23 per cent of credit growth in the medium-scale industry, and micro and medium industry together, respectively (Table 1). 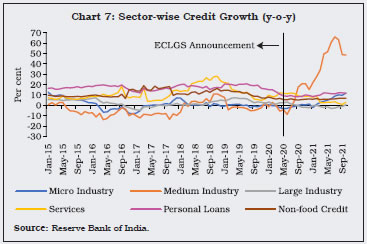
| Table 1: Empirical Estimates of the Impact of Policy Measures on MSME Credit Growth | | | Annual Rate of Credit Growth (per cent) | | Micro | Medium | Micro and Medium | | OECD India Composite Leading Indicator | 0.27 *** | 0.27 *** | 0.27 *** | | | (0.10) | (0.09) | (0.09) | | Sector Dummy*ECLGS Dummy | -4.47 | 35.29 *** | 23.12 *** | | | (3.44) | (2.86) | (2.66) | | R2 | 0.20 | 0.45 | 0.36 | ***: Significant at 1 per cent level. **: Significant at 5 per cent level. *: Significant at 10 per cent level.
Note: 1. In the analysis, ECLGS dummy takes value 1 after May 2020, and 0 otherwise. The sector dummy takes value 1, if the sector is micro, medium, micro and medium, otherwise, it takes value 0. There are three sectoral dummies for the above three categories. Along with the reported interaction term of dummies, separate dummies are considered independently and controlled for lending rate and asset quality review undertaken during 2015, however, the results are not provided due to space constraints.
2. Figures in the parentheses denote the standard errors.
Source: RBI staff estimates. | References: 1. CIBIL (2021a), ‘ECLGS Insights Report’, TransUnion CIBIL, December. 2. CIBIL (2021b), ‘ECLGS Pulse’, TransUnion CIBIL, June. 3. RBI. (2021a), ‘Credit to MSME Entrepreneurs’, Notification, May 5. 4. RBI. (2021b), ‘Statement on Development and Regulatory Policies’, Press Release, April 7. | II.1.32 The mining sector recorded resilience in 2021-22, registering growth both year-on-year and over pre-pandemic 2019-20. Electricity generation also expanded in H1:2021-22 – led by a double digit expansion in thermal electricity generation over a year ago, even as hydro and nuclear electricity generation recorded a contraction. Renewable energy, which accounts for about 11 per cent of total generation, recorded a double-digit expansion over pre-pandemic levels during H1:2021-22. In H2:2021-22, electricity generation moderated on account of low thermal electricity generation in Q3, due to supply disruptions resulting from unseasonal rains and coal shortage. In H2:2021-22, renewables continued to register robust growth, while nuclear and hydro electricity generation recovered, posting double digit growth over the corresponding period a year ago. II.1.33 The Union Budget 2022-23 has made an additional allocation of ₹19,500 crore for production linked incentive (PLI) for manufacturing of high efficiency solar modules. Measures were also announced to increase domestic production of capital goods, electronics, chemicals and gems and jewellery. Other incentives for production included, extension of the concessional tax regime by one year and measures to ease doing business in special economic zones (SEZs) units. On the industry front, tax incentives to startups have been extended by one year. II.1.34 The COVID-19 pandemic caused supply chain disruptions globally. These disruptions were manifested in reduced access to low cost labour, clogged ports, shortages of semiconductor chips, containers and ships, and other commodities (Box II.1.4). Box II.1.4
Impact of Supply Chain Disruptions on GDP Growth and
Labour Markets amidst the COVID-19 Shock In order to assess the impact of global supply chain disruptions on India’s GDP growth, GSCDCI (Global Supply Chain Disruption Cost Index) is estimated by extracting an underlying common factor from four variables10 using the dynamic factor (DF) approach (Chart 1). An increase in GSCDCI indicates that there are tighter supply side constraints, and these, could potentially cause a downside risk to overall GDP growth. A group of AR(1) models of GDP growth, augmented by high-frequency 9-indicator and 15-indicator dynamic factors, that track economic activity (Bhadury et al., 2021), is employed to obtain baseline estimates of GDP growth forecasts and are summarised in Table 1. To quantify the impact of GSCDCI on GDP growth forecasts, the same set of baseline models are re-estimated, augmented by GSCDCI. The model findings suggest that a 1 unit (year-on-year) tightening in GSCDCI (or supply constraints) could have lowered GDP growth in 2021-22 by around 26 basis points (bps). If global supply chain disruptions persist at the same level as in 2021-22, it could entail a cumulative downside risk to baseline growth projection.
| Table 1: Assessing the impact of GSCDCI on GDP | | | GDP YoY Seasonally Adjusted | GDP YoY Seasonally Adjusted | GDP YoY Seasonally Adjusted | GDP YoY Seasonally Adjusted | | Own Lag | 0.1 | 0.14** | 0.11* | 0.14** | | (0.07) | (0.07) | (0.07) | (0.07) | | DF9 | 7.26*** | 7.81*** | | | | (0.58) | (0.56) | | | | DF15 | | | 7.40*** | 7.57*** | | | | (0.56) | (0.56) | | GSDCI(-1) | | -0.53*** | | -0.26* | | | (0.15) | | (0.15) | | Constant | 2.33*** | 1.83*** | 1.80*** | 1.56*** | | | (0.50) | (0.49) | (0.49) | (0.50) | | N | 70 | 70 | 70 | 70 | | Adj. R^2 | 0.77 | 0.80 | 0.79 | 0.79 | ***: Significant at 1 per cent level. **: Significant at 5 per cent level. *: Significant at 10 per cent level.
Note: 1. 9-Indicator and 15-Indicator baseline bridge equations are augmented with GSCDCI shock.
2. Figures in the parentheses denote the standard errors.
Source: RBI staff estimates. |
To assess the direction and magnitude of the pandemic shock’s influence on India’s informal sector workers, quarterly individual level Periodic Labour Force Survey (PLFS) data published by the NSO are analysed. Additionally, the Consumer Pyramids (CP) data of the Centre for Monitoring Indian Economy (CMIE) are also used. PLFS data suggest that in India, the informal sector employs more than 65 per cent of the employed population, and the informal sector’s relative employment share always outnumbers the share offormal sector12 (Chart 2). Contrary to popular opinion, the contribution of the informal sector in terms of employment was larger than the formal sector during the first wave of the pandemic. The informal sector’s share in total wage bill, however, fell through this period. During the first wave of COVID-19, the total gross value added (GVA) of the economy contracted. The total wage bill also declined with heterogenous impact on the wage share. PLFS data show that the shares of informal and formal sectors in wages usually diverge, a phenomenon that was upturned by the first wave of the pandemic (Chart 3). Thus, there was a greater contribution of the formal sector to the GVA in terms of its wage share during the first wave despite an increase in the share of the informal sector in total employment. The industries that led the fall in the informal sector wage share are wholesale and retail tradeand manufacturing.13 PLFS data are not available for post first wave of COVID-19. Therefore, after appropriately mapping the CMIE consumer pyramid (CP) data to PLFS, the series for formal sector wage share is extrapolated. This hybrid-data series indicate that the increase in the share of the formal sector in total wages during the first wave appears to be transitory, without any visible impact of the second wave. References: 1. Bhadury, S., S. Ghosh, and P. Kumar (2021), ‘Constructing a Coincident Economic Indicator for India: How Well Does It Track Gross Domestic Product?’, Asian Development Review, 38(02), Pages 237-277. 2. Ray, D. and S. Subramanian (2020), ‘India’s Lockdown: An Interim Report’, Indian Economic Review, 55(1), Pages 31-79. | Services Sector II.1.35 The services sector, which had suffered an unprecedented contraction in 2020-21, regained some lost ground in 2021-22. Despite the virulent second wave during Q1:2021-22, the recovery of the services sector was broad-based as all the sub-segments except trade, hotels, transport, communication, and services related to broadcasting surpassed their pre-pandemic levels (of 2019-20). II.1.36 The residential housing sector registered recovery in Q4:2021-22, with sales and launches improving sequentially, and inventory overhang declining to the lowest in eight quarters. The optimism in the sector was reflected in the number of units launched, the highest in 15 quarters. The construction sector benefitted from the thrust by the government on infrastructure, coupled with activity in the housing segment. The Pradhan Mantri Awas Yojana, with an allocation of ₹48,000 crore, is expected to support growth in the construction sector along with generation of mass employment in the economy. Financial, real estate and professional services surpassed their pre-pandemic levels. The performance of information technology (IT) companies has been better than hospitality and aviation segments. In the financial sector, while bank credit to commercial sector improved, aggregate deposits moderated with the ebbing of precautionary savings. Public administration, defence and other services (PADO) witnessed an impressive turnaround to register a double-digit growth of 12.5 per cent on account of strong growth in both central and state governments’ expenditure. Rail and cargo freight also saw swift recovery. II.1.37 Global supply side disruptions in semiconductor chips spilled over to the automobile sector, where declining production and increased delivery timings impacted registrations adversely (Table II.1.5). Passenger car sales registered contraction. Two-wheeler sales also declined in H2, and tractor sales were impacted by exhaustion of pent-up demand. A low base pushed up growth in air passenger traffic, even though they remained muted vis-à-vis pre-pandemic levels. Port cargo segment, which displayed resilience during the pandemic, was impacted in the third quarter by global container shortages. Indicators that remain robust despite a high base include railway freight, GST E-way bills and GST revenue. II.1.38 The Reserve Bank’s services sectorcomposite index (SSCI),14 which tracks activity in construction, trade, transport and finance and is a coincident indicator of GVA growth in the services excluding PADO, remained almost at the same level in Q4:2021-22 as in Q3, after declining for previous two consecutive quarters (Chart II.1.14). 4. Employment II.1.39 Annual PLFS data are available up to 2019-20 and the quarterly PLFS data released by the Ministry of Statistics and Programme Implementation (MoSPI) for urban areas is available till December 2021. The impact of the second wave of COVID-19 infections was relatively muted as compared to the first wave (Chart II.1.15). During the first wave (April-June 2020), the labour force participation rate (LFPR) fell to 45.9 per cent, but during the second wave (April-June 2021), the LFPR declined to 46.8 per cent. Similarly, the worker population ratio (WPR) contracted less during the second wave as compared to the first. While the unemployment rate ballooned to 20.8 per cent during first wave, they rose relatively less to 9.8 per cent during the second wave. However, the labour market recovery was not complete by December 2021, and LFPR and WPR, both remain low as compared to the pre-pandemic quarter (January-March 2020). 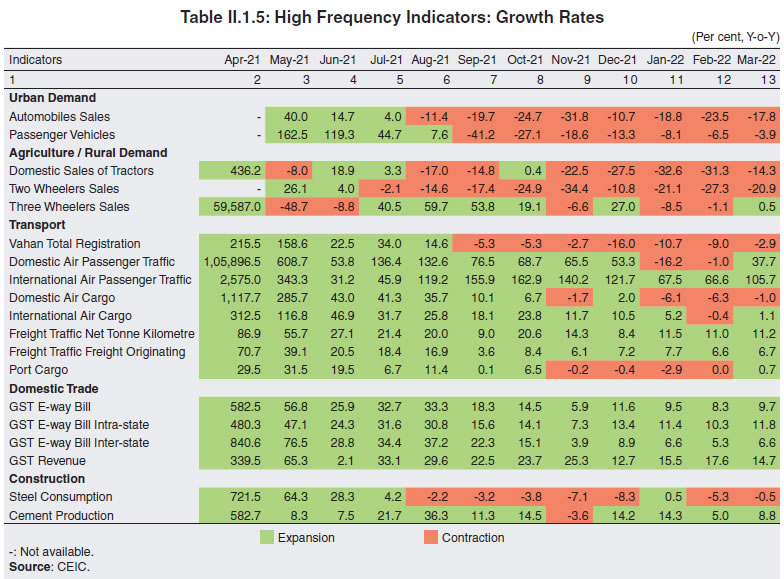
 II.1.40 Organised sector employment, measured by payroll data, presents a picture of strong recovery in job creation in 2021-22 so far. On a cumulative basis, net subscribers added to employees’ provident fund organisation (EPFO) per month increased to 10.1 lakh in April-February 2021-22 from 6.0 lakh for the same period in the previous year. On the other hand, the average number of members who paid their contribution to employees’ state insurance corporation (ESIC) improved from 1.0 lakh per month during April-February 2020-21 to 1.6 lakh per month during April-February 2021-22. New subscribers to the national pension scheme (NPS) also increased during the same period (Chart II.1.16). 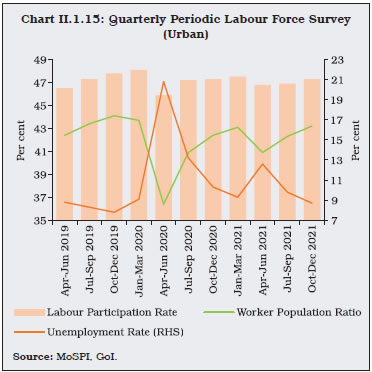 II.1.41 An assessment of the employment and unemployment situation using CMIE household survey data indicates relatively resilient labour market conditions during the second and third wave. The localised nature of restrictions and intermittent relaxations for movement ensured that there were sufficient employment opportunities available. During 2021-22, the average monthly labour force participation rate stood above 40 per cent as compared to 39.9 per cent in 2020-21. Further, the peak unemployment rate between the two waves halved from 23.5 per cent in April 2020 to 11.8 per cent in May 2021. Across both rural and urban areas, unemployment rate followed the same pattern. In terms of gender gap in the labour market, the unemployment rate for women registered a sluggish recovery. The male unemployment rate declined substantially from 11.2 per cent in May 2021, at the peak of the second wave, to 6.7 per cent in March 2022, but the decline was lower for female unemployment rate from 16.8 per cent in May 2021 to 15.6 per cent in March 2022 (Chart II.1.17). 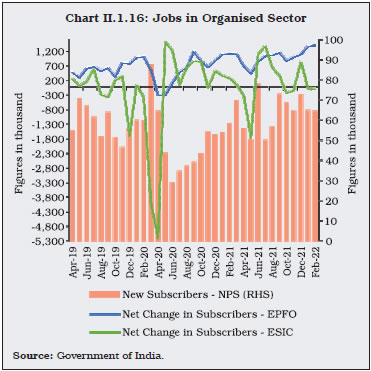 II.1.42 Other surveys covering information on employment like the employment sub-index of the overall purchasing managers’ index (PMI) registered marginal contraction in hiring in manufacturing and services sectors after the second wave of COVID-19. As compared to the first wave, the services sector during the second wave was severely affected in comparison to the manufacturing sector. During Q3:2021-22, however, the services sector employment expanded at a brisk pace. Similarly, Naukri Jobspeak index shows that private sector hiring picked up in Q4:2021-22 (Chart II.1.18).
5. Conclusion II.1.43 India’s economic recovery from the pandemic depths has been sustained in 2021-22 and the momentum is expected to broadly continue in 2022-23, though with risks to the downside from the geopolitical shock and its spillovers. Despite these risks, the recovery is getting entrenched and is broadening. The Union Budget 2022-23 envisioned the roadmap for ‘India at 100’, with a focus on demand side measures. The substantial increase in government capex outlay could crowd-in private investment and propel a virtuous cycle, thereby improving aggregate demand. Furthermore, the National Infrastructure Plan (NIP) amounting to ₹100 lakh crore and the National Monetisation Pipeline (NMP) involving ₹6 lakh crore - both targeted for completion by 2024-25, are also expected to give a major thrust to infrastructure spending. The focus on supplyside management15 through ‘process reforms’, facilitating the smoothening and simplification of processes in some sectors where government’s presence as a facilitator or regulator is necessary, would help improve the resilience of the Indian economy. Several sectors have benefitted from process reforms such as public procurement and telecommunications. Laying out a path for sustainable agricultural growth and enhanced farm income, the Union Budget 2022-23 announced several initiatives focusing on chemical free natural farming, increase in the domestic production of oilseeds and millets and promotion of agri-tech startups to enhance productivity. The Pradhan Mantri Gati Shakti Yojana laid the roadmap, driven by seven engines of roads, railways, airports, ports, mass transport, waterways, and logistics infrastructure. For the MSME sector, the ECLGS has been extended up to March 2023 with the guarantee cover expanded by ₹50,000 crore to a total cover of ₹5 lakh crore, the additional amount being earmarked exclusively for hospitality and related enterprises. II.1.44 Overall consumer and business confidence remains resilient in spite of the third wave on the back of the accelerated pace of vaccination and better prospects for economic activity. A full recovery in aggregate demand is, however, contingent on a turnaround in private investment. On the supply side, there is a resurgence in mining and manufacturing sectors. The services sector, which felt the brunt of the pandemic, is staging a broad-based recovery since Q2:2021-22. II.1.45 The future path of growth will be conditioned by addressing supply-side bottlenecks and by calibrating monetary and fiscal policy support to aggregate demand and structural reforms. Such reforms are also warranted in the labour market so as to adapt to the pandemic by reskilling workers. The pandemic also provides a unique opportunity to boost digitalisation and adopt new technologies for raising productivity growth. II.2 PRICE SITUATION II.2.1 Inflation rose sharply across advanced economies (AEs) and emerging market and developing economies (EMDEs) during 2021, reflecting pandemic related supply and logistics disruptions, a rebound in global commodity prices and a release of pent-up demand. The intensity of price pressures varied across countries, with AEs registering a sharper rise in inflation than EMDEs in spite of the latter also facing the pass-through of exchange rate depreciation into domestic inflation. II.2.2 During 2021, the World Bank energy price index was 81 per cent higher than 2020, while ‘metals and minerals’ and agriculture commodity price indices were up by 47.1 per cent and 24.2 per cent, respectively. Energy prices, which had undergone corrections during November-December 2021 as supply conditions improved, increased sharply in the first quarter of 2022 due to geopolitical conflict and subsequent economic sanctions. Brent crude prices rose by 55.6 per cent in March 2022 over December 2021 levels. Other major primary commodities have also recorded significant price increases – metals and minerals by 21 per cent and food by 23.6 per cent in March 2022 over December 2021. This broad-based increase in commodity prices has raised concerns about extreme inflation risks. The conflict has placed at risk the prospect of an early normalisation of global supply chain disruptions and has brought forward the danger of inflation expectations getting unhinged. II.2.3 In India, headline inflation16 breached the upper tolerance level of the inflation target during May-June 2021, driven by a sharp increase in inflation in all the three major groups - food, fuel and excluding food and fuel (core) - due to supply disruptions induced by the localised lockdowns (Chart II.2.1). Subsequently, while fuel inflation increased due to rising international prices, core inflation remained elevated, reflecting the pass-through of input cost pressures. By contrast, food inflation eased with the progress in kharif crop sowing until excess/unseasonal rains during October-November 2021 damaged standing crops (especially vegetables) and led to a build-up in price pressures. As a result, headline inflation which had eased close to the inflation target by September 2021 aided by favourable base effects, increased again in October 2021 and breached the upper tolerance level of 6 per cent during January-March 2022. This rise in Q4:2021-22 was led by elevated international commodity prices and supply bottlenecks on account of the Russia-Ukraine conflict along with lower winter easing in domestic food prices.  II.2.4 Average inflation, as well as volatility measured by the standard deviation of the consumer price index (CPI) inflation, was lower in 2021-22 than a year ago (Table II.2.1). The intra-year distribution of inflation was also more balanced, as reflected in a smaller negative skew. II.2.5 Against this backdrop, sub-section 2 assesses developments in global commodity prices. Sub-section 3 discusses movements in headline inflation in India including major turning points, followed by a detailed analysis of its primary constituents in sub-section 4. Other indicators of prices and costs are analysed in sub-section 5, followed by concluding observations. 2. Global Inflation Developments II.2.6 Elevation in global commodity prices was primarily led by energy prices (Chart II.2.2). Natural gas and coal prices reached record highs amid supply constraints and an increase in demand for electricity as global economic activity revived. Global crude oil prices remained volatile during the year and rose sharply in Q4:2021-22 due to the conflict in Ukraine. The decision by the organisation of petroleum exporting countries (OPEC) and their allies (OPEC+) in July 2021 to increase production only gradually by 0.4 million barrels per day on a monthly basis from August 2021 to make up for the large production cuts announced in April 2020, together with sluggish pick up in investment in new oil production, including US shale, supported prices. As a result, global crude oil prices picked up to US$ 112 per barrel in March 2022 from US$ 49 per barrel in December 2020. The demand for metals continued to increase even as production was disrupted by energy shortages and lockdowns. International food prices also remained elevated during the year and the food index (World Bank Pink Sheet) reached an all-time high (since January 1960) in March 2022, primarily driven by edible oils (palm oil; sunflower oil; rapeseed oil and soybean oil) and grain prices, due to tight supply conditions caused by adverse weather in several producing countries (South America and East Asia), Russia-Ukraine conflict and higher demand for animal feed (maize and soybean). Moreover, higher natural gas and coal prices affected fertiliser production, pushing up their prices and consequently the input costs for food crops. Reflecting these global commodity price developments, consumer price inflation rose in both AEs and EMDEs. | Table II.2.1: Headline Inflation – Key Summary Statistics | | (Per cent) | | | 2012-13 | 2013-14 | 2014-15 | 2015-16 | 2016-17 | 2017-18 | 2018-19 | 2019-20 | 2020-21 | 2021-22 | | 1 | 2 | 3 | 4 | 5 | 6 | 7 | 8 | 9 | 10 | 11 | | Mean | 10.0 | 9.4 | 5.8 | 4.9 | 4.5 | 3.6 | 3.4 | 4.8 | 6.2 | 5.5 | | Standard Deviation | 0.5 | 1.3 | 1.5 | 0.7 | 1.0 | 1.2 | 1.1 | 1.8 | 1.1 | 0.9 | | Skewness | 0.2 | -0.2 | -0.1 | -0.9 | 0.2 | -0.2 | 0.1 | 0.5 | -0.7 | -0.1 | | Kurtosis | -0.2 | -0.5 | -1.0 | -0.1 | -1.6 | -1.0 | -1.5 | -1.4 | -0.7 | -1.0 | | Median | 10.1 | 9.5 | 5.5 | 5.0 | 4.3 | 3.4 | 3.5 | 4.3 | 6.5 | 5.6 | | Maximum | 10.9 | 11.5 | 7.9 | 5.7 | 6.1 | 5.2 | 4.9 | 7.6 | 7.6 | 7.0 | | Minimum | 9.3 | 7.3 | 3.3 | 3.7 | 3.2 | 1.5 | 2.0 | 3.0 | 4.1 | 4.2 | Note: Skewness and Kurtosis are unit-free. Annual inflation is the average of the monthly inflation rates during the year and therefore, may vary from the annual inflation calculated from the average index for the year.
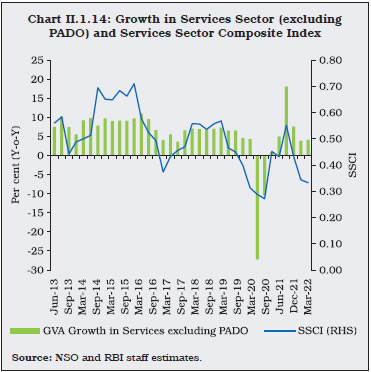
Source: NSO and RBI staff estimates. |
3. Inflation in India II.2.7 Circling back to CPI headline inflation in India, it had eased to 4.2 per cent in April 2021 (Chart II.2.3), before the second wave of COVID-19 led supply disruptions, localised lockdowns and pass-through of increase in global commodity prices (crude oil and metals) led to a sharp and broad-based pick up in headline inflation during May-June 2021. Inflation eased thereafter with moderation in food prices aided by the easing of curbs and favourable base effects. Inflation began picking up again from October 2021, breaching the upper tolerance level in Q4: 2021-22 as stated earlier. II.2.8 Inflation in food and beverages remained the primary mover of headline inflation although its contribution to headline inflation declined to 35.9 per cent in 2021-22 from 54.8 per cent a year ago. Nonetheless, supply-side measures implemented by the central government to relieve price pressures in edible oils and pulses aided in keeping food inflation under control. II.2.9 Fuel prices, on the other hand, scaled new peaks and reached an all-time high of 14.3 per cent in the current inflation series in October 2021 due to a sharp pick up in prices of liquefied petroleum gas (LPG) and kerosene, in line with international prices. Subsequently, fuel inflation eased during November 2021 - March 2022 mainly due to the reduction in electricity prices announced by some states and favourable base effects. II.2.10 Inflation excluding food and fuel or core inflation remained elevated throughout the year reflecting input cost pressures amid global supply disruptions and some recovery in domestic demand. The main contributors were prices of transport and communication; health; household goods and services; and clothing and footwear. The excise duty cut in petrol and diesel prices in early November 2021 led to some easing of transport and communication inflation. II.2.11 For the year, inflation eased to an average of 5.5 per cent in 2021-22, 66 basis points (bps) lower than a year ago (Appendix Table 4). Notwithstanding the easing in headline inflation, households’ median inflation expectations hardened during 2021-22 by 59 bps three months ahead and by 62 bps a year ahead reflecting the uncertainty surrounding the path of the pandemic and sporadic supply shocks. 4. Constituents of CPI Inflation II.2.12 During 2021-22, the drivers of CPI headline inflation showed notable changes wherein food and beverages; fuel and light; transport and communication; health; and clothing and footwear remained the major drivers (Chart II.2.4). Food II.2.13 Inflation in prices of food and beverages (weight: 45.9 per cent in CPI) moved within a wide range of 1.6 per cent to 7.5 per cent during 2021-22 largely reflecting the movements in vegetables and oils and fats inflation (Chart II.2.5).
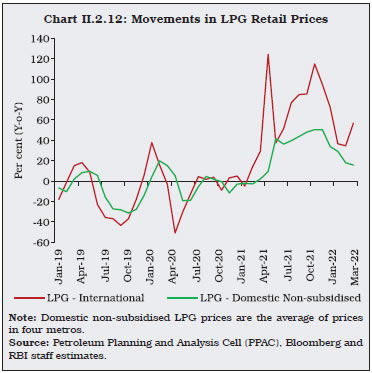
II.2.14 Food inflation averaged 4.2 per cent in 2021-22, compared to 7.3 per cent in 2020-21. Eight out of the 12 sub-groups witnessed a moderation in inflation (Chart II.2.6). Vegetable prices (weight: 13.2 per cent in CPI-Food and beverages) remained in deflation during a major part of the year, recording an average deflation of (-) 7.2 per cent on favourable base effects and exerted downward pressure on overall food inflation during the year. II.2.15 Food inflation, excluding vegetables would have averaged 204 bps higher (Chart II.2.7a). While higher production generally led to lower price build-up, excess/unseasonal rains pushed up vegetable prices during October-November 2021, as also observed in the past (Chart II.2.7b). II.2.16 Onion prices increased during the months of June-July 2021 reflecting summer uptick and damage to stored rabi onions in Maharashtra and Gujarat due to cyclone Tauktae and again during October-November 2021 as heavy rains damaged kharif crops in major producing states. Government intervened by releasing stored onions from a total buffer stock of 2 lakh metric tonnes under the price stabilisation fund (PSF) scheme. Support came from fresh arrivals, which eased price pressures during December 2021- March 2022, barring a temporary rise in February 2022. In the case of tomatoes, price pick-up was observed during October-November 2021 owing to erratic rains in some major producing states in north India in September 2021 followed by heavy rains in major producing states in south India in October 2021, which resulted in supply disruption and crop damages. Potato prices were in deflation throughout 2021-22 (barring February-March 2022) on higher production [15.7 per cent in 2020-21 final estimates (FE) over 2019-20 FE] in response to attractive prices in the previous year. However, prices firmed up during October-November 2021 due to unseasonal rains and delays in the arrivals of fresh crops. Lower production in 2021-22 [estimated to be (-) 4.6 per cent in 2021-22 1st advanced estimates (AE) over 2020-21 FE] led to the re-emergence of price pressures in March 2022. 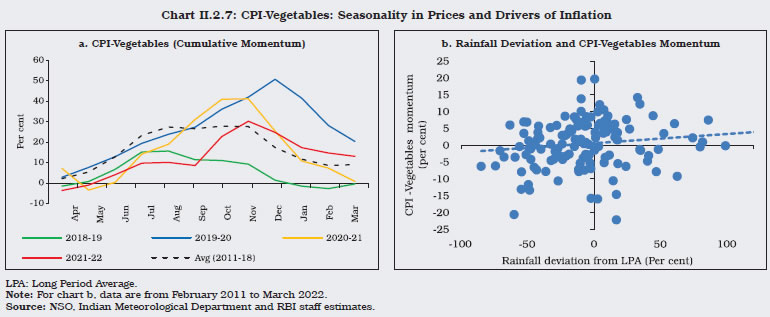 II.2.17 Prices of cereals and products (weight of 21 per cent in the CPI-Food and beverages) recorded deflation during the first half of the year, before registering some price pressures during October 2021-March 2022. Higher procurement, offtake under Pradhan Mantri Garib Kalyan Anna Yojana (PMGKAY), record production of rice (4.3 per cent as per 2021-22 3rd AE over 2020-21 FE) kept prices soft during the first half of the year. However, price pressures emerged in wheat during the second half due to higher exports (236 per cent year-on-year during 2021-22). II.2.18 In the case of protein-rich items such as eggs, meat and fish (weight of 8.8 per cent in CPI-Food and beverages), price pressures were seen during April-July 2021 reflecting supply disruptions and input cost pressures from an increase in feed and transportation costs (Chart II.2.8). Prices eased during August 2021-January 2022 in line with the gradual normalisation of supply chains and import of 12 lakh tonnes of genetically modified soya meal. However, price pressures re-emerged during February-March 2022 reflecting a further increase in feed costs. In the case of milk and products prices remained subdued, barring the increase seen in July 2021 and March 2022, due to upward revision in retail prices by ₹2 per litre by major milk co-operatives like Amul and Mother Dairy, followed by some state milk co-operatives.  II.2.19 Oils and fats (weight of 7.8 per cent in CPI-Food and beverages) recorded historically high inflation of 34.8 per cent in June 2021 on the back of rising international prices, especially of palm oil (Chart II.2.9). In order to contain price pressures, a number of measures were undertaken by the government - imposing stock limits on edible oils and oilseeds for a period up to September 31, 2022 and successive reduction in import duties on palm oil (bringing down the duty on refined and crude palm oil to 12.5 per cent and 5 per cent, respectively, by February 2022 from 37.5 per cent and 32.5 per cent, respectively, in June 2021), soybean oil and sunflower oil. Responding to these measures and following sharp increase in rabi oilseeds sowing, edible oil prices recorded a correction during November 2021-January 2022. However, the conflict in Ukraine (which is a major global supplier of sunflower oil) led to the return of price pressures during February-March 2022. 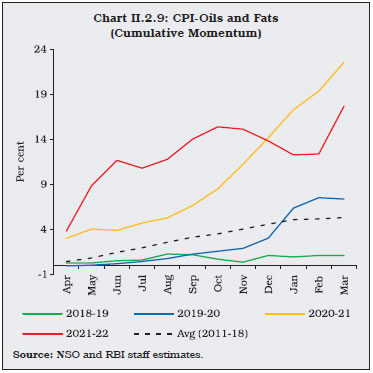 II.2.20 Inflation in prices of pulses (weight of 5.2 per cent in CPI-Food and beverages) followed a declining path after the May-June 2021 rise on account of a host of supply side measures undertaken by the government (Chart II.2.10). The supply measures include moving imports of tur, urad and moong from restricted to ‘free category’ from May 15, 2021 till October 31, 2021; imposing stock limit on all pulses except moong until October 31, 2021; completely abolishing import duty on masur and reducing Agriculture Infrastructure and Development Cess (AIDC) to 10 per cent from July 27, 2021; releasing masur from buffer stocks at discounted prices; and extending free import policy of urad and tur to March 31, 2023. These measures led to cooling down of inflation to 2.6 per cent by March 2022 from an intra-year peak of 10 per cent in June 2021. 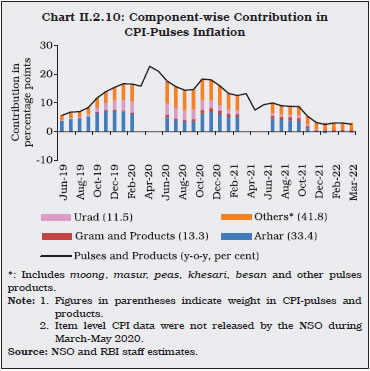 II.2.21 Inflation in fruits (weight of 6.3 per cent in CPI-Food and beverages) picked up to a 3-year high of 11.8 per cent in May/June 2021. Subsequently, however, price pressures ebbed owing to higher production of apples and grapes. Fuel II.2.22 The contribution of the fuel group (weight of 6.8 per cent in CPI) to headline inflation increased to 13.1 per cent in 2021-22 from 2.9 per cent in the previous year. Fuel inflation picked up sharply to 14.3 per cent in October 2021, largely due to the hardening of domestic LPG and kerosene prices which tracked international price movements (Chart II.2.11 and Chart II.2.12). Subsequently, inflation witnessed some moderation and reached 7.5 per cent in March 2022 mainly due to the easing of electricity prices and favourable base effects. Inflation Excluding Food and Fuel II.2.23 Inflation excluding the volatile food and fuel items, i.e., core inflation, picked up to an average of 6.0 per cent in 2021-22, with an intra-year peak of 6.6 per cent at the height of the second wave of COVID-19 in May 2021 (Chart II.2.13) [Appendix Table 4]. Subsequently, inflation eased somewhat in line with the gradual removal of lockdown restrictions before crossing 6 per cent again during November 2021-March 2022 (barring February 2022) despite the cut in excise duty on petrol and diesel (₹5 per litre and ₹10 per litre, respectively) in early November 2021, followed by a reduction in value added tax (VAT) by most of the state governments. 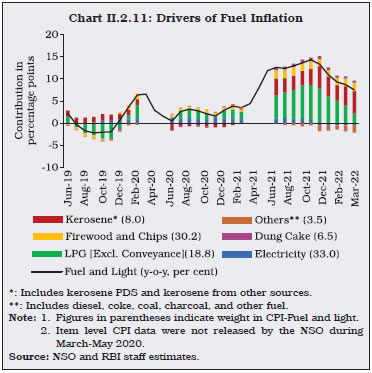
 II.2.24 Among the major constituents, double-digit inflation in transport and communication reflected an increase in domestic prices of petrol and diesel in line with international prices (Chart II.2.14). Inflation in the health sub-group rose on account of the increase in medicine prices and hospital and nursing charges due to higher raw material costs, supply bottlenecks and pandemic-induced demand. Within transport and communication, prices of personal transport vehicles also increased reflecting a gradual pass-through of higher input costs (especially metals and microchips) by major automobile manufacturers. Private telecom operators increased mobile tariff charges for various plans in July 2021 (around 40 per cent for base categories) and November 2021 (20-25 per cent). As a result of pass-through of input costs to retail prices, a larger number of items within core goods registered greater than 4 per cent inflation rates during 2021-22 (Chart II.2.15). 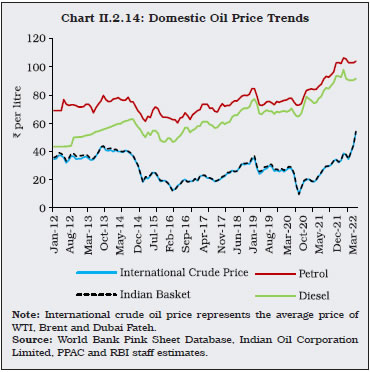 II.2.25 Housing inflation remained moderate at 3.7 per cent in 2021-22 (3.3 per cent in 2020-21), reflecting subdued rental demand on account of hybrid work culture amid the multiple waves of COVID-19. Net of housing, inflation excluding food and fuel averaged 6.6 per cent in 2021-22, up from 6.2 per cent a year ago. II.2.26 Inflation in clothing and footwear picked up significantly and remained a major pressure point, averaging 7.2 per cent in 2021-22. It increased consistently from 3.5 per cent in April 2021 to 9.4 per cent in March 2022, largely reflecting input cost pressures emanating from rising international prices of cotton (as measured by the Cotton A Index) due to lower global and domestic production as well as improved global demand. 5. Other Indicators of Inflation II.2.27 From a sectoral perspective, inflation based on the CPI for industrial workers (CPI-IW) remained slightly elevated at 5.1 per cent during 2021-22, although it eased to 4.4 per cent in September 2021 before picking up to 5.8 per cent in January 2022, largely due to the increase in food prices. On the other hand, inflation based on the CPI for agricultural labourers (CPI-AL) and rural labourers (CPI-RL) eased to 4.0 per cent and 4.2 per cent, respectively, in 2021-22 from 5.5 per cent in the previous year due to favourable base effects and subdued food inflation, although both crossed 6 per cent level in March 2022. II.2.28 Inflation measured by the wholesale price index (WPI) rose sharply from 1.3 per cent in 2020-21 to 13.0 per cent in 2021-22, with an intra-year peak of 14.9 per cent in November 2021 (the highest level in the current series). WPI Inflation picked up from February 2021 and remained in double-digits during the year, reflecting a sharp pick up in prices across all major groups. Within primary articles, inflation in non-food articles (21.2 per cent), minerals (19.4 per cent) and crude petroleum and natural gas (56.5 per cent) remained in double-digits, reflecting higher international commodity prices amid rising domestic demand. Inflation in fuel and power also jumped to an average of 32.8 per cent, driven mainly by a sharp increase in mineral oil prices. With the broad-based increase in input costs, manufactured product inflation also reached double-digits since May 2021 (Box II.2.1). Reflecting the sharp rise in WPI inflation and elevated CPI inflation, the gross domestic product (GDP) deflator inflation also hardened to 9.6 per cent in 2021-22 as per 2nd AE 2021-22 from 5.6 per cent in 2020-21. Box II.2.1
Sensitivity of Inflation in India to Input Cost Pressures In order to understand the responsiveness of CPI inflation to the input cost pressures in India, two approaches have been followed: (a) pass-through of global commodity prices directly to the CPI, and (ii) indirectly via the WPI. Monthly data for the period 1992 to 2021 are employed in an ordinary least squares (OLS) framework using a polynomial distributed lag (PDL) model (Batten and Thornton, 1983) [equations17 (1) and (2)]: The results suggest that the direct pass-through of global commodity prices to CPI is lower than via the WPI, with a longer transmission lag in the case of non-food non-fuel (or core). The impact is also persistent in the case of core inflation (Chart 1). A one per cent change in overall (non-food non-fuel) global commodity prices leads to a 0.02 (0.04) per cent change in overall (non-food non-fuel) CPI inflation, and around a 0.11 (0.09) per cent change in overall (non-food non-fuel) WPI inflation. On the other hand, a one per cent change in the overall (non-food non-fuel) WPI leads to around 0.26 (0.33) per cent change in the overall (non-food non-fuel) CPI inflation. Indirect estimates corroborate direct estimates, i.e., a one per cent change in overall (non-food non-fuel) global commodity prices leads to around 0.03 per cent change in overall (non-food non-fuel) CPI inflation. To sum up, the hardening of global commodity prices has a relatively moderate impact on CPI inflation relative to WPI inflation, but the impact on CPI core is more persistent. Reference: Batten, Dallas S., and Daniel L. Thornton (1983), ‘Polynomial Distributed Lags and the Estimation of the St. Louis Equation’, Federal Reserve Bank of St. Louis, Vol.65 (Apr.), Pages 13-25. | II.2.29 There was a moderate hike in minimum support prices (MSPs) for kharif and rabi crops in 2021-22. The extent of MSP increases varied across crops, ranging from 1.1 per cent in the case of moong and maize to 8.6 per cent for rapeseed/mustard. MSPs for rice and wheat were increased by 3.9 per cent and 2.0 per cent, respectively. II.2.30 Wage growth for agricultural and non-agricultural labourers remained muted during the year, averaging 4.4 per cent and 3.6 per cent, respectively, during May 2021-February 2022, on account of subdued demand conditions coexisting with lower rural inflation. However, agricultural wage growth picked up to 6.0 per cent in February 2022 from a low of 1.1 per cent in June 2021, while non-agricultural wage growth increased to 6.1 per cent in February 2022 from 0.2 per cent in May 2021, partly reflecting unfavourable base effects. 6. Conclusion II.2.31 In sum, headline inflation remains above the target of 4 per cent, having tested the upper tolerance level during the second wave in May-June 2021 and the third wave along with the Russia-Ukraine conflict in January-March 2022. The flare-up in vegetable prices due to heavy rains in October and November 2021 started to reverse with winter crop arrivals in December 2021 but the extent of winter easing was shallower than normal. The supply side interventions by the government continue to restrain the pass-through of elevated international edible oil prices to domestic retail inflation. Cost-push pressures from high industrial raw material prices, transportation costs, and global logistics and supply chain bottlenecks continue to impinge on core inflation. The substantial wedge between wholesale and retail price inflation amidst a sharp rise in manufactured products’ inflation poses risk of a possible pass-through of input cost pressures to retail inflation with a lag, although slack in the economy is muting the pass-through. The conflict over Ukraine and the consequent spike in commodity prices has overcast the outlook for inflation in India as in the rest of the world. II.3 MONEY AND CREDIT II.3.1 Monetary and credit conditions during the year evolved in sync with the Reserve Bank’s accommodative policy stance. Overall financial conditions remained benign although there has been some tightening in the recent period largely due to global spillovers. Reserve money (RM), adjusted for the first-round effects of the increasein the cash reserve ratio (CRR)18, moderated. Precautionary demand for currency, which had surged in 2020-21 due to the COVID-19-induced uncertainties, softened during the year. Concomitantly, there was a marginal uptick in the velocity of money, possibly reflecting improvement in consumer demand conditions in the economy. Money supply (M3) growth decelerated during the year, mirroring the behaviour of its largest component - aggregate deposits. On the other hand, bank credit growth picked up, especially since August 2021, and it was broad-based. II.3.2 Against this backdrop, sub-section 2 delves into the dynamics underlying movements in RM and, thereby, the shifts in the Reserve Bank’s balance sheet. Sub-section 3 examines developments in money supply in terms of its components and sources, throwing light on the movements in assets and liabilities of the banking sector. The underpinnings of bank credit are covered in sub-section 4, followed by concluding observations. 2. Reserve Money19 II.3.3 Reserve money - which is essentially an analytical and stylised depiction of the Reserve Bank’s balance sheet that focuses on its monetary liabilities, comprising currency in circulation, bankers’ deposits, and other deposits with the Reserve Bank - increased by 12.3 per cent in 2021-22, lower than 14.2 per cent a year ago but higher than its decennial average of 10.6 per cent (2012-21) [Chart II.3.1; Appendix Table 4]. Adjusted for the increase in CRR in phases by 100 basis points (bps) since March 27, 2021, RM grew by 7.3 per cent in 2021-22, as against 18.0 per cent a year ago. II.3.4 Among its components, currency in circulation (CiC) constituted around 80 per cent of RM in 2021-22. Although the contribution of currency in determining the overall expansion inRM peaked in June 202120, CiC accounted for 88 per cent of the overall expansion in RM during the year (89 per cent a year ago), which is below the decennial average of 108 per cent (2012-21). II.3.5 The demand for CiC normally follows a predictable intra-month pattern - expansion during the first fortnight due to transactions by households, followed by a contraction in the second fortnight due to flow back of currency from households to the banking system (Chart II.3.2).
II.3.6 There was an unusual rise in month-over-month (M-o-M) CiC variation in April-May 2021 due to the second wave of COVID-19, albeit to a lesser extent as compared with the first wave in April-June 2020, but higher than the corresponding period of pre-pandemic years (Chart II.3.3). With the epidemiological curve bending downwards from June 2021, the variations in CiC were mostly determined by seasonal factors (Chart II.3.4). II.3.7 Barring the sharp surge during April-May 2021 due to the second wave of the pandemic, currency demand reverted to its usual seasonal pattern in 2021-22. The typical seasonal spurt in Q1:2021-22, associated with rabi procurement and kharif sowing, was significantly lower than Q1:2020-21, and was comparable with pre-pandemic years. In the following quarter, CiC contracted due to the seasonal slack in economic activity in cash-intensive sectors such as construction and agriculture. In Q3:2021-22, CiC expanded, reflecting increase in demand for currency for festivals and kharif harvest. Further expansion in CiC was evident in Q4:2021-22 due to the harvest of rabi crops, various festivals, and run up to the legislative assembly elections in five states (Chart II.3.5). Lower CiC growth at 9.7 per cent in 2021-22 (17.2 per cent a year ago) resulted in a decline in the currency-GDP ratio to 13.7 per cent (14.4 per cent in 2020-21) as cash-intensity in the economy started normalising with reduction in the intensity of the pandemic (Chart II.3.6). 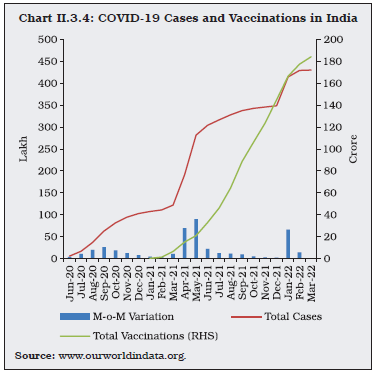
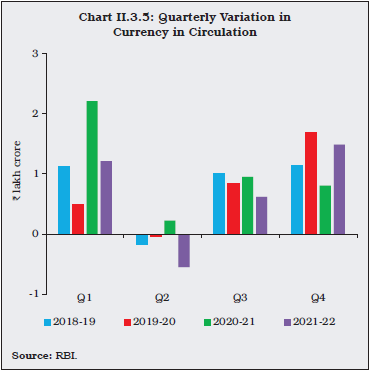
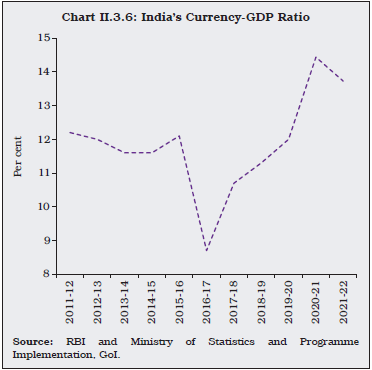 II.3.8 Bankers’ deposits with the Reserve Bank increased by 25.3 per cent in 2021-22 as against a marginal expansion of 0.8 per cent in the previous year, primarily due to increase in CRR in phases by 100 bps to 4.0 per cent (Chart II.3.7). II.3.9 Amongst the sources of RM, during 2021-22, the main driver for RM growth was net foreign assets (NFA), even though net purchases from authorised dealers at ₹2.07 lakh crore were lower than ₹5.16 lakh crore of the previous year (Chart II.3.8a and II.3.8b). Consistent with the accommodative stance of monetary policy, liquidity management operations boosted net domestic assets (NDA) of the Reserve Bank. II.3.10 In particular, net open market purchases (including auctions of special OMOs involving simultaneous purchase and sale of securities for liquidity distribution across the yield curve and OMOs in state development loans) of ₹2.14 lakh crore reflected in an increase in the net Reserve Bank credit to the government by ₹1.95 lakh crore in 2021-22. On the other hand, contraction in the Reserve Bank’s net credit to banks and the commercial sector (mainly PDs), primarily reflected in net liquidity adjustment facility (LAF) absorption (Chart II.3.9).
II.3.11 The net LAF position remained in reverse repo mode throughout 2021-22, averaging ₹6.7 lakh crore, indicating ample system level liquidity (Chart II.3.10). 3. Money Supply21 II.3.12 Stabilising from a prolonged decline till 2016-17, M3 comprising currency with the public (CwP), aggregate deposits (AD) and other deposits with the Reserve Bank, recorded a growth of 8.7 per cent in 2021-22 (12.3 per cent a year ago) driven by time deposits (Chart II.3.11). II.3.13 On the components side, M3 expansion was driven by AD, its largest constituent (85 per cent share). In fact, AD accounted for 82 per cent of the increase in M3 during the year, with time deposits growing at 8.1 per cent (10.9 per cent a year ago) in spite of considerable moderation in interest rates (Chart II.3.12). As usual, demand deposits remained volatile, largely mirroring the variations in currency with the public which grew by 10.2 per cent in 2021-22 vis-à-vis 17.7 per cent in the previous year (Chart II.3.13).
II.3.14 On the sources side, bank credit to the commercial sector, followed by net bank credit to the government and net foreign exchange assets of the banking sector led the expansion in M3 in 2021-22 (Chart II.3.14). Amongst these sources, bank credit to the commercial sector - the largest constituent of M3 from the sources side - grew at a rate higher than a year ago. 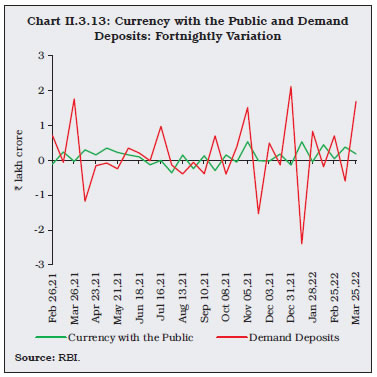
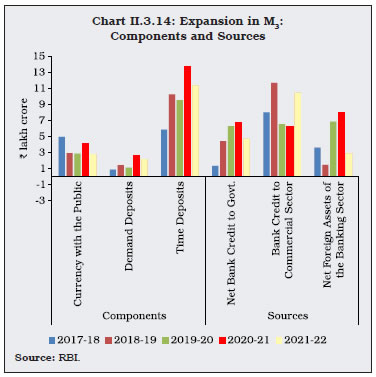
| Table II.3.1: Monetary Aggregates | | Item | Outstanding as on March 25, 2022 (₹ crore) | Year-on-Year Growth Rate (Per cent) | | 2019-20 | 2020-21 | 2021-22 | | 1 | 2 | 3 | 4 | 5 | | I. Reserve Money (RM) | 39,20,298 | 9.8 | 14.2 | 12.3 | | II. Money Supply (M3) | 2,04,89,597 | 8.7 | 12.3 | 8.7 | | III. Major Components of M3 | | | | | | III.1. Currency with the Public | 30,37,622 | 14.0 | 17.7 | 10.2 | | III.2. Aggregate Deposits | 1,73,99,596 | 8.0 | 11.3 | 8.4 | | IV. Major Sources of M3 | | | | | | IV.1. Net Bank Credit to Government | 62,04,211 | 14.2 | 13.2 | 8.2 | | IV.2. Bank Credit to Commercial Sector | 1,26,10,042 | 6.3 | 5.7 | 9.0 | | IV.3. Net Foreign Assets of the Banking Sector | 48,50,355 | 22.4 | 21.4 | 6.3 | | V. M3 Net of FCNR(B) | 2,03,60,720 | 8.7 | 12.6 | 8.9 | | VI. Money Multiplier* | 5.2 | 5.0 | 4.8 | 3.8 | *: In columns 3, 4 and 5, data indicate incremental money multiplier.
Note: Data are provisional.
Source: RBI. | II.3.15 On the other hand, net bank credit to government decelerated to 8.2 per cent in 2021-22 as compared with 13.2 per cent a year ago, reflecting active usage of funds for credit creation, unlike a year ago when banks augmented their SLR portfolios in search of safe haven amidst COVID-19 induced uncertainties (Table II.3.1). Key Monetary Ratios II.3.16 The money multiplier stood at 5.2 in 2021-22, below its decennial average of 5.7 (2012-21). Adjusted for reverse repo - analytically more meaningful and akin to banks’ deposits with the central bank - the money multiplier turned out to be lower at 4.5. A weak money multiplier along with the deceleration in RM growth (adjusted for the first-round effects of CRR increase) explain the slower growth in M3 in 2021-22 vis-à-vis last year (Chart II.3.15 and Chart II.3.16). II.3.17 The currency-deposit ratio stood at 17.5 per cent in 2021-22, above its decennial average (2012-21) of 15.3 per cent. It is at a similar level vis-à-vis end-March 2021, indicating that the public’s preference towards cash, the most liquid asset, in response to the uncertainties relating to the pandemic, did not increase significantly during the year. The reserve-deposit ratio at 4.2 per cent (3.6 per cent a year ago), reflected the impact of CRR increase during 2021-22 (Chart II.3.17).
4. Credit II.3.18 With the current policy prescription of 4.5 per cent and 18 per cent for CRR and SLR, respectively, around 78 per cent of the deposits are available with the banking system for extending credit. In 2021-22, scheduled commercial banks’ (SCBs) credit-deposit ratio stood at 72.2 per cent, a level comparable with end-March 2021 (72.4 per cent), as credit expansion broadly maintained pace with deposit mobilisation after lagging behind during 2019-20 and 2020-21 (Chart II.3.18 and Chart II.3.19). 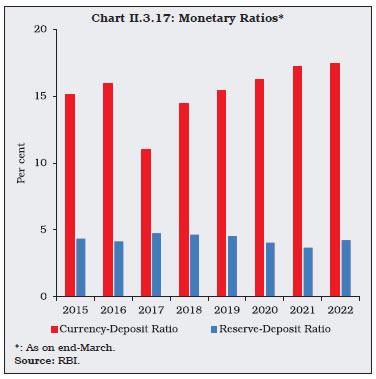

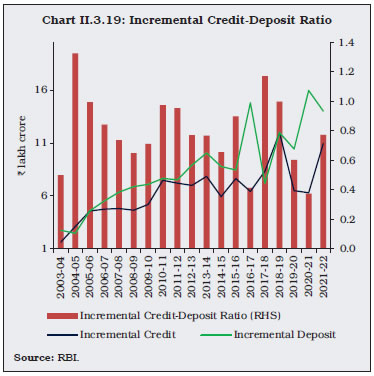
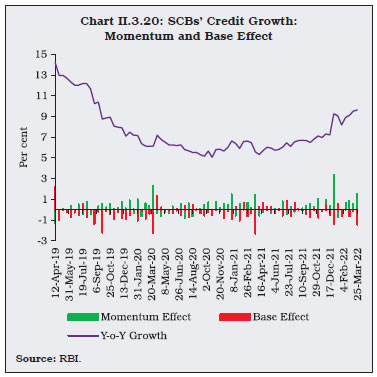 II.3.19 In 2021-22, the y-o-y growth in SCBs’ credit recouped lost pace. As per the Section 42 returns data submitted by banks under the Reserve Bank of India Act, the momentum in SCBs’ credit offtake has been mostly positive since end-August 2021 and its growth stood at 9.6 per cent on a year-on-year basis for 2021-22 as compared with 5.6 per cent a year ago (Chart II.3.20). The credit-to-GDP gap, however, continues to be large, reflecting the persisting slack in credit demand in the economy (Chart II.3.21). II.3.20 After remaining subdued in the beginning of the financial year 2021-22, a turnaround in credit growth was recorded across major sectors in Q4:2021-22. The Reserve Bank’s continuous efforts to maintain adequate liquidity in the banking system, coupled with the government’s efforts to boost credit demand conditions in the economy was reflected in the pickup in credit offtake by various sectors. According to data on the sectoral deployment of bank credit22, credit to agriculture and allied activities grew by 9.9 per cent in March 2022 vis-à-vis 10.5 per cent in March 2021. Bank credit growth remained robust for the resilient agriculture sector even during the COVID-19 pandemic period, with continued support of the government’s interest subvention scheme. Industrial credit growth improved steadily after Q1:2021-22 and accelerated to 7.1 per cent in March 2022. Medium industries, in particular, registered a growth of 71.4 per cent in March 2022, as compared with 34.5 per cent a year ago. Credit to micro and small industries also posted a faster growth of 21.5 per cent in March 2022 from 3.9 per cent a year ago. The growth recorded in the MSME sector’s credit demand is largely attributable to the government’s impetus and the Reserve Bank’s policies to revive the sector. Credit growth to large industry, which was mainly in contraction zone till December 2021, turned positive in January 2022 and stood at 0.9 per cent in March 2022 (Chart II.3.22a and Table II.3.2). 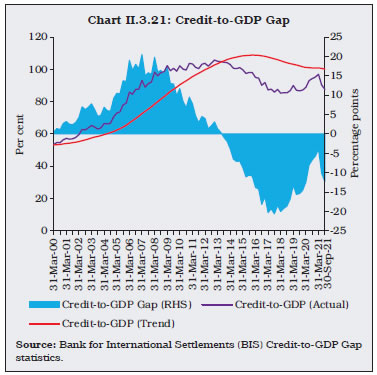
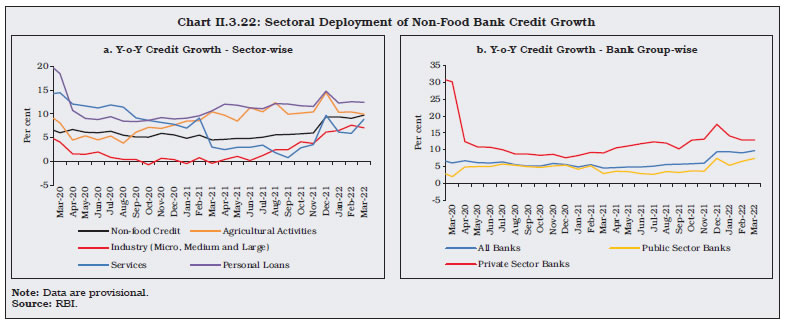 II.3.21 Among the industry sub sectors, credit to engineering, beverage and tobacco, chemicals and chemical products, construction, food processing, infrastructure, leather and leather products, mining and quarrying, petroleum, coal products and nuclear fuels, textiles, rubber plastic and their products, and vehicles, vehicle parts and transport equipment recorded accelerated growth in March 2022 on a year-on-year basis. However, credit growth to gems and jewellery, paper and paper products and wood and wood products decelerated. Bank credit to basic metal and metal products, cement and cement products, and glass and glassware recorded contraction during the same period. | Table II.3.2: Credit Deployment to Select Sectors | | Sectors | Outstanding as on March 25, 2022 (₹ crore) | Year-on-Year Growth (Per cent) | | 2019-20* | 2020-21# | 2021-22## | | 1 | 2 | 3 | 4 | 5 | | Non-food Credit | 1,18,35,628 | 6.1 | 4.5 | 9.7 | | 1. Agriculture & Allied Activities | 14,66,514 | 8.1 | 10.5 | 9.9 | | 2. Industry (Micro & Small, Medium and Large) | 31,71,909 | 4.1 | -0.4 | 7.1 | | 2.1. Micro & Small | 4,95,281 | 4.5 | 3.9 | 21.5 | | 2.2. Medium | 2,42,269 | 3.4 | 34.5 | 71.4 | | 2.3. Large | 24,34,359 | 4.1 | -2.5 | 0.9 | | (i) Infrastructure | 12,02,694 | 2.7 | 1.6 | 9.3 | | (a) Power | 6,09,773 | 0.3 | -0.3 | 7.2 | | (b) Telecommunications | 1,37,381 | 29.4 | -21.3 | 18.6 | | (c) Roads | 2,70,806 | 3.6 | 27.6 | 17.0 | | (ii) Chemicals & Chemical Products | 2,14,141 | 10.2 | -6.8 | 8.7 | | (iii) Basic Metals & Metal Products | 2,96,427 | -6.3 | -6.4 | -9.2 | | (iv) Food Processing | 1,73,530 | -1.3 | 8.2 | 10.9 | | (v) Textiles | 2,25,096 | -3.6 | 5.0 | 10.1 | | 3. Services | 30,36,122 | 14.4 | 3.0 | 8.9 | | 4. Personal Loans | 33,74,876 | 18.4 | 10.7 | 12.4 | *: March 2020 over March 2019. #: March 2021 over March 2020. ##: March 2022 over March 2021.
Note: Data are provisional.
Source: RBI. | II.3.22 Credit growth to infrastructure, a major constituent of the industrial sector, improved during 2021-22. The sector recorded a credit growth of 9.3 per cent in March 2022 as compared to 1.6 per cent a year ago. The credit growth to the sector was mainly driven by roads, power and telecommunications. II.3.23 Services sector credit growth picked up in Q4:2021-22 and recorded an accelerated growth of 8.9 per cent in March 2022 vis-à-vis 3 per cent growth registered a year ago. The spurt in credit growth was mainly on account of a credit pick up in sub-sectors like NBFCs and trade, which together constitute around 58 per cent of the total services sector credit. The bank credit growth in personal loans segment remained in double digits during 2021-22, primarily driven by housing, the largest constituent of the sector, followed by vehicle loans. II.3.24 Among bank groups, public sector banks’ credit growth remained sub 4 per cent till November 2021 before improving to 7.4 per cent in March 2022 (2.9 per cent a year ago), driven by personal loans. Credit extended by private sector banks registered an improved growth of 12.9 per cent in March 2022 as compared with 9 per cent a year ago (Chart II.3.22b). 5. Conclusion II.3.25 To sum up, key monetary and credit aggregates moved in line with the Reserve Bank’s accommodative policy stance during the year. Overall financial conditions remained supportive of the recovery, despite the volatile global environment and diverging monetary policy stances, geopolitical tensions and persistent supply bottlenecks. Precautionary currency demand is ebbing and the usual seasonal pattern in CiC, comparable to pre-pandemic years, has re-emerged. In tandem with economic activity, credit growth has accelerated. Going forward, the broad-based rebound in domestic economic activity is likely to sustain credit demand. Several measures undertaken by the government such as the PLI scheme and the extended ECLGS support had a salutary effect on credit growth and are expected to limit the impact of risks facing the borrowers from global spillovers and the uncertainty about the recurrence of COVID-19 waves. II.4 FINANCIAL MARKETS II.4.1 Global financial markets which generally remained buoyant during the greater part of 2021, turned volatile in Q1:2022 in the anticipation of start of the withdrawal of monetary policy accommodation by many central banks. Abrupt and large shifts in risk sentiment caused volatility to spike and repricing of assets roiled financial markets with the escalation of the Ukraine-Russia conflict. II.4.2 Earlier during the year, abundance of liquidity and accommodative monetary policies in major economies had pushed financial asset prices to all-time highs, bolstered also by stimulus packages and easing of COVID-19 restrictions, with occasional bouts of turbulence dispelling the calm as monetary policy stances diverged and intent to normalise triggered illiquidity fears, alongside rising cases of the Omicron variant. Surges in energy prices and the persisting disruptions to international supply chains kept market sentiment unsettled. Equity markets in emerging market economies (EMEs) experienced spillovers and occasional flights to safety as well as risk-on bounce backs. The US dollar strengthened on safe haven demand. Global bond yields also hardened in response to these developments. Commodity prices, including oil, rose sharply with crude oil prices touching their highest levels in the past fourteen years in March 2022 as geopolitical tensions collided with these visitations of turbulence and overwhelmed market sentiment. II.4.3 In India, financial markets remained vibrant amidst easy liquidity conditions, although the severe second wave of the pandemic during April-May 2021 dampened sentiments. The equity market continued to register double-digit growth in 2021-22 in sync with global peers with optimism on large scale vaccine rollouts and resurgence in economic activity. Sustained support from monetary and fiscal measures cushioned domestic equities and initial public offerings (IPOs) and follow-on public offers (FPOs) recharged investor ebullience while containing movements in bond yields. In H1:2021-22, substantial resources were raised from the market in a non-disruptive manner, helped by strong corporate earnings. Investors turned cautious in H2:2021-22 following the announcements of policy normalisation in advanced economies (AEs) and rapid spread of Omicron. In 2021-22, the Sensex increased by 18.3 per cent, outperforming global peers. The Reserve Bank proactively managed liquidity conditions during the year with various liquidity measures. Expectation of faster normalisation of monetary policy by global central banks amid inflationary concerns along with upside movement in the US treasury yields and crude oil prices led to upward pressure on domestic 10-year G-sec yields. The strengthening of the US dollar and net foreign portfolio investment (FPI) outflows contributed to weakening of the Indian rupee during the year. II.4.4 Money market developments are detailed in sub-section 2. G-sec yields are discussed in sub-section 3. Sub-section 4 presents developments in the corporate bond market. Sub-section 5 profiles developments in the domestic equity market, followed by a discussion on movements in the Indian rupee in the foreign exchange market in sub-section 6. The last sub-section offers concluding observations along with some forward-looking perspectives. 2. Money Market II.4.5 Notwithstanding the ravages unleashed by the virulent second wave of the pandemic in April-May 2021, the money market remained stable during the year 2021-22, as the Reserve Bank maintained ample liquidity23 in the system. II.4.6 The weighted average call rate (WACR) in the unsecured call money market – the operating target of monetary policy – generally traded below the floor of the policy corridor, i.e., the fixed rate reverse repo, during the year reflecting abundant liquidity in the system (Chart II.4.1). The average spread of the WACR over the policy rate widened to (-) 75 basis points (bps) in 2021-22 from (-) 63 bps in 2020-21. II.4.7 Volatility in the call money segment, measured by the coefficient of variation24 of the WACR, decreased significantly to 4.05 from 8.34 in 2020-21 on account of the proactive liquidity measures taken by the Reserve Bank. II.4.8 The average daily volume in the money market (call money, triparty repo and market repo taken together, excluding Saturdays) increased by 35 per cent to ₹4,55,224 crore during 2021-22 from ₹3,36,371 crore in 2020-21. Volumes in the triparty repo and market repo segments also increased and accounted for 74 per cent and 24 per cent, respectively, of the total money market volume (call/triparty repo and market repo) as compared with 69 per cent and 28 per cent, respectively, in 2020-21. In the call money segment, average daily volumes decreased by 18 per cent to ₹9,060 crore during the year from ₹10,993 crore in 2020-21, reducing market share to 2 per cent from 3 per cent in the previous year (Chart II.4.2). II.4.9 Interest rates on long term money market instruments, viz., 91-day Treasury Bills (T-bills), certificates of deposit (CDs) and commercial papers (CPs) generally moved in sync with the short term (call, triparty repo and market repo) rates during the year under review. The average daily spread of CD rates over T-bill rates narrowed to 9 bps during the year from 16 bps in 2020-21 (Chart II.4.3). The average daily spread of 3-month CP(NBFC) rates over the 91-day T-bill rates increased from 16 bps during Q2: 2021-22 to 56 bps in Q4:2021-22. The weighted average discount rates in the primary CP market, which softened in mid-September 2021 to 3.51 per cent, hardened thereafter by about 96 bps to 4.47 per cent in end-March 2022. The hardening of the rates was led by increased liquidity absorption by the Reserve Bank through variable rate reverse repo (VRRR) operations and the NBFCs borrowing through CPs to subscribe to initial public offerings (IPOs) by companies. The 3-month CP (NBFC) rate increased from 3.48 per cent at end-September 2021 to 4.25 per cent at end-March 2022. The 3-month CP (non-NBFC) rate increased from 3.48 per cent to 4.08 per cent during the same period. 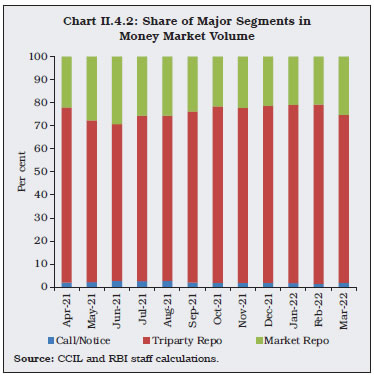
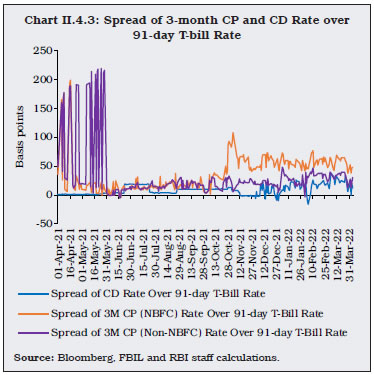 II.4.10 In the primary market, fresh issuance of CDs increased to ₹2.33 lakh crore during 2021-22 from ₹1.31 lakh crore in 2020-21. New issuance of CPs in the primary market increased to ₹20.19 lakh crore in 2021-22 from ₹17.41 lakh crore in 2020-21. 3. G-sec Market II.4.11 During Q1:2021-22, the benchmark G-sec yield softened in response to accommodative stance of monetary policy operations under G-SAP 1.0 and special OMOs (operation twist). Fears of additional government borrowing to bridge the GST compensation cess shortfall and a higher than expected CPI inflation print for May 2021 imparted transient bearishness to market sentiment. Overall, the 10-year generic G-sec yield softened by 12 bps during the quarter to close at 6.05 per cent, trading in the range of 5.96-6.19 per cent (on an intra-day basis). II.4.12 During Q2:2021-22, the 10-year generic yield rose by 17 bps to close at 6.22 per cent. The rise in global crude oil prices, announcements of a phased increase in the quantum of VRRR operations on August 6, 2021 and upward revision of MPC’s inflation forecast in August 2021 meeting led to hardening of yields pushing them up to 6.26 per cent in August 2021. In the first half of September 2021, however, yields softened with resumption of portfolio debt inflows, lower than expected fiscal deficit of the central government for April-July and a softer CPI inflation print for August 2021. Towards the latter part of September 2021, the announcement of OMO sales of short-term securities along with G-SAP 2.0, higher cut-offs in VRRR auctions, hawkish signals from other central banks and a sharp rise in crude oil prices contributed to upward pressure on yields. II.4.13 The 10-year yield hardened during October 2021 in sympathy with rise in US treasury yields and international crude oil prices and pause in G-SAP auctions. The 10-year yield hardened further in December 2021 and closed at 6.45 per cent on December 31, 2021, amidst, devolvement/cancellation in weekly primary auction and rise in international crude oil prices. Overall, the 10-year generic G-sec yield hardened by 23 bps in Q3:2021-22. II.4.14 The 10-year generic G-sec yield hardened in Q4:2021-22, tracking the rise in international crude oil prices and higher than expected gross borrowing by the central government for the next financial year. Yields remained elevated in March amidst rally in commodity prices following escalation of geopolitical conflict. The 10-year generic G-sec yield closed at 6.84 per cent on March 31, 2022 (Chart II.4.4). Overall, the 10-year yield hardened by 67 bps with the sovereign yield curve shifting upwards and flattening during the year.  II.4.15 With the introduction of the fully accessible route (FAR)25 with effect from April 1, 2020, FPIs have three routes to invest in G-secs, viz., the general route with investment limits set under the medium-term framework (MTF), the voluntary retention route (VRR) and the FAR. The limit for FPI investments in G-sec under the MTF for the year 2021-22 was set at ₹3,75,596 crore. The number of securities included under the FAR scheme increased from 12 securities (with outstanding stock of ₹11,79,423 crore as on April 1, 2021) to 17 securities (with outstanding stock of ₹17,58,043 crore as on March 31, 2022). During 2021-22, FPIs registered a net sell of ₹15,048 crore in G-secs under the general route. However, FPIs invested ₹13,275 crore under the FAR route during the same period. FPIs also invested ₹4,370 crore in G-secs under VRR, which has a combined investment limit of ₹1,50,000 crore for G-secs and corporate bonds (increased to ₹2,50,000 crore with effect from April 1, 2022). FPIs bought a net amount of ₹30 crore of State Development Loans (SDLs) during the same period and in the aggregate invested ₹2,627 crore in G-secs and SDLs, across MTF, FAR and VRR segments during April 1, 2021 to March 31, 2022. 4. Corporate Debt Market II.4.16 Financing conditions in the corporate bond market remained accommodative, with compression in credit spreads. During 2021-22, the monthly average yield on AAA-rated 3-year bonds of public sector undertakings (PSUs), financial institutions (FIs) and banks, NBFCs and corporate paper hardened by 3 bps, 29 bps and 32 bps, respectively. The average yield on AAA-rated 3-year bonds stood at 5.84 per cent for PSUs, FIs and banks, 5.98 per cent for NBFCs, and 5.88 per cent for corporates in March 2022. II.4.17 During 2021-22, the monthly average risk premium or spread on AAA-rated 3-year bonds (over 3-year G-sec) decreased from 60 bps to 23 bps for PSUs, FIs and banks, 48 bps to 37 bps for NBFCs and 35 bps to 26 bps for corporates. The narrowing of spreads was also visible across the rating segments. The average daily turnover decreased to ₹7,358 crore during 2021-22 from ₹7,675 crore in the previous year (Chart II.4.5). II.4.18 Primary corporate bond issuances witnessed moderation in Q1:2021-22, but picked up subsequently. Overall, primary corporate bond issuances decreased by 23.4 per cent to ₹6 lakh crore during 2021-22 as against issuances of ₹7.8 lakh crore during the previous year. Private placements remained the preferred choice for corporates, accounting for 98.1 per cent of total resources mobilised through the bond market. Outstanding corporate bonds increased by 11.2 per cent y-o-y to ₹40.2 lakh crore, i.e., 17.0 per cent of GDP at end-March 2022. Investments by FPIs in corporate bonds decreased to ₹1.2 lakh crore at end-March 2022 from ₹1.3 lakh crore at end-March 2021. Consequently, utilisation of the approved limit by FPIs declined to 19.9 per cent at end-March 2022 from 24.5 per cent at end-March 2021. 5. Equity Market II.4.19 Extending the rally from 2020-21, bulls continued to dominate the Indian equity markets in 2021-22. Market sentiment was unsettled, however, on global cues amid concerns over policy normalisation in AEs, country specific factors in systemic EMEs, the spread of Omicron and geopolitical tensions. Nevertheless, the BSE Sensex surged by 18.3 per cent to close at 58,569, outperforming many global peers, while the Nifty 50 increased by 18.9 per cent to close at 17,465 on March 31, 2022 (Chart II.4.6a and Chart II.4.6b). In 2021-22, the total market capitalisation of BSE listed companies surged by 29.2 per cent to ₹264.1 lakh crore. After increasing to 32 per cent in February 2022, India VIX, which captures short-term volatility of Nifty 50, dipped back to its end-March 2021 level of 20.6 per cent. 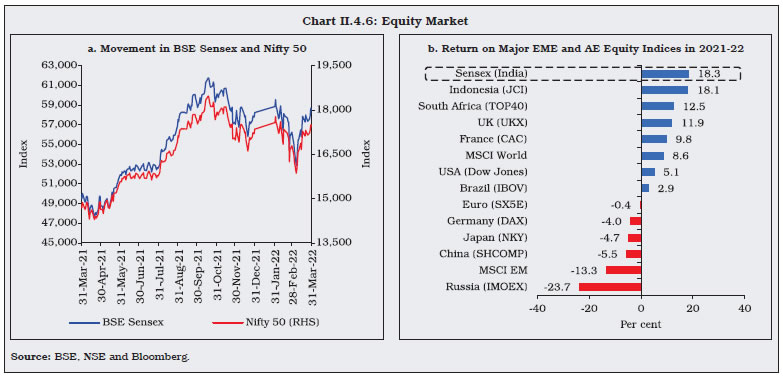 II.4.20 The equity markets commenced the year with modest losses due to a sudden spike in COVID-19 cases, sell-off by FPIs, decline in the manufacturing PMI to a 7-month low and imposition of fresh lockdown-like restrictions in some parts of the country. However, strong corporate earnings for Q4:2020-21 and positive cues from the global markets amidst a swift vaccine roll-out and fiscal stimulus measures lifted investor sentiment towards the end of the quarter. As a result, the market rebounded in May 2021 with the announcement of a series of liquidity enhancing measures by the Reserve Bank and upbeat corporate results. With domestic equities remaining bullish, market capitalisation of the BSE-listed companies rose to over US$ 3 trillion for the first time in its history. II.4.21 The Sensex climbed to fresh highs during June 2021 with the gradual reopening of the economy and pick up in business activity. Market sentiment was dented by concerns over inflation and imminent tapering of monetary stimulus by systemic central banks. The market extended losses towards the end of the month following negative global cues on concerns over the spread of COVID-19 infections in various countries, with sharp volatility spikes in July 2021. Sustained selling by FPIs also added pressure on domestic equities. Equity market bulls wrestled their way back in August 2021, pushing the benchmark indices to record highs, supported by recovery in auto sales, robust GST collections, strong corporate earnings results for Q1:2021-22, benign CPI inflation prints and expansion in India’s manufacturing PMI to 55.3 in July. II.4.22 Despite a sell-off in global equities, the domestic equity market registered gains in September 2021 on bullish sentiment stirred by announcements of the extension of production-linked incentive (PLI) scheme for various sectors by the government, setting up of the National Asset Reconstruction Company (NARCL) and relief measures for the telecom sector. Thereafter, domestic equity markets witnessed episodes of volatility in sync with global peers as a combination of ongoing regulatory clampdowns in a systemic EME and corporate debt woes sparked global investor concern over potential spillovers. Fresh highs were climbed during the first half of October 2021, buoyed by signs of recovery in economic activity, strong demand outlook ahead of the festive season and continued accommodative monetary policy stance. However, the rally proved transient due to accelerated profit bookings in the second half following mixed Q2:2021-22 corporate earnings results and concerns over stretched valuations. II.4.23 The domestic equity market remained undeterred by tapering announcements by the US Fed in the first week of November 2021. Notwithstanding this positive start, however, the equities registered sharp declines towards the end of the month, triggered by the reports of detection of Omicron and imposition of fresh rounds of travel restrictions across various parts of the globe. The downtrend deepened in the first half of December 2021 as FPIs continued to offload Indian equities and monetary tightening in AEs seemed imminent. However, robust GST collection, expansion in the manufacturing PMI for November and the Reserve Bank’s status quo in monetary policy setting provided succour to the market. II.4.24 Amidst heightened volatility, the sell-off in the domestic equities exacerbated in January 2022 as inflationary concerns, rising US Treasury yields and crude oil prices as well as the Fed’s signalling of an early interest rate hike dampened investor sentiments. Notwithstanding global headwinds, the Indian equity market reacted positively to the budget announcements and the Reserve Bank’s accommodative monetary policy in February 2022. However, the steady rise in crude oil prices amidst escalating geopolitical tensions weighed heavily on investor sentiments. Domestic equities witnessed sharp sell-off in the second half of the month following the breakout of war in Ukraine. Sentiments improved somewhat in March following the announcements of electoral results of state assemblies and positive global cues, but remained edgy as concerns persisted over Russia-Ukraine peace talks, volatility in commodity prices and renewed lockdown measures in China. 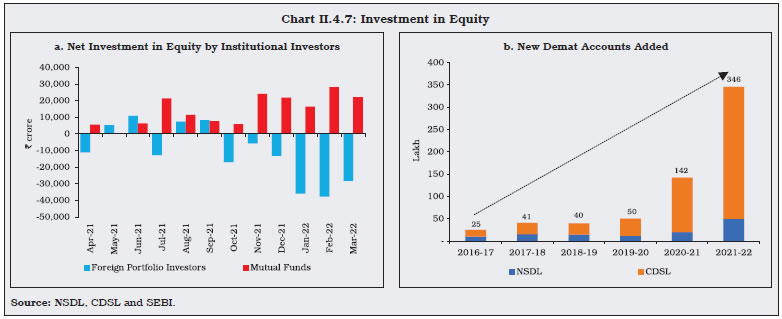 II.4.25 The FPIs became net sellers for eight out of 12 months in 2021-22 with a net outflow of ₹1.3 lakh crore as against a net inflow of ₹2.8 lakh crore in the previous year. Mutual funds, on the other hand, made heavy investments worth ₹1.7 lakh crore in the Indian equity market in 2021-22 (Chart II.4.7a). II.4.26 The direct participation of retail investors in equities continued to increase, with the opening of 3.46 crore demat accounts during 2021-22, as against 1.42 crore demat accounts opened during the previous year (Chart II.4.7b). During 2021-22, on an average, 28.8 lakh demat accounts were opened every month, which is higher than 11.8 lakh per month in the previous year and 4.2 lakh demat accounts per month in 2019-20. Primary Market Resource Mobilisation II.4.27 In the primary segment of the equity market, resource mobilisation through initial public offerings (IPOs), follow-on public offers (FPOs) and rights issues increased by 26.1 per cent to ₹1.39 lakh crore during 2021-22 as against ₹1.1 lakh crore during the previous year (Chart II.4.8a and Appendix Table 5). ₹1.13 lakh crore were mobilised through 121 IPO/FPO issues, out of which 70 issues amounting to ₹958 crore were listed on the small and medium enterprises (SMEs) platform of the BSE and the NSE. Resource mobilisation through rights issues decreased to ₹26,327 crore during 2021-22 as compared with ₹64,059 crore during the previous year. Resource mobilisation through preferential allotment and qualified institutional placement (QIP) decreased to ₹92,135 crore during 2021-22, as against ₹1,19,678 crore during the previous year. 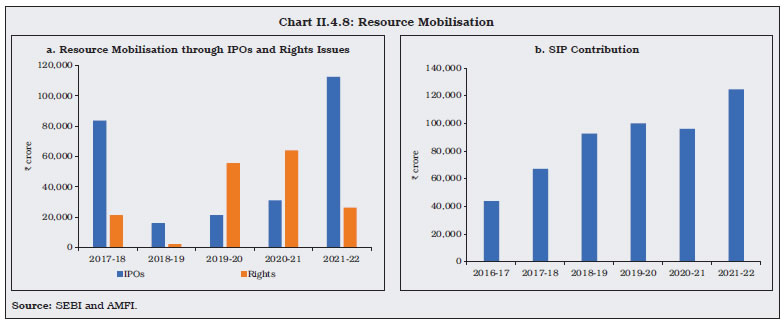 II.4.28 Of the net resources mobilised by mutual funds of ₹2.5 lakh crore during 2021-22, systematic investment plan (SIP) contributions witnessed a healthy growth - an indication of rising retail participation and financialisation of household savings (Chart II.4.8b). Equity-oriented schemes witnessed net mobilisation of ₹1,54,094 crore in 2021-22 as against net redemption of ₹39,327 crore in the previous year. Assets under management (AUM) of equity-oriented mutual funds increased by 37.2 per cent to ₹13.7 lakh crore at end-March 2022 from ₹10 lakh crore at end-March 2021. 6. Foreign Exchange Market II.4.29 In the foreign exchange market, turnover picked up in both interbank and merchant segments as compared with the previous year. II.4.30 The Indian rupee weakened by 1.64 per cent during Q1:2021-22 amid a steep rise in COVID-19 infections and sustained gains in crude oil prices. A weaker dollar and a current account surplus of USD 6.5 billion during the quarter limited the downside for the rupee. A pick-up in the pace of vaccination and strong foreign flows to IPOs by Indian corporates helped Indian rupee outperform most of its Asian peers in Q2:2021-22. The rupee was also supported by a mild correction in crude oil prices and a brief rally in emerging market currencies. II.4.31 The Indian rupee again came under pressure during Q3:2021-22 as the US dollar gained, tracking rise in US short term yields, as traders priced in hawkish FOMC statements (faster taper and rate hikes in 2022). During the quarter, pressure on EME currencies rose across the board. The Indian rupee touched an intra-day low of ₹76.32 against the US dollar on December 16, 2021 as markets braced for acceleration of US Federal Reserve taper and prepared for policy divergence between US and the rest of the AEs. The rupee recovered sharply in the latter part of December 2021 tracking dollar weakness and closed at ₹74.33/USD on December 31, 2021, weakening 0.13 per cent over Q3:2021-22. The rupee remained under pressure in Q4:2021-22 as US yields rose sharply in anticipation of rate hikes by the US Fed with the US dollar index inching towards 100 mark amid safe haven demand due to geopolitical tensions. FPI outflows from domestic equity markets and a broad-based rally in commodity prices also impacted the rupee during the quarter. Consequently, Indian rupee touched a fresh intra-day low of ₹76.98/USD on March 7, 2022 with most emerging market currencies remaining under pressure during the quarter. Overall, Indian rupee closed at ₹75.79/USD on March 31, 2022, with a net depreciation of 3.53 per cent in 2021-22 (Chart II.4.9).  II.4.32 On an average basis, the 40-currency nominal effective exchange rate (NEER) depreciated by 0.8 per cent in 2021-22 (y-o-y). However, the 40-currency real effective exchange rate (REER) appreciated by 1.2 per cent during this period, reflecting higher domestic inflation vis-à-vis trading partners. II.4.33 During 2021-22, long-term forward premia remained anchored. While short-term forward premia witnessed some gyration due to factors like IPO related rupee demand during Q1:2021-22, they stabilised in the subsequent quarters, amidst comfortable system-wide liquidity conditions. 7. Conclusion II.4.34 In sum, financial markets, going forward, face considerable uncertainty and tightening of global financial conditions. Inflation concerns amid growth worries have magnified the risks to emerging market currencies, with the risk of global spillovers. II.5 GOVERNMENT FINANCES II.5.1 In 2022, fiscal deficits are projected to moderate in the majority of the G-20 countries but would mostly remain above pre-pandemic levels (Chart II.5.1a). While the projected fiscal adjustment plans are expected to lower the public debt-GDP ratios in advanced economies over the medium term, the average government debt-GDP ratio for emerging market economies (EMEs) remains on an upward trajectory, driven mainly by China.26 India’s gross debt is projected to remain range bound in 2022 but stay higher than peer EMEs (except Brazil) [Chart II.5.1b]. II.5.2 Against this backdrop, sub-sections 2 and 3 present the position of central government finances in 2021-22 and 2022-23, respectively. Sub-sections 4 and 5 outline the developments in state government finances during 2021-22 and 2022-23. General government finances are discussed in sub-section 6. The final section sets out concluding remarks and some policy perspectives. 2. Central Government Finances in 2021-22 II.5.3 In the wake of the second wave of the pandemic, the government announced a fiscal package amounting to ₹6.3 lakh crore during Q1:2021-22, which included, inter alia, extension of the Pradhan Mantri Garib Kalyan Anna Yojana, measures to strengthen public health, extension of the AatmaNirbhar Bharat Rozgar Yojana, loan guarantee scheme for COVID-19 affected sectors, provision of broadband connectivity to villages and boost for project exports through the National Export Insurance Account. This was supplemented by additional expenditure measures during the year such as increased allocation for the National Rural Employment Guarantee Scheme and the Pradhan Mantri Awas Yojana (Urban), as outlined in the Supplementary Demand for Grants (SDG).27 As a result, total expenditure overshot budget estimates by ₹2.9 lakh crore (a deviation of ₹2.4 lakh crore under revenue expenditure and ₹48,475 crore under capital expenditure). The additional spending was, however, offset by higher tax and non-tax revenues, leading to a consolidation of 0.03 percentage points in the gross fiscal deficit (GFD) from the budget estimate (BE) of 6.8 per cent of GDP.28 II.5.4 Tax revenues remained buoyant even in the face of the pandemic (Table II.5.1), with gross tax revenues registering a y-o-y growth of 24.1 per cent in 2021-22 RE (25.2 per cent over 2019-20). Aided by higher than budgeted surplus transfer by the Reserve Bank, non-tax revenues also surpassed BE by ₹70,763 crore. Disinvestment receipts, however, fell short of the BE by ₹97,000 crore. | Table II.5.1: Tax Buoyancy | | | Average Tax Buoyancy (2010-11 to 2018-19) | 2021-22 (BE) | 2021-22 (RE) | 2022-23 (BE) | | 1 | 2 | 3 | 4 | 5 | | 1. Gross Tax Revenue | 1.11 | 1.33 | 1.24 | 1.05 | | 2. Direct Taxes | 1.03 | 1.79 | 1.66 | 1.49 | | (i) Corporation Tax | 0.92 | 1.80 | 2.00 | 1.47 | | (ii) Income Tax | 1.27 | 1.81 | 1.37 | 1.57 | | 3. Indirect Taxes | 1.25 | 0.91 | 0.88 | 0.62 | | (i) GST | - | 1.78 | 1.19 | 1.71 | | (ii) Customs Duty | 0.31 | 1.71 | 2.07 | 1.39 | | (iii) Excise Duty | 0.91 | -0.57 | 0.03 | -1.64 | GST: Goods and Services Tax. - : Not available.
Note: Tax buoyancy is defined as the responsiveness of tax revenue to changes in nominal GDP and to discretionary changes in tax policies. Calculations for 2021-22 (BE) are made over 2020-21 (RE).
Source: RBI staff calculations based on Union Budget documents for various years. | 3. Central Government Finances in 2022-23 II.5.5 For 2022-23, the Union Budget has sought to balance fiscal prudence with a focus on capital expenditure in order to accelerate growth and place the ongoing economic rebound on a firm footing. The GFD is budgeted at 6.4 per cent of GDP29, a consolidation of 29 basis points (bps) over 2021-22 (RE) in line with the medium-term target of achieving a GFD below 4.5 per cent of GDP by 2025-26.30 This consolidation is sought to be achieved through containment of revenue expenditure to 12.4 per cent of GDP, as capital expenditure is budgeted to rise to an all-time high of 2.9 per cent of GDP and receipts are pegged at moderate levels (Table II.5.2). II.5.6 Under capital expenditure, a large push has been given to loans and advances to states, with a provision of ₹1 lakh crore in the form of 50-year interest free loans to be utilised for Pradhan Mantri Gati Shakti31 related capital investment, supplemental funding for priority segments of Pradhan Mantri Gram Sadak Yojana, digitisation of the economy, and other productive capital investment. Capital outlay, i.e., capital expenditure less loans and advances, is also budgeted to increase by 11.5 per cent in 2022-23 on top of a growth of 73.3 per cent in 2021-22 (RE), led by robust growth in infrastructure spending. Around two-thirds (64.7 per cent) of the total capex is to be incurred by the ministries of defence; road; and railways (Chart II.5.2). The revenue expenditure to capital outlay (RECO) ratio is budgeted to improve for the second year in a row to 5.2, as against the decadal average of 7.8. On the receipts side, revenue forecasts are based on conservative nominal GDP projections and the disinvestment target has been set at ₹65,000 crore, which is close to the average realisation of around ₹66,000 crore in the past five years. | Table II.5.2: Central Government's Fiscal Performance | | (Per cent of GDP) | | Item | 2004-08 | 2008-10 | 2010-15 | 2014-15 | 2015-16 | 2016-17 | 2017-18 | 2018-19 | 2019-20 | 2020-21 | 2021-22 (BE) | 2021-22 (RE) | 2022-23 (BE) | | 1 | 2 | 3 | 4 | 5 | 6 | 7 | 8 | 9 | 10 | 11 | 12 | 13 | 14 | | I. Non-debt Receipts | 11.0 | 9.7 | 9.5 | 9.2 | 9.1 | 9.4 | 9.1 | 8.8 | 8.7 | 8.5 | 8.9 | 9.2 | 8.9 | | II. Gross Tax Revenue (a+b) | 10.7 | 10.4 | 10.2 | 10.0 | 10.6 | 11.1 | 11.2 | 11.0 | 10.0 | 10.2 | 9.9 | 10.6 | 10.7 | | a) Direct Tax | 5.1 | 6.0 | 5.7 | 5.6 | 5.4 | 5.5 | 5.9 | 6.0 | 5.2 | 4.8 | 5.0 | 5.3 | 5.5 | | b) Indirect Tax | 5.6 | 4.4 | 4.5 | 4.4 | 5.2 | 5.6 | 5.4 | 5.0 | 4.8 | 5.5 | 5.0 | 5.4 | 5.2 | | III. Net Tax Revenue | 7.9 | 7.6 | 7.3 | 7.2 | 6.9 | 7.2 | 7.3 | 7.0 | 6.8 | 7.2 | 6.9 | 7.5 | 7.5 | | IV. Non-tax Revenue | 2.2 | 1.8 | 1.8 | 1.6 | 1.8 | 1.8 | 1.1 | 1.2 | 1.6 | 1.0 | 1.1 | 1.3 | 1.0 | | V. Non-debt Capital Receipts | 0.9 | 0.3 | 0.4 | 0.4 | 0.5 | 0.4 | 0.7 | 0.6 | 0.3 | 0.3 | 0.8 | 0.4 | 0.3 | | VI. Total Expenditure | 14.5 | 16.1 | 14.4 | 13.3 | 13.0 | 12.8 | 12.5 | 12.2 | 13.4 | 17.7 | 15.6 | 15.9 | 15.3 | | VII. Revenue Expenditure | 12.1 | 14.4 | 12.6 | 11.8 | 11.2 | 11.0 | 11.0 | 10.6 | 11.7 | 15.6 | 13.1 | 13.4 | 12.4 | | VIII. Capital Expenditure | 2.4 | 1.7 | 1.8 | 1.6 | 1.8 | 1.8 | 1.5 | 1.6 | 1.7 | 2.2 | 2.5 | 2.5 | 2.9 | | IX. Revenue Deficit | 2.0 | 5.0 | 3.5 | 2.9 | 2.5 | 2.1 | 2.6 | 2.4 | 3.3 | 7.3 | 5.1 | 4.6 | 3.8 | | X. Gross Fiscal Deficit | 3.5 | 6.3 | 4.9 | 4.1 | 3.9 | 3.5 | 3.5 | 3.4 | 4.7 | 9.2 | 6.8 | 6.7 | 6.4 | BE: Budget Estimates. RE: Revised Estimates.
Note: Going by the principle of using the latest available GDP data for any year, GDP used for 2021-22 (RE) is as per the SAE, 2021-22.
Source: Union Budget documents. | II.5.7 The Union Budget proposals for 2022-23 entail gross market borrowings of ₹14.31 lakh crore (adjusting for switch operations conducted on January 28, 2022) as against ₹10.47 lakh crore in 2021-22 (RE), an increase of 36.7 per cent.32 Marking a return to the pre-pandemic trend, net market borrowings are budgeted to finance 67.3 per cent of the GFD in 2022-23, up from 48.8 per cent in 2021-22 (RE), with lower recourse to treasury bills, small savings, and cash balances (Chart II.5.3). As a part of the overall market borrowings, the government also intends to issue Sovereign Green Bonds to facilitate climate change transition.
4. State Finances in 2021-22 II.5.8 State government finances were budgeted to improve in 2021-22 with the GFD-GDP ratio narrowing to 3.5 per cent from 4.7 per cent in the revised estimates for 2020-21 (Table II.5.3 and Appendix Table 6). II.5.9 Provisional accounts (PA)33 data of 26 states available for April-February 2021-22 indicate that their consolidated GFD was lower by 31.5 per cent than a year ago, mainly due to higher growth in revenue receipts (30.5 per cent as against a contraction of 8.6 per cent in 2020-21). Following the Centre’s move of reduction in excise duty on petrol and diesel on November 3, 2021, majority of states reduced their value added tax (VAT) in the range of ₹1.8 to ₹10.0 per litre of petrol and ₹2.0 to ₹7.0 per litre of diesel. The embodied revenue loss was more than offset by central transfers in lieu of GST compensation – the Centre released ₹1.59 lakh crore in 2021-22 (₹0.75 lakh crore on July 15; 0.40 lakh crore on October 7; and ₹0.44 lakh crore on October 28) to states as back-to-back loans. Apart from these loans, the Centre has also released GST compensation of ₹60,000 crore. In addition to the regular instalment of tax devolution, the Centre released two advance instalments of tax devolution in November 2021 and January 2022. | Table II.5.3: Fiscal Position of States | | (₹ lakh crore) | | | 2017-18 | 2018-19 | 2019-20 | 2020-21 (RE) | 2021-22 (BE) | | 1 | 2 | 3 | 4 | 5 | 6 | | I. Revenue Receipts | 23.2 | 26.2 | 26.7 | 27.9 | 34.5 | | | (13.6) | (13.9) | (13.3) | (14.1) | (14.6) | | II. Capital Receipts | 0.4 | 0.4 | 0.6 | 0.2 | 0.2 | | | (0.2) | (0.2) | (0.3) | (0.1) | (0.1) | | III. Revenue Expenditure | 23.4 | 26.4 | 27.9 | 31.9 | 35.7 | | | (13.7) | (14.0) | (13.9) | (16.1) | (15.1) | | IV. Capital Expenditure | 4.3 | 4.9 | 4.6 | 5.5 | 7.2 | | | (2.5) | (2.6) | (2.3) | (2.8) | (3.1) | | a. Capital Outlay | 3.9 | 4.4 | 4.2 | 5.0 | 6.7 | | | (2.3) | (2.3) | (2.1) | (2.5) | (2.8) | | b. Loans and Advances by States | 0.4 | 0.5 | 0.4 | 0.5 | 0.5 | | | (0.2) | (0.2) | (0.2) | (0.2) | (0.2) | | V. Fiscal Deficit | 4.1 | 4.6 | 5.3 | 9.3 | 8.2 | | | (2.4) | (2.4) | (2.6) | (4.7) | (3.5) | | VI. Revenue Deficit | 0.2 | 0.2 | 1.2 | 3.9 | 1.2 | | | (0.1) | (0.1) | (0.6) | (2.0) | (0.5) | Note: Figures in parentheses are per cent of GDP.
Source: Budget documents of state governments and CAG. | II.5.10 Despite the second wave of the pandemic and corresponding state-specific restrictions, capital outlay remained robust, while higher revenue expenditure helped in strengthening the economic recovery. Thirteen states received permission to borrow an additional amount of ₹32,412 crore (till Q2: 2021-22) as an incentive for achieving the target set by the Ministry of Finance for capital expenditure. The outlay under the ‘Scheme for Financial Assistance to States for Capital Investment’ has been enhanced by the Centre from ₹10,000 crore in the BE to ₹15,000 crore in the RE for 2021-22. 5. State Finances in 2022-23 II.5.11 As per information available for 20 state governments, their combined GFD has been budgeted at 3.2 per cent of their consolidated GSDP in 2022-23 as against 3.7 per cent in 2021-22 (RE), though there is significant variation amongst states (Table II.5.4). The consolidation in states’ fiscal position can entirely be attributed to revenue account as the growth in revenue receipts is budgeted at a significantly higher level than revenue expenditure, resulting in compression of revenue deficit by 55 bps. | Table II.5.4: State Government Finances 2022-23*: Key Indicators | | (Per cent of GSDP) | | Item | 2020-21 | 2021-22 (BE) | 2021-22 (RE) | 2022-23 (BE) | | 1 | 2 | 3 | 4 | 5 | | Revenue Deficit | 2.0 | 0.7 | 1.1 | 0.6 | | Gross Fiscal Deficit | 4.1 | 3.7 | 3.7 | 3.2 | | Primary Deficit | 2.2 | 1.7 | 1.9 | 1.5 | *: Data pertain to twenty states that have presented their final budgets for 2022-23.
Source: Budget documents of state governments. | II.5.12 Following the recommendations of the FC-XV, Centre has allowed the states a fiscal deficit of up to 4 per cent of gross state domestic product (GSDP) in 2022-23, of which 0.5 per cent will be tied to power sector reforms. In the Union Budget 2022-23, the Centre has budgeted tax devolution to grow by 9.6 per cent on the top of a high base of 2021-22. For 2022-23, the budgeted FC-XV’s grants are 9 per cent lower than in 2021-22 (RE), primarily due to reduction in post devolution revenue deficit grants in anticipation of further improvement in states’ revenue deficit. As stated earlier, states are being extended ₹1 lakh crore in 50-year interest-free loans over and above normal borrowings to spur overall investment. 6. General Government Finances II.5.13 As per the latest available information for 2022-23, the general government deficit and debt are expected to moderate to around 9 per cent and 85 per cent of GDP, respectively, from the peak levels of 13.3 per cent and 89.4 per cent in 2020-21 (RE), respectively (Appendix Table 7). 7. Conclusion II.5.14 While maintaining fiscal prudence, the budget has relied on an investment-led growth strategy to steer the economy out of the COVID-19 pandemic. In 2022-23, calibrated fiscal consolidation is envisaged while improving the quality of expenditure. Going forward, fiscal consolidation will need to be pursued actively to manage fiscal and financing risks and to ensure debt sustainability, while building credibility in public finances. II.6 EXTERNAL SECTOR II.6.1 India’s external sector remained resilient during the year. Even as the domestic economic recovery drove up import demand, adverse net terms of trade shocks and safe haven demand for gold expanded the merchandise trade deficit in the second half of 2021-22. Nevertheless, robust exports of services and strong capital inflows dominated by foreign direct investment (FDI) moderated pressures on the current account balance, which swung from surpluses into deficits in the later part of the year. With external funding needs remaining modest, reserve accretions during the year built up resilience in the face of global spillovers. II.6.2 Set against this backdrop, sub-section 2 presents a brief overview of the global economic and financial conditions against which these shifts in external balances occurred. This is followed by a discussion on merchandise trade and invisibles in sub-sections 3 and 4, respectively. Sub-section 5 presents an analysis of capital flows. An assessment of external vulnerability indicators is provided in sub-section 6, followed by concluding observations. 2. Global Economic Conditions II.6.3 Global economic activity gained traction, albeit unevenly, in Q1:2021, but lost pace in Q2:2021 as rising infections in several parts of the world and supply shortages took their toll. Supply chain and logistics disruptions combined with international surges in commodity price pressures posed downside risks to the global economic recovery. Although global growth picked up to 6.1 per cent in 2021 from (-) 3.1 per cent in 2020, the IMF revised downwards its global growth projection for 2022 in April 2022 to 3.6 per cent as against 4.4 per cent in January 2022 (Chart II.6.1a). In late February 2022, renewed bouts of financial market turbulence, synchronised upsurges in global commodity prices and economic and financial sanctions in the wake of the Russia-Ukraine conflict put the global economy at risk of stagflation with threats of supply bottlenecks and deglobalisation becoming acute. II.6.4 World merchandise trade rebounded to pre-pandemic level, recording a growth of 26.0 per cent in value terms and 10.3 per cent in volume terms during 2021, aided by strong growth in Asian economies, inspite of supply disruptions and elevated freight rates (Chart II.6.1b). Thus, the contraction in world trade during the pandemic seems to be less severe, and the recovery has been much faster than the earlier two trade recessions (Chart II.6.2). According to UNCTAD’s February 2022 Global Trade Update, the value of global trade reached a record level of US$ 28.5 trillion in 2021. Trade in services, however, lagged merchandise trade, primarily on account of the travel and tourism sector which was hit hard by the pandemic due to the imposition of travel restrictions. 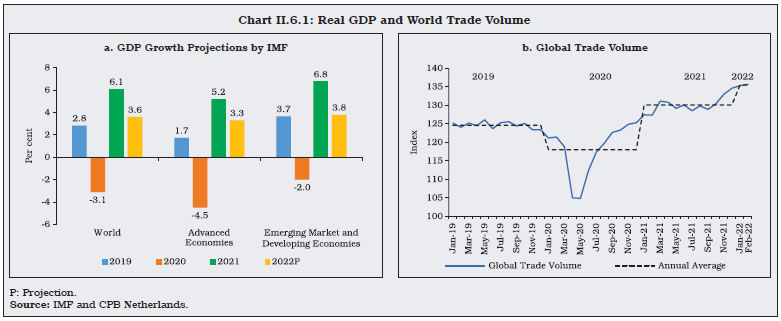 II.6.5 FDI flows rebounded in 2021, with advanced economies (AEs) dominating. The outlook on portfolio flows in emerging market economies (EMEs) improved with strong rebounds in hard currency issuances, while local currency debt flows remained weak. Towards the close of 2021, intents of policy normalisation dovetailing into tapers of asset purchases, elevated inflation risks, renewed bouts of volatility and heightened uncertainties on the heels of war unsettled global financial market conditions and triggered flights of portfolio flows out of EMEs as an asset class in search of safe haven. 3. Merchandise Trade II.6.6 The year 2021-22 turned out to be a remarkable year for India’s merchandise trade. Both exports and imports reached historically high levels. Shrugging off global supply chain disruptions, a broad-based recovery in exports got entrenched, expanding into newer markets and product categories. During 2021-22, India’s merchandise exports and imports expanded by 34.7 per cent and 28.9 per cent in US dollar terms over pre-pandemic levels, respectively. In terms of volume, exports recorded an increase of 16.6 per cent on the same basis. Imports surpassed pre-pandemic levels from Q2:2021-22 (Table II.6.1). II.6.7 At a disaggregated level, exports growth was driven by engineering goods, petroleum products, chemicals, agricultural products, textiles, electronic goods, drugs and pharmaceuticals and gems and jewellery. Labour-intensive export categories like apparels, also contributed positively, reversing the losses observed during April-September 2021. However, leather products and oilseeds recorded a slight decline (Chart II. 6.3). | Table II.6.1: India’s Merchandise Trade | | | Value in US$ Billion | Growth Rate (Y-o-Y) | Growth over Pre-COVID Period | | 2019-20 | 2020-21 | 2021-22 | 2019-20 | 2020-21 | 2021-22 | 2021-22 | | 1 | 2 | 3 | 4 | 5 | 6 | 7 | 8 | | Exports | | Q1 | 80.9 | 51.3 | 95.5 | -1.4 | -36.6 | 86.1 | 18.1 | | Q2 | 78.2 | 74.1 | 102.7 | -3.9 | -5.3 | 38.6 | 31.3 | | Q3 | 79.1 | 75.8 | 106.8 | -1.9 | -4.2 | 41.0 | 35.1 | | Q4 | 75.1 | 90.4 | 116.8 | -12.7 | 20.4 | 29.2 | 55.6 | | Annual | 313.3 | 291.6 | 421.9 | -5.1 | -6.9 | 44.7 | 34.7 | | Imports | | Q1 | 130.1 | 61.3 | 127.0 | 1.1 | -52.9 | 107.3 | -2.4 | | Q2 | 118.0 | 88.3 | 147.5 | -11.3 | -25.2 | 67.1 | 25.0 | | Q3 | 116.1 | 110.8 | 166.9 | -11.2 | -4.6 | 50.6 | 43.7 | | Q4 | 110.5 | 131.7 | 170.7 | -9.2 | 19.1 | 29.6 | 54.4 | | Annual | 474.7 | 392.0 | 612.0 | -7.7 | -17.4 | 56.1 | 28.9 | | Trade Balance | | Q1 | -49.2 | -9.9 | -31.4 | | | | | | Q2 | -39.7 | -14.1 | -44.8 | | | | | | Q3 | -37.1 | -35.1 | -60.1 | | | | | | Q4 | -35.4 | -41.2 | -53.9 | | | | | | Annual | -161.4 | -100.4 | -190.1 | | | | | Note: Quarterly figures may not add up to annual figures.
Source: DGCI&S. |
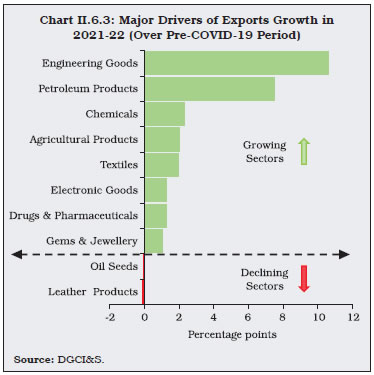 II.6.8 Over the last decade, there has been an inter-temporal shift in the export basket, with the share of petroleum products and chemicals having gone up on the back of rising competitiveness (Economic Survey, GoI, 2020-21). In contrast, the shares of gems and jewellery and apparels have declined (Chart II.6.4). II.6.9 Engineering goods, which account for one-fourth of India’s total exports, witnessed a robust growth of around 42 per cent in 2021-22 over their pre-pandemic levels. Iron and steel exports contributed nearly 41 per cent of growth of total engineering exports during 2021-22 (Chart II.6.5), benefitting from rising global prices, strong global demand and production cuts by China. The government has announced production-linked incentive (PLI) schemes for various product categories (Box II.6.1).
II.6.10 Petroleum, oil and lubricants (POL) exports accounted for 16.0 per cent of India’s total exports, benefitting from higher global crude oil prices and expansion to new markets during 2021-22. Australia and Saudi Arabia have become the fifth and seventh largest export destinations for India’s petroleum exports. Destination and product-wise diversification underscore the competitiveness of Indian refiners, indicating higher value addition and reduction in concentration risk (Chart II.6.6). Box II.6.1
Role of Global Value Chains (GVCs) in Enhancing Exports Competitiveness Over the past two decades, the structure and pattern of global trade has reflected a defragmentation of production processes across geographies. Now finished goods account for only 30 per cent of global trade in goods and services among countries. 70 per cent of global trade involves transactions in services, raw materials, parts and components through global value chains (GVCs) [OECD, 2020]. India’s GVC integration, as measured by the GVC participation index, has been low – 34.0 per cent, of total exports – relative to the Association of Southeast Asian Nations (ASEAN) countries (45.9 per cent of gross exports). Shipping connectivity, greater GVC participation, higher FDI flows, and lower tariff rates are driving this phenomenon (Chart 1a and 1b).  A cross-country panel regression framework covering 40 major advanced and emerging economies for the period 2000-2019, with manufacturing exports of country ‘i’ in year ‘t’ (MExpit) as the dependent variable and the GVC participation index (GVCit) and shipping connectivity index (Shippingit) as regressors and tariff levels (Tariffit), research and development (R&Dit) expenditure, infrastructure and FDI inflows as control variables in the form indicated below suggests that GVC participation positively impacts export performance for manufacturing exports in all specifications (Table 1). 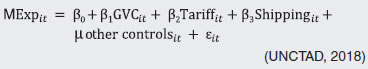 Shipping connectivity index has a positive and significant impact on exports. Higher tariff levels adversely impact the input cost structure and export competitiveness. These results suggest that even as the production-linked incentive (PLI) scheme aims to enhance India’s participation in GVCs, higher tariff rates, especially on intermediate goods, may be a deterrent in enhancing India’s export competitiveness. Longer duration tax incentives for R&D on the lines of practices in ASEAN countries and appropriate FDI policies can bring technological competitiveness and export-orientation to India’s manufacturing sector. | Table 1: Impact of Logistics and GVC on Manufacturing Export Performance | | (Dependent Variable: Manufacturing Exports) | | Explanatory Variables | Coefficient | | Model 1 | Model 2 | Model 3 | | 1 | 2 | 3 | 4 | | GVC it | 0.0128*** | 0.0114*** | | | | (0.00346) | (0.00325) | | | Log(Shipping it) | 0.0911* | | 0.0984** | | | (0.0468) | | (0.0475) | | Log (R&D it) | 0.147*** | 0.233*** | 0.139*** | | | (0.0474) | (0.0429) | (0.0481) | | Log(Electricity it) | 1.898*** | 1.914*** | 1.642*** | | | (0.332) | (0.327) | (0.330) | | Tariff Rate it | -0.0162* | -0.0177** | -0.0127 | | | (0.00830) | (0.00818) | (0.00838) | | FDI it | 0.000582** | 0.000562** | 0.000644** | | | (0.000255) | (0.000245) | (0.000258) | | Constant | 15.26*** | 15.50*** | 16.99*** | | | (1.580) | (1.543) | (1.533) | | Observations | 446 | 511 | 446 | | R2 | 0.53 | 0.52 | 0.51 | *** : Significant at 1 per cent level. ** Significant at 5 per cent level.
* Significant at 10 per cent level.
Note: Standard errors in parentheses.
Source: RBI staff calculations. | References: 1.Osakwe, P. N. and Jean-Marc Kilolo (2018), ‘What Drives Export Diversification? New Evidence from a Panel of Developing Countries’, UNCTAD Research Paper No.3/2018, UNCTAD. 2. OECD (2020), ‘Trade Policy Implications of Global Value Chains’, OECD Trade Policy Brief. | II.6.11 Agricultural exports, including geographical indication (GI) products, recorded impressive growth for the second successive year in 2021-22. India’s wheat exports reached highest-ever levels in 2021-22, largely benefitting from elevated freight costs and lower inventories in major global exporting countries, viz., Canada and Russia. Rice exports achieved record levels and grew to 1.5 times over their levels in 2019-20. Within rice, exports of non-Basmati varieties have seen a remarkable rise drawing strength from rising price competitiveness, especially in markets such as Bangladesh, China and Vietnam (Chart II.6.7a and Chart II.6.7b). 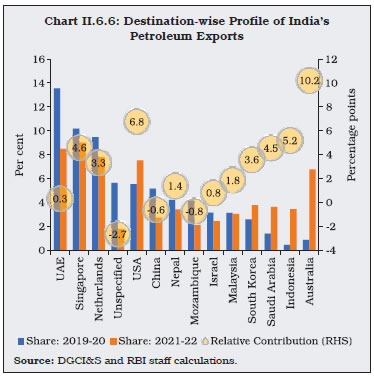 II.6.12 Gems and jewellery exports, which have been on a downward trend for past four years, registered a growth of around 50 per cent during 2021-22. This renewed strength was driven by exports of pearls and precious stones and strong demand from the US, the largest export market of Indian diamonds. On the other hand, exports to the UAE remain at almost 50 per cent of their pre-pandemic levels (Chart II.6.8a and II.6.8b). II.6.13 Globally, the automotive industry accounts for 11 per cent of semiconductor demand. Although automotive exports from India witnessed an average growth of 17.5 per cent during 2021-22 compared to 2019-20 (pre-pandemic), persisting global semiconductor shortages led to production cuts and temporary closure of factories (Chart II.6.9a and II.6.9b). II.6.14 A major key impediment to global trade has been disruptions in the shipping industry, impacting maritime logistics. The schedule reliability of ships covering 34 different trade lanes and 60 plus carriers averaged 35.0 per cent in 2021-22 as against 76.5 per cent in the pre-pandemic times (2019-20). Consequently, the global average delay for vessel arrival stood at 7.1 days during 2021-22 as against 4.3 days prior to the pandemic in 2019-20. The Freightos Baltic Global Container Index, which reflects ocean container transport spot across 12 global trade lanes, reached its historical high in October 2021 and remains well above pre-pandemic levels. 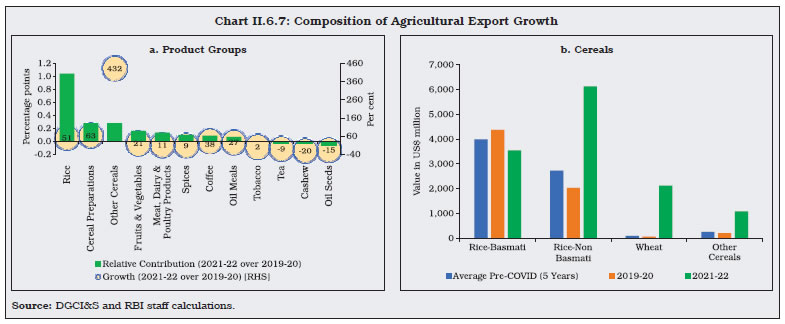
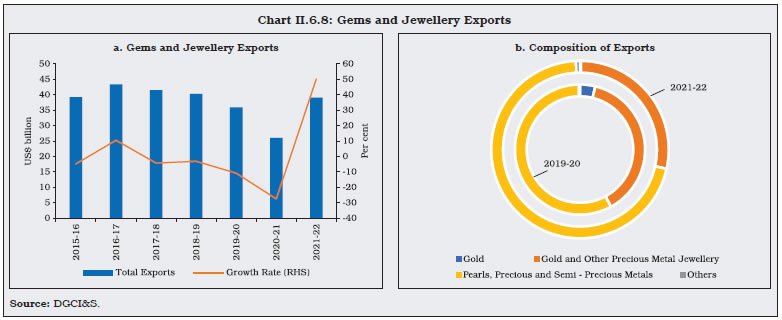 II.6.15 Merchandise imports witnessed a broad-based expansion, aided by robust domestic demand, to US$ 612.0 billion during 2021-22, surpassing pre-COVID levels by 28.9 per cent. In terms of volume, merchandise imports have expanded by 14.4 per cent during 2021-22 over pre-COVID levels. At a disaggregated level, POL was the major driver of imports, followed by electronic goods and gold (Chart II.6.10a and II.6.10b). II.6.16 More recently, brent crude oil prices, which witnessed volatility amidst Russia-Ukraine crisis, softened to US$ 108 per barrel on March 31, 2022 from its recent high of US$ 128 per barrel (March 8, 2022). Oil demand was dampened on account of expectations of a rate increase by the US Fed and stringent lockdown in China due to the recent increase in number of COVID-19 cases. Source-wise, Iraq and Saudi Arabia remained the major source of crude oil imports for India. The diversification of India’s import basket for POL in 2021-22 reflects a conscious policy measure to diversify suppliers (Chart II.6.11a and II.6.11b). 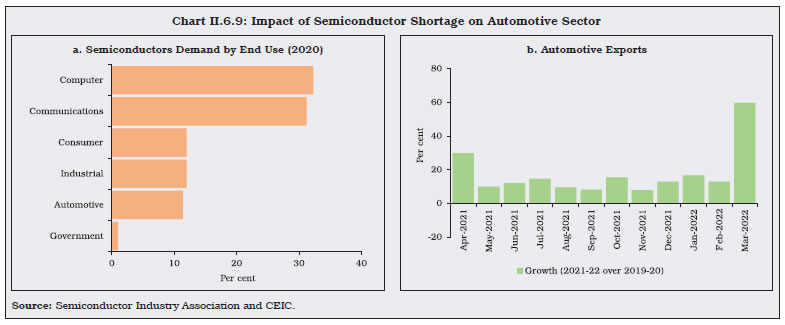
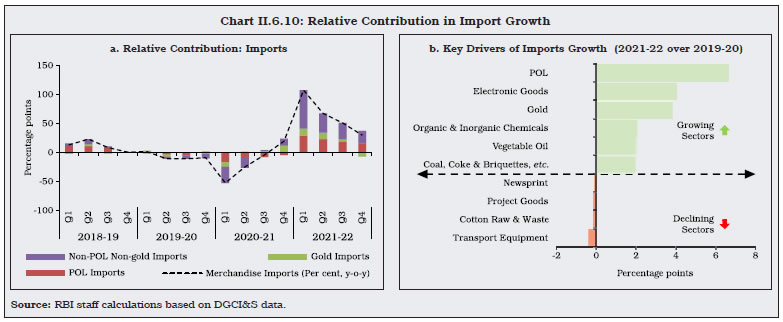 II.6.17 India’s gold imports at US$ 46.2 billion in 2021-22 exceeded the pre-COVID levels. In terms of volume, demand surged since July 2021 on the back of decline in COVID-19 cases, easing of restrictions following acceleration in vaccination drive and festival/wedding demand (Chart II.6.12). However, imports of gold fell amid rising global inflation concerns since January 2022. Gold prices fell short of only about 1 per cent in March 2022 to reach US$ 1,947.8 per troy ounce against a multi-year high of US$ 1,968.6 per troy ounce recorded in August 2020. II.6.18 India imports around 10 per cent of its total gold imports from the UAE, which is likely to increase in the wake of the successful implementation of a Free Trade Agreement (FTA).
II.6.19 Non-oil non-gold imports witnessed strong growth in 2021-22, expanding by 47.1 per cent on a y-o-y basis and by 28.0 per cent over pre-pandemic levels. Sectors such as electronic goods, vegetable oil, organic and inorganic chemicals and coal, coke and briquettes contributed to the growth in non-oil non-gold imports. II.6.20 India is the largest importer of vegetable oil. The import bill expanded from US$ 9.7 billion in 2019-20 to US$ 19.0 billion during 2021-22, reflecting a surge in import prices. Composition-wise, palm oil constitutes the major share, accounting for about 62.0 per cent of the total edible oil imports in India. International prices of palm oil remained high due to tight migrant labour conditions in major palm oil suppliers like Malaysia34 and increased export levy on palm oil in Indonesia.35 The Government of India rationalised import duty on edible oils, including palm oil, and imposed stock limits to avoid hoarding and to reduce the inflationary pressures.36 II.6.21 Pearls and precious stone imports, which had witnessed a revival at the end of 2020, strengthened further in 2021 on the back of strong export demand for the gems and jewellery sector during this period. The import of pearls and precious stones at US$ 31.0 billion expanded by 38.1 per cent during 2021-22 over pre-pandemic levels. Around two-thirds of this growth was driven by unworked non-industrial diamonds (the largest component with 60 per cent share). The UAE, the USA and Belgium remained the top import sources (Chart II.6.13a and II.6.13b). II.6.22 India’s fertiliser imports also registered an increase (89.7 per cent in value terms and 3.2 per cent in volume terms) during 2021-22 from pre-pandemic levels, reflecting the surge in global fertiliser prices. Global prices of urea, the major constituent of India’s fertiliser imports (with a 40.0 per cent share), witnessed the sharpest increase of 124.1 per cent during 2021-22, on a y-o-y basis. II.6.23 Capital goods imports, contributing more than one-fourth of India’s total imports, expanded by 15.6 per cent during 2021-22 compared to pre-pandemic levels, reflecting a surge in investment demand. Electronic goods were the largest contributor (Chart II.6.14). II.6.24 Reflecting the developments, India’s trade deficit expanded to US$ 190.1 billion in 2021-22 from US$ 161.4 billion during 2019-20, with oil deficit accounting for half of the total deficit (Chart II.6.15a). On a bilateral basis, the deficit with China widened while the trade surplus with the USA and Bangladesh expanded significantly (Chart II.6.15b). 4. Invisibles II.6.25 Net receipts from invisibles, reflecting cross-border transactions of services, income and transfers, displayed resilience during April-December 2021-22 (Chart II.6.16). While demand for software services exports surged sequentially since Q2:2020-21, remittances receipts also remained strong. Further, the net outgo on primary income account increased marginally following a rise in net investment income outflows. II.6.26 Alongside the recovery in global trade in services (Chart II.6.17), services exports remained resilient during 2021-22, primarily on the back of surging software exports, followed by transportation and business services. II.6.27 Software services account for more than 40 per cent of India’s total services exports. Travel and transportation services, which were hit hard by the pandemic, showed a weak recovery (Charts II.6.18a and II.6.18b). II.6.28 Remittances to India fully recovered to pre-pandemic levels by H1:2021-22 (Chart II.6.19a). To facilitate cheaper cross-border payments, in September 2021, the Reserve Bank and the Monetary Authority of Singapore announced a project to link their fast payment systems, viz., Unified Payments Interface and PayNow. The World Bank estimates that the average cost of sending remittances of US$ 200 to India declined from 5.51 per cent in Q4:2020 (highest since Q1:2019) to 4.94 per cent in Q4:2021. India remained the top recipient of global remittances during the year (Chart II.6.19b).
II.6.29 Under the income account, both receipts and payments relating to income on cross-border investments and compensation of employees that domestic resident entities earn from (or pay to) the rest of the world were higher than a year ago. II.6.30 Led by recovery in domestic demand and rise in international crude oil prices, India’s current account balance recorded a deficit of 1.2 per cent of GDP in April-December 2021 as against a surplus of 1.7 per cent a year ago (Chart II.6.20a). Intra-year, a surplus of 0.9 per cent of GDP in Q1:2021-22 was followed by deficits in Q2 and Q3:2021-22. Negative net terms of trade owing to upsurge in crude oil prices and the consequent widening of trade deficit mainly contributed to the current account deficit in April-December 2021-22 (Chart II.6.20b).
II.6.31 The upsurge in global inflation, driven by sharp rise in crude oil prices and supply chain disruptions, has emerged as a major policy challenge for most economies, including India, leading to potential erosion of external competitiveness via real appreciation of local currencies. 5. External Financing II.6.32 In 2021-22, India’s external financing needs were modest, given the moderate level of the current account deficit. Among the major components of financial flows, net FDI remained robust, while foreign portfolio investment (FPI) witnessed significant volatility during the year. Moreover, loans in the form of external commercial borrowings (ECBs), trade credit and banking capital recorded net inflows. Amid robust net capital inflows, there was an accretion of US$ 63.5 billion to the foreign exchange reserves on a balance of payment (BoP) basis (excluding valuation changes) in April-December 2021 [Chart II.6.21 and Appendix Table 8]. II.6.33 capital flows were dominated by FDI during 2021-22, albeit with a rise in outward FDI during the period (Table II.6.2). During the year, policy norms for FDI in select sectors, including pension fund management companies, oil and gas PSUs and telecom services, were further eased. While gross inward FDI at US$ 83.6 billion in 2021-22 was comparable to its level a year ago, net FDI (i.e., net inward minus net outward) at US$ 39.3 billion moderated from US$ 44.0 billion a year ago. The top FDI investor countries were Singapore, the US, Mauritius, the Netherlands, and Switzerland, contributing 76 per cent of the total FDI equity during the period (Chart II.6.22). Sector-wise, the services sector, including computer services, communication services and financial services, accounted for a major share of FDI equity in India during 2021-22, followed by the manufacturing sector, retail and wholesale trade, education, and R&D (Appendix Table 9). 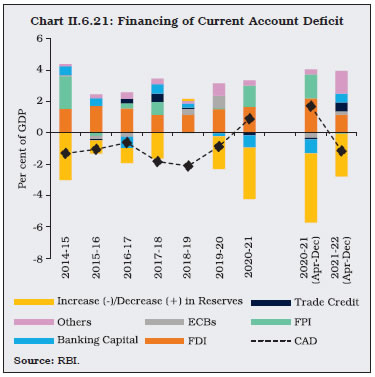
| Table II.6.2: Foreign Direct Investment Inflows | | (US$ billion) | | | 2018-19 | 2019-20 | 2020-21 | 2021-22 | | 1 | 2 | 3 | 4 | 5 | | 1. Net FDI (1.1 - 1.2) | 30.7 | 43.0 | 44.0 | 39.3 | | 1.1 Net Inward FDI (1.1.1 - 1.1.2) | 43.3 | 56.0 | 54.9 | 55.0 | | 1.1.1 Gross Inflows | 62.0 | 74.4 | 82.0 | 83.6 | | 1.1.2 Repatriation/Disinvestment | 18.7 | 18.4 | 27.0 | 28.6 | | 1.2 Net Outward FDI | 12.6 | 13.0 | 11.0 | 15.7 | | Source: RBI. |
II.6.34 Higher outward FDI from India during the year was mainly towards destinations such as Singapore, the US, the UK, Mauritius, the Netherlands and the Philippines. Financial, insurance and business services, manufacturing, wholesale and retail trade, and restaurants and hotels were the major sectors attracting India’s overseas direct investment during the year. II.6.35 In contrast to FDI flows, net foreign portfolio investment (FPI) flows ebbed after record net inflows in 2020-21. After making net purchases during H1:2021-22, FPIs withdrew in H2, primarily from the equity segment (Chart II.6.23). II.6.36 In terms of the investment route of FPIs in the equity market, the stock exchange channel recorded a significant decline during 2021-22. However, FPIs maintained their investment interest in the primary market segment (Chart II.6.24). In fact, a large chunk of flows was diverted by FPIs from secondary to primary market during November-December period when big ticket initial public offering (IPO) issues hit the capital market. FPIs were allowed to acquire debt securities issued by infrastructure investment trusts (InvITs) and real estate investment trusts (REITs) under the Medium-Term Framework (MTF) or the Voluntary Retention Route (VRR). 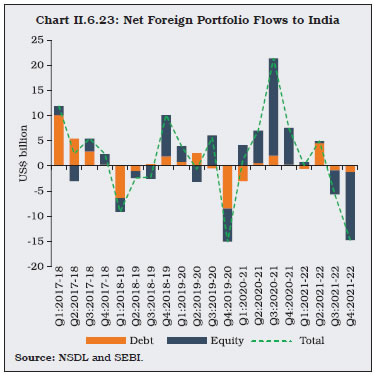 II.6.37 Around 74 per cent of the FPI inflows in the equity market was recorded in top five sectors, viz., oil and gas (22.3 per cent), software and services (21.4 per cent), utilities (16.2 per cent), metals and mining (8.2 per cent) and telecom services (5.5 per cent) [Chart II.6.25]. Notwithstanding the modest level of net purchases by FPIs in the debt market during the year, investment limits (general route) remained underutilised. As on March 31, 2022, only 26.3 per cent of the limits in central government securities were utilised (33.7 per cent as at end-March 2021), while the utilisation rate for SDLs remained abysmally low at one per cent. In contrast, given the positive response under the VRR, the investment limit for the same was raised by ₹1,00,000 crore to ₹2,50,000 crore with effect from April 1, 2022. Of the total value of specified categories of central government securities opened fully for non-resident investors without any restrictions under the Fully Accessible Route (FAR), 2.6 per cent was held by FPIs as on March 31, 2022. In the corporate bond segment, FPIs’ interest remained subdued, inter alia, due to credit rating downgrades of companies and rise in yield rates in the US. Only around 20.0 per cent of the limit for FPIs in corporate bonds (in absolute terms) was utilised as on March 31, 2022, down from 24.5 per cent as at end-March 2021. 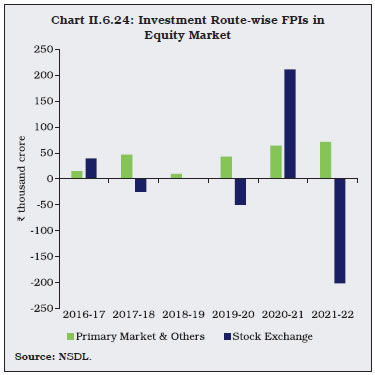
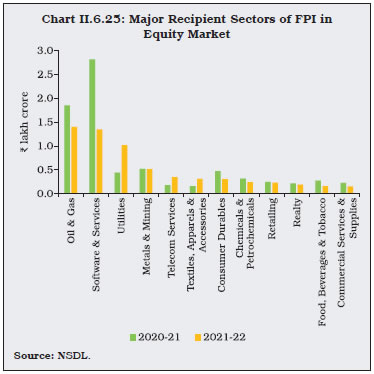
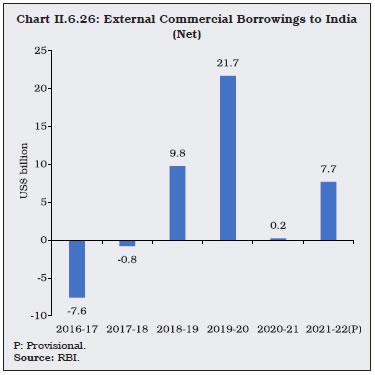 II.6.38 ECBs recorded a rise, both in terms of the number of ECB agreements and the agreement amount, during 2021-22 (Chart II.6.26). In terms of policy measures, a relaxation for parking of unutilised ECB proceeds in term deposits was extended till March 1, 2022. Further, in view of the discontinuation of LIBOR and to take into account differences in credit risk and term premia between LIBOR and the alternative reference rates (ARRs), the all-in-cost ceiling for new foreign currency overseas borrowings and trade credit transactions was increased by 50 bps to 500 bps and 300 bps, respectively, over the benchmark rates. II.6.39 Besides repayment of earlier borrowings, disbursements were largely used for on-lending/sub-lending, refinancing of earlier ECBs, refinancing of rupee loans, working capital requirements, new projects and infrastructure development (Chart II.6.27). Within ECBs, rupee denominated loans and rupee denominated bonds (RDBs) accounted for 8.4 per cent of the total agreement amount during 2021-22 as compared with 6.0 per cent a year ago. Furthermore, the share of hedged foreign exchange loans stood at 51.6 per cent during the year, marginally higher than 51.3 per cent during 2020-21. II.6.40 Short-term trade credit also increased during the year in line with the recovery in imports. The net inflow of short-term credit stood at US$ 13.3 billion in April-December 2021-22 as against a net outflow of US$ 1.8 billion a year ago. Around 35 per cent of the trade credit was raised for imports of crude oil, gold, coal and copper. II.6.41 Non-Resident (External) Rupee (NRE) deposits, which constituted around 72 per cent of total outstanding Non-Resident Indian (NRI) deposits, witnessed net inflows of US$ 3.3 billion during 2021-22, much lower than US$ 8.8 billion a year ago (Table II.6.3). Redemptions from FCNR(B) accounts and sharp fall in NRE deposits contributed to lower net accretions in non-resident deposits. Sizeable redemptions were reported in deposits held by non-residents from the UAE, the US and the UK. | Table II.6.3: Flows under Non-Resident Deposit Accounts | | (US$ billion) | | | 2018-19 | 2019-20 | 2020-21 | 2021-22 | | 1 | 2 | 3 | 4 | 5 | | 1. Non-Resident External (Rupee) Account | 7.3 | 5.6 | 8.8 | 3.3 | | 2. Non-Resident Ordinary Account | 1.9 | 2.0 | 2.3 | 3.5 | | 3. Foreign Currency Non-Resident(B) Account | 1.1 | 1.1 | -3.8 | -3.6 | | Non-Resident Deposits (1+2+3) | 10.4 | 8.6 | 7.4 | 3.2 | | Source: RBI. | 6. Vulnerability Indicators II.6.42 India’s external debt (as a ratio to GDP) remained lower than most emerging market peers. Mainly led by general special drawing right (SDR) allocations by the IMF in August 2021, external debt recorded an increase of US$ 41.2 billion (i.e., 7.2 per cent) at end-December 2021 over end-March 2021; as a ratio to GDP, however, it moderated to 20.0 per cent from 21.2 per cent during the same period (Table II.6.4). Commercial borrowings remained the largest component of external debt, with a share of 36.8 per cent, followed by non-resident deposits (23.1 per cent) and short-term trade credit (18.0 per cent). The accretion to foreign exchange reserves induced an improvement in reserve adequacy indicators. This augurs well for mitigating external risks and spillovers. Foreign exchange reserves at end-March 2022 provided cover of 10 months of imports projected for 2022-23. | Table II.6.4: External Vulnerability Indicators (End-March) | | (Per cent, unless indicated otherwise) | | Indicator | 2013 | 2020 | 2021 | End-Dec 2021 | | 1 | 2 | 3 | 4 | 5 | | 1. External Debt to GDP Ratio | 22.4 | 20.9 | 21.2 | 20.0 | | 2. Ratio of Short-term Debt (Original Maturity) to Total Debt | 23.6 | 19.1 | 17.6 | 18.6 | | 3. Ratio of Short-term Debt (Residual Maturity) to Total Debt | 42.1 | 42.4 | 44.1 | 44.4 | | 4. Ratio of Concessional Debt to Total Debt | 11.1 | 8.8 | 9.0 | 8.2 | | 5. Ratio of Reserves to Total Debt | 71.3 | 85.6 | 100.6 | 103.0 | | 6. Ratio of Short-term Debt (Original Maturity) to Reserves | 33.1 | 22.4 | 17.5 | 18.1 | | 7. Ratio of Short-term Debt (Residual Maturity) to Reserves | 59.0 | 49.6 | 43.8 | 43.1 | | 8. Reserve Cover of Imports (in months)* | 7.0 | 12.0 | 17.4 | 13.1 | | 9. Debt Service Ratio (Debt Service to Current Receipts) | 5.9 | 6.5 | 8.2 | 4.9 | | 10. External Debt (US$ billion) | 409.4 | 558.3 | 573.7 | 614.9 | | 11. Net International Investment Position (NIIP) (US$ billion) | -326.7 | -375.4 | -355.3 | -357.9 | | 12. NIIP/GDP Ratio | -17.8 | -14.1 | -13.2 | -11.7 | | 13. CAB/GDP Ratio | -4.8 | -0.9 | 0.9 | -1.2 | *: Based on merchandise imports of latest four quarters, published in balance of payments statistics.
Note: CAB/GDP ratio in column 5 pertains to April-December 2021.
Source: RBI and Government of India. | II.6.43 India’s foreign exchange reserves at US$ 607.3 billion at end-March 2022 were bolstered by the IMF’s general SDR allocations of SDR 12.57 billion to India in August 2021. In 2021-22, India’s reserve accumulation (including valuation changes) was to the tune of US$ 30.3 billion. 7. Conclusion II.6.44 Going forward, the outlook for India’s external sector is beset with both headwinds and tailwinds. Under the latter, exports, which have shown resilience in a hostile trade environment, may derive further strength as external demand and price conditions turn favourable with the abatement of geopolitical tensions. Domestic policy measures are also primed to achieve the target set for the year. Downside risks emanate from likely slowing of growth in major AEs and EMEs, elevated energy prices and added supply-side disruptions in a conflict-ridden geopolitical environment. Faster monetary policy tightening in major economies on the back of high inflation in these economies can also impact financial conditions in emerging markets. Yet, external vulnerability indicators exhibit resilience and strengthening domestic macroeconomic fundamentals would help the economy withstand spillovers from potential global adverse macro-financial shocks.
|