In the face of heightened uncertainty, both domestic and global, the market borrowing programme of the centre and the states for 2019-20 was conducted by the Reserve Bank in pursuance of the objectives of cost minimisation, risk mitigation and market development. VII.1 The Internal Debt Management Department (IDMD) of the Reserve Bank is entrusted with managing the domestic debt of the central government vide Sections 20 and 21 of the RBI Act, 1934, and of 28 state governments and two Union Territories (UTs) in accordance with bilateral agreements as provided in Section 21A of the Act. Further, there is a provision for providing short-term credit up to three months to central government, state governments and UTs in the form of Ways and Means Advances (WMA) to bridge temporary mismatches in cash flows, as laid down in Section 17(5) of the RBI Act, 1934. VII.2 The rest of the chapter is arranged in three sections. The immediately following section presents the implementation status in respect of the agenda for 2019-20. Section 3 covers major initiatives to be undertaken in the agenda for 2020-21 on debt management for central and state governments. The chapter has been summarised at the end. 2. Agenda for 2019-20: Implementation Status Goals Set for 2019-20 VII.3 Last year, the Department had set out the following goals: -
Overall liquidity enhancement in Government of India (GoI) securities (G-sec) market by consolidation of debt through a calendar of auction based switches and buyback operations (Utkarsh) [Para VII.5 - VII.6]; -
Issuance of GoI benchmark securities of 2, 5, 7 and 10 year tenor (Para VII.7); -
Expansion of investor base by greater participation of multilateral financial institutions and multilateral development banks, apart from Foreign Central Banks (FCBs) in the G-sec market (Utkarsh) [Para VII.8]; -
Revision of retail and mid-segment turnover targets for Primary Dealers (PDs) (Para VII.9); -
Diversifying the investor base for State Development Loans (SDLs) [Para VII.10]; -
Exploration of various investment avenues for state governments (Para VII.11); -
Examination of the revision of the WMA limit for state governments (Para VII.12); -
Organising capacity building programmes to sensitise state governments about the prudent measures of cash and debt management (Para VII.13); and -
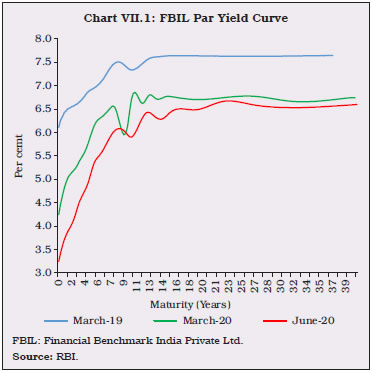
Improvement in information management system (Para VII.14). Implementation Status of Goals VII.4 During 2019-20, the market borrowing programme was conducted following the debt management strategy of minimising cost, risk mitigation and market development. Amidst heightened uncertainty characterising domestic and global economic and financial conditions, the Reserve Bank successfully managed the combined gross market borrowings of the central and the state governments, which increased by 28.1 per cent to ₹13,44,521 crore during the year. VII.5 The Reserve Bank continued its policy of passive consolidation by way of reissuances and active consolidation through buyback/switches. During 2019-20, 185 out of 194 issuances of G-sec were re-issuances as compared with 206 re-issuances out of 212 issuances in the previous year. VII.6 Switch auction for conversion of G-sec is generally conducted on every third Monday of the month, for which a specific press release, indicating the securities to be switched, is announced before the switch auction date. Accordingly, switch operations of G-sec amounting to ₹1,64,803 crore were completed during 2019-20 as against ₹28,059 crore in the previous year. Like last year, the budget for buyback operations was kept zero for the year. VII.7 Following the discontinuation of old 2-year and 5-year G-sec, issuance of new G-sec in these maturities was undertaken, including a new 7-year security (7.27% GS 2026). Floating Rate Bonds (FRBs) were also issued during the year in order to broaden the investor base. The share of FRBs in total issuances during 2019-20 was 8.5 per cent, lower than 9.1 per cent in the previous year. VII.8 Under the Foreign Central Bank (FCB) scheme, the Department invests in Indian G-sec on behalf of select FCBs and multilateral development institutions in the secondary market. In consultation with the central government, the scheme has been extended to multilateral financial institutions and multilateral development banks. Further, Treasury Bills (T-Bills) were also included as eligible instruments under the scheme. Total volumes (purchase and sell) transacted on behalf of FCBs stood at ₹4,500 crore (face value) during 2019-20, up from ₹1,297 crore in the previous year. During 2019-20, 180 Gilt Account Holders (GAHs) accessed the NDS-OM-Web and undertook 93,697 trades worth ₹11.54 lakh crore as compared with 72,229 trades worth ₹6.97 lakh crore in the previous year. VII.9 The guidelines for PDs are under review to, inter alia, achieve the objectives of Market Making Scheme and to ensure better retailing of G-sec by PDs. VII.10 Various measures have been taken to diversify the investor base for SDLs. Among them are steps taken to encourage participation of retail investors in SDL market, including introduction of non-competitive bidding in primary auctions. In this direction, Specified Stock Exchanges (besides scheduled banks and primary dealers) have been permitted to act as Aggregators/Facilitators to consolidate the bids of their stockbrokers/other retail participants and submit a single bid under the non-competitive segment of the primary auction of the SDLs, following an announcement through circular dated November 7, 2019. A stripping/reconstitution facility for SDLs, similar to the one for central government securities was announced in the Reserve Bank’s Statement on Developmental and Regulatory Policies of August 7, 2019. This measure will be implemented in consultation with the state governments. VII.11 A proposal to explore various investment avenues for state governments including the review of the Consolidated Sinking Fund (CSF) / Guarantee Redemption Fund (GRF) scheme is in progress. In this regard, a Discussion Paper has already been submitted to the Executive Committee (EC) to State Finance Secretaries (SFS). VII.12 In 2016, the Advisory Committee on WMA scheme for state governments (Chairman: Shri Sumit Bose) had recommended that the WMA limits be revised to ₹32,225 crore for all states/ UTs together and Committee-based next revision of WMA may be effected in 2020-21, taking into account the roadmap laid by the Report of the Fifteenth Finance Commision. Currently, a new Committee (Chairman: Shri Sudhir Shrivastava) is examining these limits. The Committee is yet to submit its report to the Reserve Bank. VII.13 Capacity building programmes for sensitising state governments about the prudent measures of cash and debt management were conducted in five states (viz., Rajasthan, Bihar, Assam, Karnataka and Odisha). Meetings between states and investors were also facilitated during the year. VII.14 In order to improve data dissemination, dashboards were created and made available to the public through Database on Indian Economy (DBIE). It provides current information related to auctions, gross and net market borrowings of the central and state governments and secondary market yield movements. Debt Management of the Central Government VII.15 During 2019-20, the gross market borrowings through dated G-sec were higher by 24.3 per cent than a year ago. Net market borrowing through dated G-sec also increased by 12.1 per cent on account of higher borrowings during the year. Net market borrowing through dated G-sec financed 61.8 per cent of the centre’s gross fiscal deficit (GFD) as against 65.1 per cent in the previous year. The net market borrowing through dated securities and T-Bills taken together also increased in 2019-20 (Table VII.1). Debt Management Operations VII.16 The weighted average yield (WAY) on GoI dated securities issued during 2019-20 declined by 93 basis points (bps) on a year-on-year basis. The weighted average coupon on dated securities on the entire debt stock also decreased albeit marginally. Consequent upon the decision by the GoI to undertake more borrowings in the maturity bucket of over 15 years, the weighted average maturity (WAM) of issuances increased during 2019-20, resulting in a marginal increase in WAM on the outstanding debt (Table VII.2). VII.17 During 2019-20, G-sec yields softened considerably with 10-year benchmark yield moderating by 121 basis points (bps) from 7.35 per cent to 6.14 per cent, attributed to cumulative reduction in repo rate by 185 bps during the year, coupled with accommodative policy stance and OMO purchases. A new 10-year G-sec paper (6.45% GS 2029) was also issued on October 7, 2019 with a coupon considerably lower than that of the previous issuance (7.26% GS 2029 issued on January 8, 2019). Further, the Reserve Bank announced various other monetary easing measures which impacted the yield curve. Specifically, special OMOs of ₹40,000 crore were conducted in December 2019 and January 2020, wherein the Reserve Bank bought long-term securities and sold short-term securities simultaneously. The Reserve Bank also conducted Long Term Repo Operations (LTROs) for 1-year and 3-year tenors at policy repo rate for ₹1,25,000 crore in February and March 2020 to provide durable liquidity to the system at reasonable cost. Since the credit offtake in the system remains muted, the LTROs resulted in significant softening in G-sec yields for short-tenor papers. These developments led to increase in spreads between short-term and long-term G-sec yields, steepening the yield curve towards the end of March 2020. A downward kink was observed in the G-sec yield curve around the 10-year tenor, partly explained by the high liquidity premium in the 10-year benchmark paper and also on account of the special OMOs conducted by the Reserve Bank, which brought down yields of the 10-year paper more than the adjacent tenors. The yield curve remained flat beyond 14-year G-sec papers and took a roughly parallel shift downward relative to the previous year (Chart VII.1). | Table VII.1 : Net Market Borrowings of the Central Government | | (Amount in ₹ crore) | | Item | 2017-18 | 2018-19 | 2019-20 | 2020-21* | | 1 | 2 | 3 | 4 | 5 | | Net Borrowing (i to iv) | 4,98,891 | 4,58,337 | 5,11,500 | 5,58,381 | | (i) Dated Securities@ | 4,48,410 | 4,22,737 | 4,73,972 | 2,15,428 | | (ii) 91-day T-Bills | 31,886 | -46,542 | -9,600 | 1,17,013 | | (iii) 182-day T-Bills | 1,436 | 32,931 | 38,354 | 1,23,480 | | (iv) 364-day T-Bills | 17,159 | 49,211 | 8,774 | 1,02,460 | *: Up to June 30, 2020.
@: Without adjusting for buyback and switches. After adjusting for buyback and switches, net borrowings through dated securities during 2019-20 stood at ₹ 4,73,990 crore as against ₹4,23,269 crore in 2018-19.
Source: RBI. |
| Table VII.2: Market Loans of Central Government - A Profile* | | (Yield in per cent/Maturity in years) | | Years | Range of YTMs in Primary Issues | Issued during the Year | Outstanding Stock | | Under 5 years | 5-10 years | Over 10 years | Weighted Average Yield | Range of Maturities @ | Weighted Average Maturity | Weighted Average Maturity | Weighted Average Coupon | | 1 | 2 | 3 | 4 | 5 | 6 | 7 | 8 | 9 | | 2014-15 | - | 7.66-9.28 | 7.65-9.42 | 8.51 | 6-30 | 14.66 | 10.23 | 8.08 | | 2015-16 | - | 7.54-8.10 | 7.59-8.27 | 7.89 | 6-40 | 16.03 | 10.50 | 8.08 | | 2016-17 | 6.85-7.46 | 6.13-7.61 | 6.46-7.87 | 7.16 | 5-38 | 14.76 | 10.65 | 7.99 | | 2017-18 | 7.23-7.27 | 6.42-7.48 | 6.68-7.67 | 6.97 | 5-38 | 14.13 | 10.62 | 7.76 | | 2018-19 | 6.56-8.12 | 6.84-8.28 | 7.26-8.41 | 7.78 | 1-37 | 14.73 | 10.40 | 7.81 | | 2019-20 | 5.56-7.38 | 6.18-7.44 | 5.96-7.77 | 6.85 | 1-40 | 16.15 | 10.72 | 7.71 | | 2020-21** | 4.04-5.55 | 5.22-6.52 | 4.65-7.19 | 5.87 | 2-40 | 14.61 | 11.02 | 7.59 | YTM: Yield to Maturity. -: Not applicable. @: Residual maturity of issuances and figures are rounded off.
*: Excluding special securities and buyback/switch in GoI securities. **: Up to June 30, 2020.
Source: RBI. |
 VII.18 During 2019-20, about 54.2 per cent of the market borrowing were raised through issuance of dated securities with a residual maturity of 10 years and above, as compared with 53.5 per cent in the previous year, resulting in a marginal decrease in the share of securities with maturity less than 10 years during the year. Further, 30-year and 40-year tenor papers were issued/reissued during the year with the objective of catering to the demand for long-term investors such as insurance companies and pension funds (Table VII.3). Issuance of Special GoI Securities VII.19 Special GoI securties (non-transferable) for the purpose of recapitalisation were issued to 13 public sector banks (PSBs), EXIM Bank, IDBI Bank and Indian Infrastructure Finance Company Ltd. (IIFCL) for a total amount of ₹75,847.60 crore in 7 tranches on a cash-neutral basis. Coupons on those securities ranged between 6.13 - 6.79 per cent. Treasury Bills VII.20 Short-term cash requirements of the government are met through issuance of T-Bills. The net short-term market borrowing of the government through T-Bills (91, 182 and 364 days) marginally increased to ₹37,528 crore during 2019-20 as against ₹35,600 crore in the previous year. Ownership of Securities VII.21 Commercial banks and cooperative banks taken together remained the largest holders of G-sec accounting for 41.9 per cent as at end-March 2020, followed by insurance companies (26.2 per cent) and provident funds (10 per cent). The share of the Reserve Bank was 9.5 per cent and the share of FPIs was 1.5 per cent. The other holders of G-sec are pension funds, mutual funds, state governments, financial institutions (FIs) and corporates. Primary Dealers and Devolvement VII.22 The number of primary dealers (PDs) stood at 21 [14 Bank-PDs and 7 Standalone PDs (SPDs)] at end-March 2020. All the PDs maintained capital to risk-weighted assets ratio (CRAR) above the minimum requirement of 15 per cent during the year. The mandate of underwriting primary auctions of dated G-sec has been given to PDs with a target of achieving bidding commitment/success ratio in respect of Treasury Bills (T-Bills)/cash management bills (CMBs). The PDs individually achieved the stipulated minimum success ratio of 40 per cent, with an average of 62.78 per cent in H1: 2019-20 and 60.62 per cent in H2. The share of PDs in auctions of T-Bills/ CMBs was 71.67 per cent during 2019-20 as compared with 71.44 per cent in the previous year. The underwriting commission paid to PDs during 2019-20 was ₹41.04 crore as compared with ₹139.86 crore in the previous year, reflecting reduced domestic market volatility relative to previous year. | Table VII.3: Issuance of Government of India Dated Securities – Maturity Pattern | | (Amount in ₹ crore) | | Residual Maturity | 2018-19 | 2019-20 | 2020-21* | | Amount Raised | Percentage to Total | Amount Raised | Percentage to Total | Amount Raised | Percentage to Total | | 1 | 2 | 3 | 4 | 5 | 6 | 7 | | Less than 5 Years | 1,08,899 | 19.1 | 1,46,000 | 20.6 | 86,000 | 24.9 | | 5 -9.99 Years | 1,57,000 | 27.5 | 1,79,000 | 25.2 | 89,000 | 25.7 | | 10-14.99 Years | 98,000 | 17.2 | 1,37,000 | 19.3 | 93,000 | 26.9 | | 15 -19.99 Years | 71,101 | 12.5 | 15,000 | 2.1 | - | - | | 20 Years & Above | 1,36,000 | 23.8 | 2,33,000 | 32.8 | 78,000 | 22.5 | | Total | 5,71,000 | 100.0 | 7,10,000 | 100.0 | 3,46,000 | 100.0 | *: Up to June 30, 2020. -: Nil.
Note: Figures in the columns might not add up to the total due to rounding off of numbers.
Source: RBI. | Sovereign Gold Bonds Scheme VII.23 In consultation with the Government of India, the Reserve Bank issued 10 tranches of Sovereign Gold Bonds (SGBs) for an aggregate amount of ₹2,316.37 crore (6.13 tonnes) during 2019-20. Under the SGB scheme, bonds are denominated in units of one gram of gold and multiples thereof. The minimum annual investment is one gram with a maximum limit of 4 kg per individual, 4 kg per Hindu Undivided Family (HUF) and 20 kg for trusts and similar entities notified by the government from time to time. A total of ₹9,652.78 crore (30.98 tonnes) has been raised through the scheme (37 tranches) since its inception in November 2015. Cash Management of the Central Government VII.24 The central government started the year 2019-20 with a cash balance of ₹1,27,693 crore. The WMA limits for the first and second half of the year were ₹75,000 crore and ₹35,000 crore, respectively. The central government resorted to WMA for 189 days during 2019-20 vis-à-vis 173 days in the previous year and went into overdraft (OD) for 52 days vis-à-vis 50 days during the same period. The highest amount of WMA/OD resorted to was ₹1,33,188 crore on January 4, 2020. The central government issued CMBs of ₹3,00,000 crore, with tenors ranging between 10 to 84 days to tide over short-term mismatches in cash flows during 2019-20. The year ended with central government’s cash balance at ₹ 55,573 crore (Chart VII.2). Debt Management of State Governments VII.25 Following the recommendation of the 14th Finance Commission (FC) to exclude states from the National Small Savings Fund (NSSF) financing facility (barring Delhi, Madhya Pradesh, Kerala and Arunachal Pradesh), market borrowings of states have been increasing over the last few years. The share of market borrowing in financing GFD consequently rose to 87.9 per cent in 2019-20 (BE) from 84.0 per cent in 2017-18. VII.26 Both gross and net market borrowing of states were higher during 2019-20 than a year ago. Gross market borrowing increased by 32.7 per cent, while the net borrowing increased by 39.8 per cent, reflecting lower growth (y-o-y) in redemptions during the year (Table VII.4). There were 636 issuances in 2019-20, of which 114 were re-issuances (467 issuances in 2018-19, of which 59 were re-issuances), reflecting the efforts of state governments towards debt consolidation. | Table VII.4: Market Borrowing of States through SDLs | | (Amount in ₹ crore) | | Item | 2017-18 | 2018-19 | 2019-20 | 2020-21* | | 1 | 2 | 3 | 4 | 5 | | Maturities during the Year | 78,819 | 1,29,680 | 1,47,067 | 28,167 | | Gross Sanction under Article 293(3) | 4,82,475 | 5,50,071 | 7,12,744 | 5,11,189 | | Gross Amount Raised during the Year | 4,19,100 | 4,78,323 | 6,34,521 | 1,67,276 | | Net Amount Raised during the Year | 3,40,281 | 3,48,643 | 4,87,454 | 1,39,109 | | Amount Raised during the Year to Total Sanctions (per cent) | 86.9 | 87.0 | 89.0 | 32.7 | | Outstanding Liabilities (at the end of period) # | 24,29,892 | 27,78,536 | 32,65,989 | 33,93,098 | *: As on June 30, 2020. #: Including UDAY and other special securities.
Source: RBI. | VII.27 The weighted average yield (WAY) of cut-off yield for State Development Loans (SDLs) issued during 2019-20 was lower at 7.24 per cent than 8.32 per cent in the previous year. Accordingly, the weighted average spread (WAS) of SDL issuances over comparable central government securities was 55.02 bps in 2019-20 as compared with 64.66 bps in the previous year. In 2019-20, seventeen states and one union territory issued non-standard securities of tenors ranging from 2 to 40 years. As a strategic response to higher spreads, 9 states rejected all the bids in some of the auctions. Following the policy of passive consolidation, 11 states (viz., Bihar, Gujarat, Haryana, Himachal Pradesh, Karnataka, Madhya Pradesh, Maharashtra, Punjab, Rajasthan, Tamil Nadu and Telangana) undertook re-issuances during 2019-20, which helped in creating liquidity for their securities in the secondary market. The average inter-state yield spread on 10 year fresh issuance was 6 bps in 2019-20, the same as observed in 2018-19, reflecting their continued disconnect from the fiscal health of issuing states. Cash Management of State Governments VII.28 Following the recommendations of the Advisory Committee on WMA scheme for state governments (Chairman: Shri Sumit Bose), the WMA limit was set at ₹32,225 crore for all states/ UTs together until the next review in 2020-21. Currently, a new Committee (Chairman: Shri Sudhir Shrivastava) is reviewing these limits. Pending its recommendations, it was decided on April 1, 2020 to increase the WMA limit by 30 per cent from its existing level to enable states/ UTs to tide over COVID-19. On April 17, 2020, the Reserve Bank decided to further increase the WMA limit by 60 per cent over and above the level as on March 31, 2020. This interim measure will remain valid till September 30, 2020. Relaxation in the overdraft (OD) scheme has been given to state governments/UTs to tide over mismatches in cash flows by increasing the number of days for OD, effective April 7, 2020, till September 30, 2020. Sixteen states availed the Special Drawing Facility (SDF) in 2019-20. Thirteen states resorted to WMA and ten states availed OD. VII.29 Over the years, states have been accumulating a sizeable cash surplus in the form of intermediate treasury bills (ITBs) and auction treasury bills (ATBs), which, however, entail a negative carry cost, i.e., there is a negative spread of 524 bps as at end-March 2020 between the average borrowing cost of states (7.24 per cent) and the average rate of return on ATBs/ ITBs (2 per cent). The outstanding investment of states in ITBs was ₹1,54,757 crore at end-March 2020, while outstanding investment in ATBs was ₹33,504 crore (Table VII.5). Investments in Consolidated Sinking Fund/ Guarantee Redemption Fund VII.30 The Reserve Bank manages two reserve fund schemes on behalf of state governments (SGs) – the Consolidated Sinking Fund (CSF) and the Guarantee Redemption Fund (GRF) [Box VII.1]. These reserve funds are built up from the contributions made by the SGs voluntarily and are being managed as per the schemes notified by SGs. CSF is an amortisation fund and was introduced in 1999 to meet repayment obligations of the SGs. After a 5-year lock-in period, states are eligible to withdraw the interest accrued and accumulated up to the close of previous financial year (FY). A working group in 2012 recommended to build up a minimum corpus of 3 to 5 per cent of state liabilities within next 5 years. So far, 24 states and one union territory, i.e., Puducherry have set up CSF. GRF is constituted by SGs for meeting their obligations arising out of the guarantees issued on behalf of state level entities. The Reserve Bank circulated the scheme of GRF to the SGs in August 2001 for voluntary adoption and it envisaged an initial contribution of at least 1.0 per cent of outstanding guarantees at the end of the previous year and thereafter minimum 0.5 per cent every year to achieve a minimum level of 3 per cent in next five years. Accretions in the Fund can be utilised only towards payment of guarantees issued by the SGs and invoked by the beneficiary. Presently, 18 states are members of the GRF. States can also avail a special drawing facility (SDF) at a discounted rate from the Reserve Bank against their incremental annual investment in CSF and GRF. Outstanding investment by states in the CSF and GRF at end-March 2020 was ₹1,30,431 crore and ₹7,486 crore, respectively, as against ₹1,14,701 crore and ₹6,513.73 crore at end-March 2019. Total investment in CSF/GRF was ₹23,464 crore in 2019-20. Total disinvestment by states from CSF and GRF was ₹47.40 crore during 2019-20. | Table VII.5: Investment in ITBs and ATBs by State Governments/UT | | (Amount in ₹ crore) | | Item | Outstanding as on March 31 | | 2016-17 | 2017-18 | 2018-19 | 2019-20 | 2020-21* | | 1 | 2 | 3 | 4 | 5 | 6 | | 14-Day ITBs | 1,56,050 | 1,50,871 | 1,22,084 | 1,54,757 | 1,47,243 | | ATBs | 36,603 | 62,108 | 73,927 | 33,504 | 38,297 | | Total | 1,92,653 | 2,12,979 | 1,96,011 | 1,88,261 | 1,85,540 | *: As on June 30, 2020.
Source: RBI. |
Box VII.1
Consolidated Sinking Fund (CSF) and Guarantee Redemption Fund (GRF)
Schemes of States: Relevance in Current Scenario Sinking funds represent an alternative to manage refinancing risk by setting aside money over and above those required for debt service payments and these are invested in sovereign securities. IMF recommends such schemes to manage refinancing risk of sovereigns (Jonasson and Papaioannou, 2018). Debt managers across the world also manage the risk through various methods including setting up of sinking funds. Even though CSF/GRF schemes of states in India cannot be strictly compared with sinking funds of other countries, it does have similarity in that these are ultimately reserve funds which can be relied upon in case of an exigency. Countries like South Africa, Turkey, Denmark and Spain manage the exposure of debt stock by forming a natural hedge called ‘Liquidity Buffer’. Liquidity buffers have proved to be effective in mitigating risk relating to public debt. In order to cover expected loss of the treasury guarantees, a risk account was established in 2003 at the central bank of the Republic of Turkey. The revenues of the account consist of guarantee/on-lent fees, interest income and repayments by beneficiary institutions related to undertaken loans. In Denmark, a level of cash reserves is maintained to service one year of debt repayments (Koc, 2014). In India, over the years, the aggregate investment in both the funds have been showing an increasing trend. As at end-March 2020, CSF constituted 2.6 per cent of the previous year’s outstanding liabilities and GRF constituted 1.7 per cent of outstanding guarantees of states. Only 8 states maintain CSF to the desirable level of above 5 per cent of their outstanding liabilities and 11 states maintain GRF above 5 per cent of their outstanding guarantees. Yearly utilisation of these funds by states, vis-à-vis balances during last few years are given in Table 1. Measures Undertaken by the Reserve Bank to Make CSF/ GRF Attractive - Following the recommendation made by the Advisory Committee on WMA (2016) [Chairman: Shri Sumit Bose], incremental investment in CSF/GRF is allowed for availing SDF without any limit (i.e., not limited to WMA limit).
| Table 1: Utilisation of CSF and GRF by States/UT | | (Amount in ₹ crore) | | Year | Outstanding Balances at end-March | Withdrawal during the Year | | 1 | 2 | 3 | | | CSF | GRF | CSF | GRF | | 2017-18 | 99,271 | 5,439 | 427 | - | | 2018-19 | 1,14,701 | 6,514 | 1,201 | 21 | | 2019-20 | 1,30,431 | 7,486 | 47 | - | | 2020-21* | 1,31,356 | 7,595 | 1,750 | - | -: Nil. *As on June 30, 2020.
Source: RBI. | -
Reserve Bank lowered the rate of interest on SDF availed against the incremental investment in CSF/GRF, from 100 bps below the repo rate to 200 bps below the repo rate in June 2018 to incentivise maintenance of these funds by the SGs. -
In light of the financial stress caused to SGs due to the COVID-19 pandemic, as an interim measure, it was decided on May 22, 2020 to liberalise the withdrawal norms of the CSF scheme. As against the extant rule of limiting withdrawal to accrued interest, under the relaxed norms, states are permitted to withdraw up to 75 per cent of their total balance in CSF outstanding as on March 31, 2020, with the quantum of withdrawal restricted to the redemption due towards market borrowing in the current financial year 2020-21. This relaxation would make available an additional sum of about ₹13,300 crore with the SGs for meeting their redemption requirements during 2020-21. Together with the normally permissible limit, this additional amount will cover about 45 per cent of their redemptions for 2020-21. Eleven states would be able to cover 100 per cent of their redemption in 2020-21 as per the relaxed guidelines as against 6 states as per the extant rules. State governments will continue to retain a sizeable corpus in their CSF even after utilising this additional amount released for withdrawal. Buffer funds like CSF/GRF increases investor confidence in state’s issuances which may, in turn, have a positive impact on the borrowing cost of the SGs. In times of economic stress, states can drawdown from CSF which, in turn, may reduce the need for further borrowings for repayments of earlier borrowings. Any default on state government’s borrowing/liability could have adverse market impact, and reserve funds like CSF and GRF can provide a cushion in times of stress. The importance of these two reserve funds in the current situation of COVID-19 cannot be over-emphasised when states/UT are facing difficulties with their finances. However, there are some drawbacks in keeping such reserve funds. If these funds are built up from borrowed funds, maintaining reserve funds will increase states’ borrowings to that extent. Currently investments under the CSF scheme are made primarily in central government securities (more than 95 per cent) with remaining in SDLs of other states. Since, central government yields are less compared to SDL yields of comparable tenor, there is a negative carry on these investments. Further, the fund in CSF cannot be utilised before the lock-in period of 5 years. However, experience suggests that advantages of maintaining such buffer funds outweigh the disadvantages. Reference: -
Jonasson, Thordur and Papaioannou, Michael (2018), ‘A Primer on Managing Sovereign Debt-Portfolio Risks’, IMF Working Paper No. WP/18/74, April. -
Koc, Fatos (2014), ‘Sovereign Asset and Liability Management Framework for DMOs: What Do Country Experiences Suggest’, United Nations Conference on Trade and Development (UNCTAD), January. | 3. Agenda for 2020-21 VII.31 The Union Budget 2020-21 projects gross market borrowing through dated securities at ₹7,80,000 crore (3.5 per cent of GDP), higher by about 9.9 per cent than ₹7,10,000 crore in 2019-20. Net market borrowing [including short-term debt and repayment of Post Office Life Insurance Fund (POLIF)] is budgeted at ₹5,35,870 crore, financing 67.3 per cent of the GFD in 2020-21 [65.1 per cent in 2019-20 (RE)]. After reviewing the cash position and requirements of the central government, the Government of India (GoI) in consultation with the Reserve Bank of India, decided to modify the indicative calendar for issuance of G-sec for the remaining part of the first half of the fiscal 2020-21 (May 11-September 30, 2020) and revised the gross market borrowings to ₹12 lakh crore for the full year 2020-21. Further, in order to provide additional resources to the states in view of COVID-19, the borrowing limits of the state governments has also been increased from the existing 3 per cent to 5 per cent of GSDP, subject to conditions. VII.32 Given these requirements, the market borrowing programme is proposed to be conducted with the following strategic milestones so as to achieve the overall goals of debt management set out in the beginning of this chapter: -
Introduction of separate trading of registered interest and principal securities (STRIPS) in SDLs as announced in the Reserve Bank’s Statement on Developmental and Regulatory Policies of August 7, 2019 (Utkarsh); -
Ease of doing business in the G-sec market-hiving off servicing of compensation bonds issued in physical forms to state treasuries (Utkarsh); -
Complete the process of mirroring of gilt accounts in e-Kuber; examine the feasibility of lien marking by banks for loans against G-sec in the Reserve Bank’s e-Kuber portal; and review guidelines on subsidiary general ledger (SGL)/ constituent subsidiary general ledger (CSGL); -
Consolidation of debt through calendar-driven, auction-based switches and buyback operations along with reissuance of securities to augment liquidity in G-sec market and facilitate fresh issuances; -
Explore the possibilities for optimising the market borrowings; develop the methodology for building up of liquidity buffer for better cash management; and consolidation of public debt data (including data on market borrowings, valuations and special securities) in the Reserve Bank’s data warehouse; -
Undertake best practices in data reporting to improve quality and veracity of data; and -
Conduct capacity building programmes for sensitising the state governments about the prudent measures of cash and debt management. 4. Conclusion VII.33 In sum, during 2019-20, combined gross market borrowings of centre and states were conducted successfully in line with the guiding principles of debt management. The Reserve Bank has also announced a number of interim measures to manage the stress on the finances of both centre and states in the wake of the COVID-19 pandemic. Going ahead, consolidation of government debt will be the key area of focus of the Reserve Bank. |