Sunil Kumar, Prabhat Kumar, Arvind Shrivastava,
Amarendra Acharya and Dipak Chaudhari* Financial outreach has assumed greater significance in the narrative on inclusive economic growth. It has become more relevant in the Indian context after dedicated policy initiatives undertaken by the government to expand the outreach of formal financial services. Against this backdrop, this paper attempts to analyse the relationship between financial outreach and economic growth at the sub-national level in India over the period 1996–2015. The banking outreach index, computed across states, depicts improving trends but with widening divergence at the sub-national level over the study period. Further, the study finds a positive and statistically significant impact of financial outreach on per capita income growth. The role of development expenditure and social development indicators in propelling growth is also found to be significant. JEL Classification : G21, G28, G29, O23, R51 Keywords : Sub-national, economic growth, financial deepening, banking outreach, financial intermediation, developmental expenditure, social indicators Introduction Financial outreach has assumed a significant place in the narrative on inclusive economic growth, especially in emerging market economies (EMEs), over the last few decades. Financial outreach, which aims at bringing excluded segments of society into the mainstream economy, leads to reallocation of resources through financial intermediation, thereby contributing to equitable growth. It is a well-established fact that finance/capital is one of the key factors of production and financial outreach would provide access to this factor to the economically excluded segments. Demirguc-Kunt and Levine (2009) make a similar argument and underline that financial system could also affect the allocation of capital and bridge the gap between the rich and poor by influencing certain capabilities such as entrepreneurship, education, etc. Financial outreach could lead to more allocation of credit to the excluded segment and provide them an opportunity to become an innovator, eventually leading to more productive economic activities by this group of people. Along similar lines, Townsend and Ueda (2006) highlight the changes in the financial system that can affect both aggregate production and the share of credit, which may shift the demand for low and high-skilled workers with commensurate implications for distribution of income1. Financial outreach also inculcates saving habit in the masses and enhance national savings and investment. India embarked on the banking outreach journey way back in the 1970s, with the nationalisation of 14 commercial banks in 1969, when branch opening by the commercial banks was regulated with special dispensation for the unbanked and rural areas. Banking outreach, however, got a renewed fillip in the second half of the 2000s when the Reserve Bank of India (RBI) urged banks in its mid-term review of the ‘Annual Policy Statement for 2015–16’ to make available a basic banking ‘no frills’ account either with ‘nil’ or very low minimum balances as well as with low charges that would make such accounts accessible to vast sections of the population and ensure greater financial inclusion. Another milestone in banking outreach was the announcement of the Pradhan Mantri Jan Dhan Yojana (PMJDY) by the Government of India in 2014 aimed at providing basic financial services (such as banking/ savings and deposit accounts, remittance, credit, insurance, pension) to the masses in an affordable manner. These efforts have changed the landscape of banking outreach with monumental success both in terms of bank accounts and deposits accrued. In theory, various models show that financial intermediaries, instruments and markets help to reduce transaction costs and encourage saving habits, investment decisions and promote economic growth. Another set of theoretical literature shows the dynamic interactions between finance and growth where the financial system influences economic growth, and the economic growth transforms development of financial system. Miller (1988) argues that financial markets contribute to economic growth, while Bagehot (1873), Schumpeter (1911), Gurley and Shaw (1955), Goldsmith (1969), and McKinnon (1973) have all supported the idea that finance leads to economic growth. Despite the fact that there is a substantial literature demonstrating that financial outreach and economic growth assumes a positive relationship, there are however, a couple of papers that question the relationship (Ardic and Domar, 2006). Against this backdrop, this study attempts to analyse the nexus between banking outreach and economic growth at the sub-national2 level in India. Several researchers (Chakraborty, 2010; Giri and Mohapatra 2012; Kumar, Sarkar and Bonnerjee, 2014; Pradhan et al., 2014) have studied various aspects of banking outreach in India in some form or other. A study by Ghosh (2011) examines the impact of financial outreach on per capita income growth at the sub-national level in India during 1973 to 2004. Thereafter, two important policy interventions (i.e., no-frills account and PMJDY) have taken place and, therefore, a re-examination of the financial outreach in the recent period makes eminent sense. This study differs from Ghosh (2011) both in terms of coverage of period as well as explanatory variables. This study covers the sample period of 1996–2015. It has also considered state-level control variables including fiscal and human development indicators, which are different from the control variables (share of manufacturing in GSDP) used by Ghosh (2011). Financial outreach and banking outreach terms have been used interchangeably in the study. Although there is no clear distinction in the literature between financial outreach and financial deepening, most studies have taken number of bank branches, Automated Teller Machines (ATMs) and number of accounts as financial outreach/access variables. Credit and deposit, which indicate borrowing and saving, respectively, are used as financial deepening indicators. Five variables have been used for construction of the Banking Outreach Index (BOI). These are standard variables considered in the literature for measuring banking and economic development. One thing that is common amongst all these variables is that an increase in their values indicates an improvement in banking outreach. The presence of a bank branch in the vicinity acts as an important indicator of banking development as it can facilitate people to do banking, i.e., save and deposit money in their account and also avail credit. In recent times, the advancement of mobilephones, finternet banking and presence of e-wallets have helped to overcome the hassle of having a physical (brick and mortar) branch. The data on the technology driven banking services, however, are not available for the entire sample period, as these technologies have gained momentum recently. Besides, taking branches in terms of population (i.e., number of branches per lakh population) may not be the appropriate indicator for some of the sparsely populated states of the country, especially the north-east where branches per geographical unit of area (say, per 1,000 sq. km.) may be a more appropriate indicator. But for the sake of uniformity, we have considered number of bank branches per lakh population as the indicator of financial outreach in this study. The number of credit and deposit accounts standardised with population have limitations as the indicators of financial outreach, as these not always reflect the intensity of banking activity. Thus, at times, the credit-deposit ratio is regarded as a better indicator of banking development. However, with a view to ascertaining the effects of credit and deposit on economic growth separately, both the variables have been considered instead of one (credit-deposit ratio). The paper measures the impact of the banking outreach variables, viz., number of credit accounts per lakh population, per capita credit, per capita deposits, and number of deposit accounts per lakh population on per capita income growth. It also examines the impact of per capita development expenditure and literacy rate of the states on economic growth. The paper is divided into six sections: Section II draws lessons from the existing literature; stylised facts on banking outreach in India are given in Section III; data and methodology are explained in Section IV; Section V explains the empirical findings; and the concluding observations are presented in Section VI. Section II Learning from the Existing Literature It is generally acknowledged that the financial system contributes to economic growth by facilitating efficient allocation of resources among competing uses. The conceptual link between finance and growth were highlighted a century back by two seminal contributions (Bagehot, 1873 and Schumpeter, 1911). The classical economic growth theorists, such as Ricardo (1891), focussed on scarcity of physical factors of production such as land and capital (e.g., machinery), as constraints on economic growth, but not the financial intermediation and financial markets. It was Schumpeter who brought financial intermediaries and innovation in the economic growth narrative. Financial markets play an important role in the growth process by channelling funds to the most efficient sectors and fostering entrepreneurial innovation (Schumpeter, 1911). Even after the works of Schumpeter, several development theorists ignored the role of financial markets. But McKinnon (1973) and Shaw (1973) advocated the importance of a successful financial system for economic development and, thus, brought back finance into the development theory discourse. Stiglitz (2010) also noted an important contribution of financial markets to economic growth. At the same time, some economists do not subscribe to the idea of positive contribution of finance to growth. For example, Robinson (1952) explains that economic prosperity indirectly leads to financial development in response to the growing demand for funds. Lucas (1988) also does not accept the finance-growth nexus and advocates that finance is an ‘over-stressed’ determining factor of economic growth. Zingales (2015) argues that the excessive growth of finance in the absence of a proper rule-based framework could degenerate into rent-seeking activity affecting long-term growth adversely. Thus, there are broadly two schools of thought with differing views on the role of finance/financial markets in economic growth. In India, after the initiation of economic reforms in 1991, a transformed financial sector led to increased financial outreach accompanied by reduction in the cost of funds and thereby improved economic activities in the economy. Growing empirical work has shown strong linkages between financial development, economic growth and reduction of poverty in India. The access to finance has played a critical role in enabling people to rise above poverty by way of improving productivity (Banerjee and Newman, 1993). Binswanger and Khandker (1995) and Eastwood and Kohli (1999) investigate the impact of Indian rural banks’ expansion programme and find that the programme has resulted into decline in rural poverty and increase in non-agricultural employment. A similar positive impact on poverty reduction is also echoed by Burgess, Pande and Wong (2005) in India between the 1970s and the 1990s when banks were required to open four branches in unbanked locations for every new branch opened in an urban area. During this period, about 30,000 rural bank branches were established. A study by the World Bank provides direct evidence that this expansion of bank branch network had a positive impact on financial inclusion, thereby leading to a considerable decline in rural poverty (World Bank, 2014). A study by Ghosh (2011) using data for major states in India from 1973 to 2004, finds a significant impact of financial outreach on economic growth with demographic outreach having a stronger impact than geographical outreach. Empirical studies find positive impact of financial outreach on economic growth in case of other emerging markets and developing economies as well. For example, Kidanemariam and Daniel (2015) make an assessment of financial inclusion in 26 Asian countries using dynamic panel data analysis and find positive and statistically significant contribution of financial inclusion to the gross domestic product (GDP) per capita. Another study by Odhiambo (2015) finds positive impact of financial deepening on economic growth in Kenya. Apergis, Filippidis and Economidou (2007), using panel integration techniques for a dynamic heterogeneous panel of 15 OECD and 50 non-OECD countries from 1975 to 2000, find the existence of a long-term equilibrium relationship between financial deepening and economic growth. Ndebbio (2004) examines the role of financial development in the African countries and advocates for improvement in financial development/intermediation by increasing real money balances through elimination of fiscal deficit and removal of hindrances in resource allocation by financial institutions in order to promote growth. Ardic and Domar (2006), based on provincial data of Turkey for the period 1996–2001, evaluate the effects of financial sector outreach on economic growth. In contrast with the earlier literature, this study finds a negative relationship between financial deepening and economic growth, which is attributed to crowding out of private investment as banks financed the Turkish Treasury. Bangake and Eggoh (2009), covering nearly 71 countries consisting of both developed and developing economies, find a positive relationship between financial development and economic growth but the degree of such relationship depends on income level. It can be seen from the review of literature that debate on impact of financial outreach on growth is not settled. The bone of contention being that financial outreach may not always have a positive impact on growth. Rather there are studies, which have found the impact to be opposite. Thus, this study attempts to re-examine the issue at sub-national level of governments in India, in a situation where a whole lot of initiatives have been taken on financial outreach. Section III Stylised Facts on Financial Outreach in India The banking sector in India has made rapid strides in scaling business and financial outreach both demographically and geographically, especially over the last two decades. With the entry of new private sector banks, competition in the banking sector has increased significantly. At the same time, both the Reserve Bank of India and the Government of India have been relentlessly pursuing the policies aimed at improving financial outreach, such as bank branch opening in unbanked areas, no frills accounts, and PMJDY. Consequently, all banking outreach indicators have shown significant improvement during 1996-2015. The number of bank branches per lakh population at the national level improved significantly during 1996-2015. There has been a remarkable improvement across states (barring Bihar and Madhya Pradesh) in the number of bank branches (Chart 1). 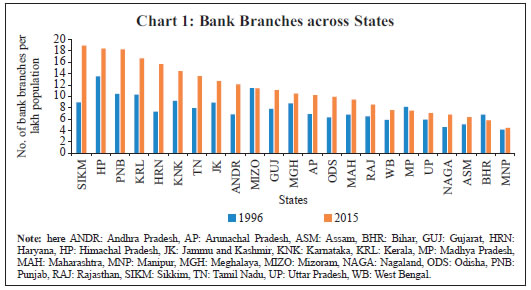 A similar improvement is seen in the banking outreach index over the above-mentioned period (Chart 2). Looking at the growth of other financial outreach variables, it can be seen that they have also improved substantially over the period. The banking outreach can also be seen in the form of rise in credit-deposit ratio over the same period in majority of states (Chart 3). The credit to GSDP ratio is considered as a major indicator to assess financial outreach, and it shows growth in the sample period, indicating improvement in financial outreach at the state level (Chart 4). Along with rapid progress in various financial outreach indicators, some states have shown tremendous improvement in per capita income while others have grown at a moderate pace (Chart 5). The stylised facts presented above in the charts prima facie, indicate a positive association between progress in financial outreach and per capita income over the last two decades. However, this relationship needs further empirical investigation to arrive at a firm conclusion. Section IV Data and Methodology Data We have used three sets of variables in this study. The first set includes per capita GSDP of 23 states, including Jharkhand, Chhattisgarh and Uttarakhand. Adjustment has been made in other variables for these states and Bihar, Madhya Pradesh and Uttar Pradesh. The second set mainly contains banking outreach variables, i.e., number of bank branches per lakh population; number of deposit accounts per lakh population; per capita deposits; number of credit accounts per lakh population; and per capita credit. The banking outreach variables pertain to the commercial banks. In order to ensure robustness of empirical exercise, some additional control variables, i.e., per capita development expenditure of state governments (representing state government efforts to promote growth rate of the state), and literacy rate are used in the analysis. The sources for data include the Central Statistics Office (CSO), Government of India, Handbook of Instructions Basic Statistical Returns 1 and 2 and Handbook of Statistics on Indian States (2005–2016), Reserve Bank of India and the Census of India. A brief description of the above-mentioned variables i s given in Table 1. | Table 1: Variables and Expected Outcomes | | Variables | Notation | Description | Expected impact on Income | | Income | PCGSDP | Per capita income at the sub-national level | negative | | Bank Branches | Branches | Bank branches per lakh population | positive | | Deposit Accounts | AcDeposits | Number of deposit accounts per lakh population | positive | | Deposits | PcDeposits | Per capita deposits | positive | | Credit Accounts | AcCredit | Number of credit accounts per lakh population | positive | | Credit | PcCredit | Per capita credit | positive | | Literacy | Literacy | Literacy rate | positive | | Development expenditure | Devexp | Per capita development expenditure | positive |
Methodology Two indices have been constructed to measure banking outreach. The first banking outreach index (BOI-1) is constructed by normalising the variables and applying equal weights. The banking outreach variables are normalised by dividing the series with the highest value of the given indicator in the series. Finally, all normalised series are added together and divided by the number of variables (five in this case), implying equal weights to all the indicators. The principal component analysis (PCA) is also used to assign weights to the banking outreach variables to calculate alternative form of BOI (BOI-2). Although some banking outreach variables depict convergence across states, the overall banking outreach index shows divergence over the sample period. The BOIs are presented below: BOI1 = ΣNormalised Outreach Variables / Number of Outreach Variables (n) BOI2 =Σ(Normalised Outreach Variables * Weights derived from PCA) In order to empirically assess the relationship between growth in per capita income and banking outreach indicators, the generalised method of moments (GMM) model has been used keeping in view its superiority in handling the endogeneity problem. The dependent as well as independent and control variables are used in log form. The advantage of using log form in the estimation is that the coefficient of each variable can be read as the elasticity of per capita income growth with respect to the respective variable. Most of the studies on financial inclusion fail to account for the problem of endogeneity (Allen et al., 2012; Sarma and Pais, 2011). The application of GMM methodology on panel data is expected to control for the potential endogeneity of all explanatory variables (Roodman, 2009). GMM estimators by Arellano and Bond (1991) has been used for the dynamic panel data. As all variables in log form have been found to be integrated of order one, i.e., I(1) process (see appendix Table A.4), the estimation is carried out in first difference (indicated by D1). The model specification is as follows: 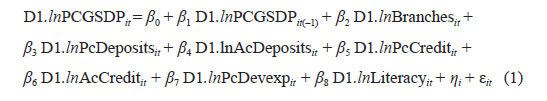 Where η is an unobserved state-specific effect, ε is the error term and i and t represent state and time period, respectively. One of the major criticisms often received in model estimation by taking variables in their first difference is the loss of critical information. In order to overcome this shortcoming and also to ensure the robustness of the empirical results, we have also applied panel cointegration regression for estimating the long-term relationship between growth of per capita GSDP and banking outreach variables. Model specification for the panel cointegration is presented below: The parameters βi and δit indicate any possible member specific effect and deterministic trend, respectively. Section V Empirical Results An assessment of banking outreach index constructed using five banking outreach variables (Appendix Table A.1) indicates that the average BOI across states more than doubled over the period 1996 to 2015. The BOI-1 increased from 0.156 in 1996 to 0.346 in 2015, while BOI-2 edged up from 0.164 to 0.365 during this period. The disparity across states has, however, widened as exhibited by increase in the coefficient of variation (CoV) of BOI-1, from 29.5 in 1996 to 44.1 in 2015. Notably, the disparity in per capita GSDP has also increased among states, as suggested by increased CoV from 29.5 in 1996 to 42.2 in 2015 (Appendix Table A.2). Further, the simple correlation to get a preliminary sense of association between the dependent variable and explanatory variables is computed (Appendix Table A.3). The correlation values indicate a wide range in degree of association across variables. Taking the analysis forward, the first difference GMM model is applied to the panel data following Arellano and Bond (1991). The results of the estimation show positive association between most of the banking outreach variables and the growth of per capita GSDP (Table 2). Only the coefficient of the deposit accounts per lakh population is statistically insignificant. The control variables, viz., per capita development expenditure and literacy rate are also found to affect the growth of per capita GSDP positively and are statistically significant. | Table 2: Effects of the Banking Outreach Variables on Growth | | Difference GMM Results | | Dependent variable: per capita GSDP | | Variables | Coefficient | p-value | | Constant | 0.0024 | 0.00*** | | Per capita GSDP (t-1) | -0.0287 | 0.00*** | | Bank branches per lakh population | 0.2034 | 0.02** | | Deposit accounts per lakh population | 0.0358 | 0.49 | | Per capita deposits | 0.0848 | 0.05** | | Credit accounts per lakh population | 0.0902 | 0.10* | | Per capita credit | 0.1017 | 0.00*** | | Per capita development expenditure | 0.0357 | 0.06** | | Literacy rate | 0.1637 | 0.00*** | | Sargan Test (p-value) | 0.74 | | A-B test for AR(2) (p-value) | 0.82 | | Note: ***, **, and * denote significance at 1 per cent, 5 per cent and 10 per cent confidence levels, respectively. All variables are in log form and in 1st differences. |
| Table 3: Economic Growth and Banking Outreach Index Relationship | | Dependent variable: Per capita GSDP | | Variables | GMM Dynamic Panel Estimation | | Specification I | Specification II | | Coeff. | p- value | Coeff. | p- value | | Constant | 0.0014 | 0.00*** | 0.0014 | 0.00*** | | Per Capita GSDP (t-1) | -0.0288 | 0.00*** | -0.0309 | 0.00*** | | BOI-1 | 0.2508 | 0.00*** | | | | BOI-2 | | | 0.2559 | 0.00*** | | Per Capita Development Expenditure | 0.0864 | 0.00*** | 0.0848 | 0.00*** | | Literacy Rate | 0.2617 | 0.00*** | 0.2503 | 0.00*** | | Sargan Test (p-value) | 0.54 | 0.54 | | A-B test for AR(2) (p-value) | 0.87 | 0.88 | | Note: ***, **, and * denote significance at 1 per cent, 5 per cent and 10 per cent confidence levels, respectively. All variables are in log form and in 1st difference. | In the next step, banking outreach variables are replaced with BOI in the dynamic panel GMM regression estimation. The results confirm the positive impact of banking outreach on per capita income growth (Table 3). The control variables i.e., per capita development expenditure and education have also positive effect on growth of per capita GSDP. The panel cointegration test is carried out to corroborate the results of panel GMM model. All variables in log form are found to be integrated of order one, i.e., I(1) process. The Kao test confirmed that variables under consideration share cointegrating relationship (Table 4). | Table 4: Kao Residual Co-integration Test | | | t-Statistic | Prob. | | ADF | -1.90 | 0.03 | | Note: Residual-based ADF test. |
| Table 5: Panel Fully Modified Ordinary Least Squares (FMOLS) | | Dependent variable: per capita GSDP | | Variables | Coefficient | p-value | | Bank Branches per lakh population | 0.34 | 0.00*** | | Deposit Accounts | -0.06 | 0.26 | | Per Capita Deposits | 0.11 | 0.00*** | | Credit Accounts | 0.06 | 0.12 | | Per Capita Credit | 0.07 | 0.00*** | | Literacy Rate | -0.09 | 0.66 | | Per Capita Development Expenditure | 0.17 | 0.00*** | | R2 | 0.96 | Mean dependent variable | 4.41 | | Adjusted R2 | 0.95 | S.D. dependent variable | 0.21 | | S.E. of Regression | 0.041 | Sum squared residuals | 0.6939 | | Note: ***, **, and * denote significance at 1 per cent, 5 per cent and 10 per cent confidence levels, respectively. All variables are in log form. | The long run association of banking outreach variables with economic growth is examined by estimating a fully modified ordinary least squares panel model (FMOLS). The results of panel FMOLS indicate that all banking outreach variables, except deposit accounts and credit accounts, have statistically significant positive impact on the growth of per capita GSDP (Table 5). Even the additional control variable, i.e., per capita development expenditure, has been found positively impacting the growth of per capita GSDP. The panel FMOLS is re-estimated by substituting banking outreach variables with BOI, which yield more or less similar results, i.e., banking outreach impacts the growth in per capita income at sub-national level positively (Table 6). Overall, the results corroborate the findings of the panel dynamic GMM estimation. Section VI Conclusion Financial outreach in India has expanded considerably over the last two decades as evident from the rapid improvement in various banking outreach variables as well as the overall banking outreach index across states. Nonetheless, the overall banking outreach index shows increasing divergence across states. Along with the banking outreach, per capita GSDP also shows increasing divergence across states. The banking outreach variables, viz. number of credit accounts per lakh population, per capita credit, and per capita deposits displayed positive and statistically significant impact on per capita income growth. Besides, the impact of additional control variables, viz., per capita development expenditure was also found positive and statistically significant. The findings of the study point to large potential to accelerate the pace of growth by enhancing financial outreach across states in India. Additionally, convergence in financial outreach across the states especially by way of improving the level in those states which are lagging behind, would help in reducing state-level disparity in the per capita income. The role of the government in propelling growth is also important as evident from the coefficient of development expenditure. Thus, the level of development expenditures of governments across states also explain the divergence in income level across states, besides financial outreach and other factors. | Table 6: Panel Fully Modified Ordinary Least Squares (FMOLS) | | Dependent variable: Per capita GSDP | | Variables | Specification | | Specification I | Specification II | | Coefficient | p-value | Coefficient | p- value | | BOI-1 | 0.39 | 0.00*** | | | | BOI-2 | | | 0.37 | 0.00*** | | Per Capita Development Expenditure | 0.25 | 0.00*** | 0.25 | 0.00*** | | Literacy Rate | 0.22 | 0.31 | 0.20 | 0.36 | | R2 | 0.9580 | 0.9573 | | Adjusted R2 | 0.9554 | 0.9547 | | S.E. of Regression | 0.0434 | 0.0437 | | Mean dependent variable | 4.4138 | 4.4138 | | S.D. dependent variable | 0.2058 | 0.2059 | | Sum Squared Residuals | 0.7752 | 0.7882 | | Note: ***, **, and * denotes significance at 1 per cent, 5 per cent and 10 per cent confidence levels, respectively. All variables are in log form. |
References Alliance for Financial Inclusion (2011). The G20 principles for innovative financial inclusion: Bringing the principles to life, eleven country case studies, contribution from the alliance for financial inclusion (AFI) network of developing country policymakers. Anzoategui, D., Demirgüç-Kunt, A., and Martínez Pería, M. S. (2011). Remittances and financial inclusion: evidence from El Salvador. The World Bank. Apergis, N., Filippidis, I., and Economidou, C. (2007). Financial deepening and economic growth linkages: a panel data analysis. Review of World Economics, 143(1), 179-198. Ardic, O. P., & Damar, H. E. (2006). Financial sector deepening and economic growth: Evidence From Turkey. Asian Development Bank Institute (2014). Financial inclusion in Asia country surveys. Asian Development Bank, (2012). Technical assistance report. Improving financial inclusion in Asia and the Pacific, Manila, Asian Development Bank. Bagehot, W. (1873). Lombard Street, 1962 ed. Irwin, Homewood, IL. Balakrishnan, R., Steinberg, C., and Syed, M. M. H. (2013). The elusive quest for inclusive growth: growth, poverty, and inequality in Asia (No. 13-152). International Monetary Fund. Banerjee, A. V., and Newman, A. F. (1993). Occupational choice and the process of development. Journal of political economy, 101(2), 274-298. Bangake, C., and Eggoh, J. C. (2009). International capital mobility in African countries: A panel cointegration analysis. Beck, T., and Demirguc-Kunt, A. (2009). Financial institutions and markets across countries and over time-data and analysis. The World Bank. Beck, T., Demirguc-Kunt.,A. and Honahan, P. (2009). Access to financial Services: Measurement, impact, and policies. The World Bank Research Observer Advance Access, Oxford University Press. Bencivenga, V.R. and Smith, B.D. (1991). Financial intermediation and endogenous growth. The Review of Economic Studies, 58(2): 195-209. Binswanger, H.P., and S.R. Khandker (1995). The impact of formal finance on the rural economy of India, Journal of Development Studies, 32(2), pp. 234–65. Blackburn, K., Bose, N. and Capasso, S. (2005). Financial development, financing choice and economic growth. Review of Development Economics, 9(2):135-149. Bruhn, M., and Love, I. (2014). The real impact of improved access to finance: evidence from Mexico. The Journal of Finance, 69(3), 1347-1376. Burgess, R., R. Pande, and G. Wong. (2005). Banking for the poor: evidence from inclusion: bringing the principles to life, Global partnership for financial inclusion in India, Journal of the European Economic Association, 3(2–3), pp. 268–78. Cammack, P. (2012). Risk, social protection and the world market. Journal of Contemporary Asia 42 (3): 359– 377. Carroll, T. (2015). Access to finance and the death of development in the Asia- Pacific. Journal of Contemporary Asia, vol.45, no.1: pp. 139-166. CGAP (Consultative Group to Assist the Poor). (2009). Financial access 2009: measuring access to financial services around the world. Washington, DC: CGAP, World Bank. CGAP, (2010). Innovative financial inclusion, principle and report on innovative financial inclusion from the access through inclusion sub-group of the G20 financial inclusion expert group, May 25. Chakraborty, I. (2010). Financial development and economic growth in India: an analysis of the post-reform period, South Asia Economic Journal, 11(2), pp. 287–308. Chenery, H., and A. Strout (1966). Foreign assistance and economic development, American Economic Review, 56(4), Part 1, pp. 679–733 Chibba, M. (2008). Poverty reduction in developing countries: No consensus but plenty of solutions. World Economics 9(1): 197–200. Creane, S., Rishigoyal, A. Mushfiqmobar, A.K and Randas, A.B. (2004). Financial sector development in the middle east and north africa. IMF Working Paper 04/201, Washington, D.C. Crone, D., K. (1988). State, social elites, and government capacity in southeast asia. World Politics, Vol. 40, No. 2, pp. 252-268. Culpeper, R. (2012). Financial sector policy and development in the wake of the global crisis: The role of national development banks. Third World Quarterly, 33(3), 383-403. Demirgüç-Kunt, A., & Levine, R. (2009). Finance and inequality: Theory and evidence. Annu. Rev. Financ. Econ., 1(1), 287-318. Eastwood, R., and Kohli, R. (1999). Directed credit and investment in smallscale industry in India: Evidence from firm‐level data 1965–78. The Journal of Development Studies, 35(4), 42-63. Fishkin, J., Keniston, K., and McKinnon, C. (1973). Moral reasoning and political ideology. Journal of Personality and social Psychology, 27(1), 109. Fry, M. J. (1978). Money and capital or financial deepening in economic development? Journal of money, credit and banking, 10(4), 464-475. Ghosh, S. (2011). Does financial outreach engender economic growth? evidence from indian states. Journal of Indian Business Research, 3(2), 74-99. Giri, A.K., and G. Mohapatra (2012). Financial development and economic growth: evidence from Indian economy. International Journal of Applied Research and Studies, 1(2), pp. 1–17. Global Financial Development Report, 2014 , World Bank. Goldsmith, R. W. (1969). Financial structure and development (No. HG174 G57). Gurley, J. G., & Shaw, E. S. (1955). Financial aspects of economic development. The American Economic Review, 45(4), 515-538. Kumar, S., Sarkar, J., and Bonnerjee, S. (2014). Impact of banking penetration on economic growth: a state-wise comparative study. Business Perspectives and Research, 2(2), 47-64. Levine, R., Loayza, N., and Beck, T. (2000). Financial intermediation and growth: Causality and causes. Journal of monetary Economics, 46(1), 31-77. Lucas Jr, R. E. (1988). On the mechanics of economic development. Journal of monetary economics, 22(1), 3-42. Maimbo, S. M., and Melecky, M. (2014). Financial sector policy in practice: benchmarking financial sector strategies around the world. The World Bank. McKinnon, R., & Shaw, E. (1973). Financial deepening in economic development. Washington, Brookings Institution. Ndebbio, J.E.U. (2004). Financial deepening, economic growth and development: Evidence from selected sub-saharan african countries. Pradhan, R.P., S. Tripathy, S. Pandey, and S.K. Bele (2014). Banking sector development and economic growth in ARF countries: the role of stock markets”, Macroeconomics and Finance in Emerging Market Economies, 7(2), pp. 208–29. Ricardo, D. (1891). Principles of political economy and taxation. G. Bell. Robinson J. (1952).The Rate of Interest, Other Essays. London: Macmillan. Roodman, D. (2009). A Note on the theme of too many instruments. Oxford Bulletin of Economics and statistics, 71(1), pp. 135–58. Schumpeter, J. A. (1911). The theory of economic development. Translated by R. Opie. Harvard University Press: Cambridge, MA, 1934. Stiglitz, J. (2010). Financial innovation: Against the motion that financial innovation boosts economic growth. The Economist, February 23 - March 3. Townsend, R.M., and K. Ueda (2006). Financial deepening, inequality, and growth: a model-based quantitative evaluation. The Review of Economic Studies, 73(1), pp. 251–93. Zingales, L. (2015). Presidential address: Does finance benefit society? Journal of Finance, 70(4), 1327-1363.
APPENDIX | Table A.1: Banking Outreach Index (BOI) | | Year | BOI-1 | BOI-2 | Average BOI | Standard Deviation | Coefficient of Variation | | 1996 | 0.156 | 0.164 | 0.16 | 0.05 | 29.5 | | 1997 | 0.154 | 0.161 | 0.16 | 0.05 | 30.6 | | 1998 | 0.150 | 0.157 | 0.16 | 0.05 | 32.5 | | 1999 | 0.150 | 0.157 | 0.16 | 0.05 | 33.6 | | 2000 | 0.146 | 0.153 | 0.15 | 0.05 | 36.0 | | 2001 | 0.146 | 0.152 | 0.15 | 0.06 | 36.6 | | 2002 | 0.148 | 0.154 | 0.15 | 0.06 | 38.1 | | 2003 | 0.149 | 0.156 | 0.16 | 0.06 | 38.9 | | 2004 | 0.153 | 0.159 | 0.16 | 0.07 | 41.1 | | 2005 | 0.160 | 0.167 | 0.17 | 0.07 | 41.8 | | 2006 | 0.169 | 0.176 | 0.18 | 0.07 | 42.4 | | 2007 | 0.179 | 0.187 | 0.19 | 0.08 | 42.5 | | 2008 | 0.195 | 0.203 | 0.20 | 0.09 | 44.3 | | 2009 | 0.208 | 0.217 | 0.22 | 0.10 | 43.8 | | 2010 | 0.225 | 0.235 | 0.23 | 0.10 | 43.5 | | 2011 | 0.241 | 0.252 | 0.25 | 0.11 | 43.9 | | 2012 | 0.263 | 0.276 | 0.28 | 0.12 | 44.2 | | 2013 | 0.288 | 0.302 | 0.30 | 0.13 | 43.8 | | 2014 | 0.321 | 0.338 | 0.34 | 0.15 | 43.8 | | 2015 | 0.346 | 0.365 | 0.36 | 0.16 | 44.1 | | Source: Authors’ calculations. |
| Table A.2: Per Capita GSDP | | Year | Average Per Capita GSDP | Standard Deviation of Per Capita GSDP | Coefficient of Variation | | 1996 | 18042.0 | 5319.3 | 29.5 | | 1997 | 18804.6 | 5574.0 | 29.6 | | 1998 | 19322.7 | 5648.6 | 29.2 | | 1999 | 19898.0 | 5698.5 | 28.6 | | 2000 | 20586.9 | 5831.0 | 28.3 | | 2001 | 20804.9 | 6135.8 | 29.5 | | 2002 | 21509.3 | 6373.2 | 29.6 | | 2003 | 21962.2 | 6837.0 | 31.1 | | 2004 | 23335.1 | 7132.6 | 30.6 | | 2005 | 24879.2 | 7795.8 | 31.3 | | 2006 | 26543.4 | 8905.7 | 33.6 | | 2007 | 28524.1 | 9894.4 | 34.7 | | 2008 | 30442.5 | 10905.9 | 35.8 | | 2009 | 32091.7 | 11048.3 | 34.4 | | 2010 | 34973.2 | 13466.1 | 38.5 | | 2011 | 37581.1 | 14940.5 | 39.8 | | 2012 | 39403.5 | 16069.7 | 40.8 | | 2013 | 40551.0 | 17260.7 | 42.6 | | 2014 | 43232.2 | 18117.9 | 41.9 | | 2015 | 45569.6 | 19210.6 | 42.2 | | Source: Authors’ calculations. |
| Table A.3: Correlations Amongst Dependent and Independent Variables | | Variables | Per Capita GSDP | Bank Branches per lakh population | Deposit Accounts | Per Capita Deposits | Credit Accounts | Per Capita Credit | Per Capita Development Expenditure | | Per Capita GSDP | 1 | | | | | | | | Bank Branches per lakh population | 0.6464 | 1 | | | | | | | Deposit Accounts | 0.7223 | 0.7823 | 1 | | | | | | Per Capita Deposits | 0.5179 | 0.233 | 0.3862 | 1 | | | | | Credit Accounts | 0.5447 | 0.4522 | 0.6473 | 0.1683 | 1 | | | | Per Capita Credit | 0.7216 | 0.4103 | 0.6581 | 0.4418 | 0.6405 | 1 | | | Per Capita Development Expenditure | 0.542 | 0.3371 | 0.2422 | 0.1402 | 0.0519 | 0.1893 | 1 | | Source: Authors’ calculations. |
| Table A.4: The estimated summary of panel unit root test | | Variable | PP - Fisher Chi-square (p-values) | ADF-Fisher Chi-square (p-values) | | log(pcGSDP) | 1.00 | 1.00 | | D1.log(pcGSDP) | 0.00 | 0.00 | | log(BBPLP) | 1.00 | 1.00 | | D1 log(BBPLP) | 0.00 | 0.00 | | log (DPOACPLP) | 1.00 | 1.00 | | D1.log (DPOACPLP) | 0.00 | 0.00 | | log(PCDEPO) | 1.00 | 1.00 | | D1.log(PCDEPO) | 0.00 | 0.00 | | log(CRDACPLP) | 1.00 | 1.00 | | D1.log(CRDACPLP) | 0.00 | 0.00 | | log(PCCRED) | 1.00 | 1.00 | | D1.log(PCCRED) | 0.00 | 0.00 | | log(EDUCLIT) | 1.00 | 1.00 | | D1.log(EDUCLIT) | 0.00 | 0.00 | | log (PCDEVEXP) | 1.00 | 1.00 | | D1.log (PCDEVEXP) | 0.00 | 0.00 |
|